Canton - Baltimore City Health Department
Canton - Baltimore City Health Department
Canton - Baltimore City Health Department

Create successful ePaper yourself
Turn your PDF publications into a flip-book with our unique Google optimized e-Paper software.
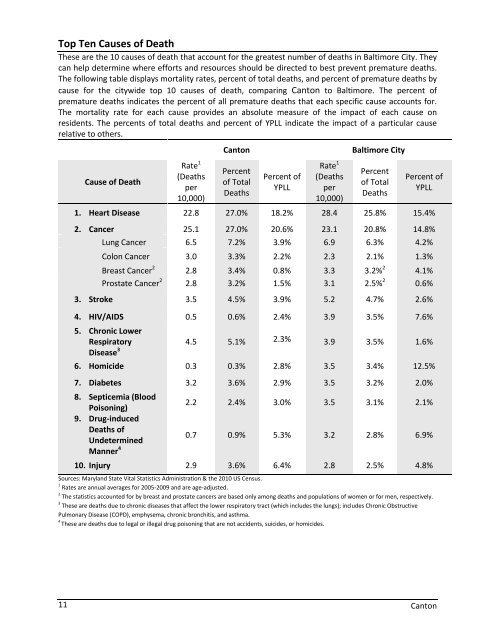
Top Ten Causes of Death<br />
These are the 10 causes of death that account for the greatest number of deaths in <strong>Baltimore</strong> <strong>City</strong>. They<br />
can help determine where efforts and resources should be directed to best prevent premature deaths.<br />
The following table displays mortality rates, percent of total deaths, and percent of premature deaths by<br />
cause for the citywide top 10 causes of death, comparing <strong>Canton</strong> to <strong>Baltimore</strong>. The percent of<br />
premature deaths indicates the percent of all premature deaths that each specific cause accounts for.<br />
The mortality rate for each cause provides an absolute measure of the impact of each cause on<br />
residents. The percents of total deaths and percent of YPLL indicate the impact of a particular cause<br />
relative to others.<br />
11<br />
Cause of Death<br />
Rate 1<br />
(Deaths<br />
per<br />
10,000)<br />
<strong>Canton</strong> <strong>Baltimore</strong> <strong>City</strong><br />
Percent<br />
of Total<br />
Deaths<br />
Percent of<br />
YPLL<br />
Rate 1<br />
(Deaths<br />
per<br />
10,000)<br />
Percent<br />
of Total<br />
Deaths<br />
Percent of<br />
YPLL<br />
1. Heart Disease 22.8 27.0% 18.2% 28.4 25.8% 15.4%<br />
2. Cancer 25.1 27.0% 20.6% 23.1 20.8% 14.8%<br />
Lung Cancer 6.5 7.2% 3.9% 6.9 6.3% 4.2%<br />
Colon Cancer 3.0 3.3% 2.2% 2.3 2.1% 1.3%<br />
Breast Cancer 2 2.8 3.4% 0.8% 3.3 3.2% 2 4.1%<br />
Prostate Cancer 2<br />
2.8 3.2% 1.5% 3.1 2.5% 2 0.6%<br />
3. Stroke 3.5 4.5% 3.9% 5.2 4.7% 2.6%<br />
4. HIV/AIDS 0.5 0.6% 2.4% 3.9 3.5% 7.6%<br />
5. Chronic Lower<br />
Respiratory<br />
Disease 3<br />
4.5 5.1% 2.3% 3.9 3.5% 1.6%<br />
6. Homicide 0.3 0.3% 2.8% 3.5 3.4% 12.5%<br />
7. Diabetes 3.2 3.6% 2.9% 3.5 3.2% 2.0%<br />
8. Septicemia (Blood<br />
Poisoning)<br />
9. Drug-induced<br />
Deaths of<br />
Undetermined<br />
Manner 4<br />
2.2 2.4% 3.0% 3.5 3.1% 2.1%<br />
0.7 0.9% 5.3% 3.2 2.8% 6.9%<br />
10. Injury 2.9 3.6% 6.4% 2.8 2.5% 4.8%<br />
Sources: Maryland State Vital Statistics Administration & the 2010 US Census.<br />
1 Rates are annual averages for 2005-2009 and are age-adjusted.<br />
2 The statistics accounted for by breast and prostate cancers are based only among deaths and populations of women or for men, respectively.<br />
3 These are deaths due to chronic diseases that affect the lower respiratory tract (which includes the lungs); includes Chronic Obstructive<br />
Pulmonary Disease (COPD), emphysema, chronic bronchitis, and asthma.<br />
4 These are deaths due to legal or illegal drug poisoning that are not accidents, suicides, or homicides.<br />
<strong>Canton</strong>