GPS-Based Measurements of Backcountry Visitors in Parks and ...
GPS-Based Measurements of Backcountry Visitors in Parks and ...
GPS-Based Measurements of Backcountry Visitors in Parks and ...

Create successful ePaper yourself
Turn your PDF publications into a flip-book with our unique Google optimized e-Paper software.
42<br />
Journal <strong>of</strong> Park <strong>and</strong> Recreation Adm<strong>in</strong>istration<br />
Fall 2010<br />
Volume 28, Number 3<br />
pp. 42-60<br />
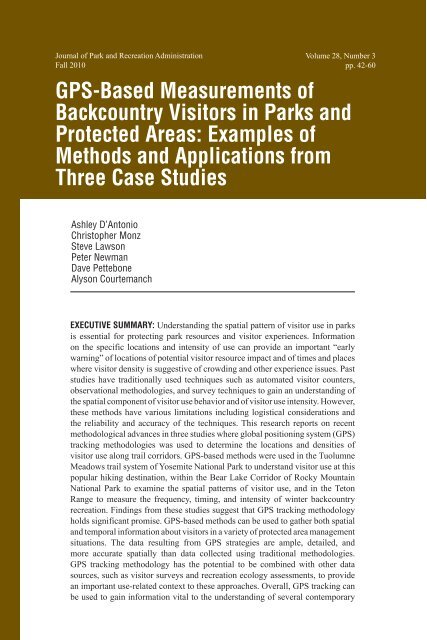
<strong>GPS</strong>-<strong>Based</strong> <strong>Measurements</strong> <strong>of</strong><br />
<strong>Backcountry</strong> <strong>Visitors</strong> <strong>in</strong> <strong>Parks</strong> <strong>and</strong><br />
Protected Areas: Examples <strong>of</strong><br />
Methods <strong>and</strong> Applications from<br />
Three Case Studies<br />
Ashley D’Antonio<br />
Christopher Monz<br />
Steve Lawson<br />
Peter Newman<br />
Dave Pettebone<br />
Alyson Courtemanch<br />
EXECUTIVE SUMMARY: Underst<strong>and</strong><strong>in</strong>g the spatial pattern <strong>of</strong> visitor use <strong>in</strong> parks<br />
is essential for protect<strong>in</strong>g park resources <strong>and</strong> visitor experiences. Information<br />
on the specific locations <strong>and</strong> <strong>in</strong>tensity <strong>of</strong> use can provide an important “early<br />
warn<strong>in</strong>g” <strong>of</strong> locations <strong>of</strong> potential visitor resource impact <strong>and</strong> <strong>of</strong> times <strong>and</strong> places<br />
where visitor density is suggestive <strong>of</strong> crowd<strong>in</strong>g <strong>and</strong> other experience issues. Past<br />
studies have traditionally used techniques such as automated visitor counters,<br />
observational methodologies, <strong>and</strong> survey techniques to ga<strong>in</strong> an underst<strong>and</strong><strong>in</strong>g <strong>of</strong><br />
the spatial component <strong>of</strong> visitor use behavior <strong>and</strong> <strong>of</strong> visitor use <strong>in</strong>tensity. However,<br />
these methods have various limitations <strong>in</strong>clud<strong>in</strong>g logistical considerations <strong>and</strong><br />
the reliability <strong>and</strong> accuracy <strong>of</strong> the techniques. This research reports on recent<br />
methodological advances <strong>in</strong> three studies where global position<strong>in</strong>g system (<strong>GPS</strong>)<br />
track<strong>in</strong>g methodologies was used to determ<strong>in</strong>e the locations <strong>and</strong> densities <strong>of</strong><br />
visitor use along trail corridors. <strong>GPS</strong>-based methods were used <strong>in</strong> the Tuolumne<br />
Meadows trail system <strong>of</strong> Yosemite National Park to underst<strong>and</strong> visitor use at this<br />
popular hik<strong>in</strong>g dest<strong>in</strong>ation, with<strong>in</strong> the Bear Lake Corridor <strong>of</strong> Rocky Mounta<strong>in</strong><br />
National Park to exam<strong>in</strong>e the spatial patterns <strong>of</strong> visitor use, <strong>and</strong> <strong>in</strong> the Teton<br />
Range to measure the frequency, tim<strong>in</strong>g, <strong>and</strong> <strong>in</strong>tensity <strong>of</strong> w<strong>in</strong>ter backcountry<br />
recreation. F<strong>in</strong>d<strong>in</strong>gs from these studies suggest that <strong>GPS</strong> track<strong>in</strong>g methodology<br />
holds significant promise. <strong>GPS</strong>-based methods can be used to gather both spatial<br />
<strong>and</strong> temporal <strong>in</strong>formation about visitors <strong>in</strong> a variety <strong>of</strong> protected area management<br />
situations. The data result<strong>in</strong>g from <strong>GPS</strong> strategies are ample, detailed, <strong>and</strong><br />
more accurate spatially than data collected us<strong>in</strong>g traditional methodologies.<br />
<strong>GPS</strong> track<strong>in</strong>g methodology has the potential to be comb<strong>in</strong>ed with other data<br />
sources, such as visitor surveys <strong>and</strong> recreation ecology assessments, to provide<br />
an important use-related context to these approaches. Overall, <strong>GPS</strong> track<strong>in</strong>g can<br />
be used to ga<strong>in</strong> <strong>in</strong>formation vital to the underst<strong>and</strong><strong>in</strong>g <strong>of</strong> several contemporary
issues <strong>in</strong> protected area management such as visitor experience <strong>and</strong> natural<br />
resource impacts, visitor-wildlife concerns, <strong>and</strong> visitor soundscape experiences.<br />
KEYWORDS: Global position<strong>in</strong>g system, visitor use patterns, visitor behavior,<br />
visitor use estimation, recreation management<br />
AUTHORS: Ashley D’Antonio is with the Department <strong>of</strong> Environment <strong>and</strong> Society,<br />
Utah State University, 5215 Old Ma<strong>in</strong> Hill, Logan, UT 84322, phone: (435)<br />
797-1009, email: ashleydantonio@gmail.com. Monz is with the Department<br />
<strong>of</strong> Environment <strong>and</strong> Society, Ecology Center, Utah State University. Lawson is<br />
with the Resource Systems Group, Inc, Burl<strong>in</strong>gton, Vermont. Newman is with<br />
the Department <strong>of</strong> Human Dimensions <strong>of</strong> Natural Resources, Colorado State<br />
University. Pettebone is with the National Park Service at Yosemite National<br />
Park. Courtemanch is with the Department <strong>of</strong> Zoology & Physiology, University<br />
<strong>of</strong> Wyom<strong>in</strong>g<br />
ACKNOWLEDGMENTS: The authors thank Karen Hockett, Logan Park, Derrick<br />
Taff, <strong>and</strong> Larry Gamble for considerable help with the design <strong>and</strong> development <strong>of</strong><br />
this study. This work was supported by grants from the Alternative Transportation<br />
<strong>in</strong> <strong>Parks</strong> <strong>and</strong> Public L<strong>and</strong>s Program adm<strong>in</strong>istered through the National Park<br />
Service <strong>and</strong> the S.J. <strong>and</strong> Jessie E. Qu<strong>in</strong>ney Foundation. The second author also<br />
thanks the Utah State Agricultural Experimentation for fund<strong>in</strong>g support dur<strong>in</strong>g<br />
several phases <strong>of</strong> this work.<br />
Participation <strong>in</strong> outdoor recreation <strong>and</strong> visitation to parks <strong>and</strong> protected areas<br />
has <strong>in</strong>creased over recent decades <strong>in</strong> the United States (Cordell, 2008) <strong>and</strong> worldwide<br />
(De Lacy & Whitmore, 2006). As the number <strong>of</strong> visitors to parks <strong>and</strong> protected areas<br />
<strong>in</strong>creases, there is potential for the expansion <strong>and</strong> proliferation <strong>of</strong> recreation resource<br />
impact <strong>and</strong> dim<strong>in</strong>ished visitor experience (Hammit & Cole, 1998; Mann<strong>in</strong>g, 1999). From<br />
a resource perspective, the extent <strong>of</strong> impact is <strong>in</strong>fluenced by the type, amount, location,<br />
<strong>and</strong> spatial <strong>and</strong> temporal distribution <strong>of</strong> visitor use (Hammit & Cole, 1998; Newsome,<br />
Moore, & Dowl<strong>in</strong>g, 2002; Monz, Cole, Marion, & Leung, 2010). As such, managers<br />
<strong>of</strong>ten f<strong>in</strong>d it useful to underst<strong>and</strong> several attributes <strong>of</strong> visitor use <strong>in</strong>clud<strong>in</strong>g the number<br />
<strong>of</strong> visitors <strong>in</strong> an area or system, spatial patterns <strong>of</strong> visitor use, <strong>and</strong> visitor behavior as<br />
possible “early warn<strong>in</strong>gs” <strong>of</strong> resource change. Similar strategies can be employed from a<br />
visitor experience perspective, as underst<strong>and</strong><strong>in</strong>g use is suggestive <strong>of</strong> issues <strong>of</strong> crowd<strong>in</strong>g<br />
<strong>and</strong> dim<strong>in</strong>ished visitor experiences. Managers can also utilize <strong>in</strong>formation related to visitor<br />
use to better underst<strong>and</strong> the relationship between impact <strong>and</strong> use, underst<strong>and</strong> trends, assign<br />
priorities for management action <strong>and</strong> facility development, <strong>and</strong> as <strong>in</strong>put for statistical <strong>and</strong><br />
simulation models <strong>of</strong> visitor use (Lawson, 2006; Leonard, Echelberger, Plumley, & Van<br />
Meter, 1980). A thorough underst<strong>and</strong><strong>in</strong>g <strong>of</strong> visitor use levels <strong>and</strong> patterns can contribute to<br />
a more complete underst<strong>and</strong><strong>in</strong>g <strong>of</strong> many important issues <strong>in</strong> protected area management<br />
<strong>in</strong>volv<strong>in</strong>g visitor experience <strong>and</strong> resource protection priorities.<br />
Past research exam<strong>in</strong><strong>in</strong>g visitor use has focused primarily on estimat<strong>in</strong>g use levels.<br />
Developed approaches can be categorized as self-count<strong>in</strong>g methods, direct-count methods,<br />
<strong>and</strong> <strong>in</strong>direct-count methods (Hollenhorst, Whisman, & Ewert, 1992; Watson, Cole, Turner,<br />
& Reynolds, 2000). The earliest count<strong>in</strong>g techniques used by managers <strong>of</strong> parks <strong>and</strong><br />
protected areas were self-count<strong>in</strong>g techniques such as voluntary registration, self-issued<br />
43
44<br />
permits, <strong>and</strong>, <strong>in</strong> some locations, m<strong>and</strong>atory permits (Wenger & Gregerson, 1964; Wagar,<br />
1969; James, 1971; Hendee & Lucas, 1973; Hollenhorst et al., 1992). However, selfcount<strong>in</strong>g<br />
techniques are subject to <strong>in</strong>accuracies due to noncompliance by visitors <strong>and</strong>, <strong>in</strong><br />
order to accurately estimate use, managers must make adjustments for noncompliance <strong>and</strong><br />
calibrate accord<strong>in</strong>gly (Thorsell, 1967; Echelberger, Leonard, & Plumley, 1981; Leatherberry<br />
& Lime, 1981). Self-registration <strong>and</strong> self-issued or m<strong>and</strong>atory permits are <strong>of</strong>ten best used<br />
<strong>in</strong> areas where access to l<strong>and</strong>s is restricted (Muhar, Arnberger, & Br<strong>and</strong>enburg, 2000). The<br />
<strong>in</strong>formation collected from self-count<strong>in</strong>g techniques is useful but <strong>of</strong>ten lacks descriptive<br />
<strong>in</strong>formation such as visitor use patterns, visitor characteristics, motivations, <strong>and</strong> behavior.<br />
Direct count<strong>in</strong>g methods such as observational techniques <strong>and</strong> surveys can provide<br />
managers with use estimations as well as more detailed <strong>in</strong>formation related to visitor use<br />
patterns <strong>and</strong> behavior. Observational techniques, whether roam<strong>in</strong>g or stationary, have<br />
the advantage <strong>of</strong> be<strong>in</strong>g unobtrusive <strong>and</strong> dem<strong>and</strong> no time on visitors (Schreuder, Tyre, &<br />
James, 1975; Hollenhorst et al., 1992; Schaick & van der Spek, 2008). However, these<br />
methodologies are time consum<strong>in</strong>g for staff <strong>and</strong> are subject to a variety <strong>of</strong> accuracy issues<br />
(Arnberger, Haider, & Br<strong>and</strong>enburg, 2005). Observational data are frequently dependent<br />
on the tra<strong>in</strong><strong>in</strong>g <strong>of</strong> a large team <strong>of</strong> technicians, <strong>and</strong> the accuracy <strong>of</strong> results relies on <strong>in</strong>terobserver<br />
reliability (Park, Mann<strong>in</strong>g, Marion, Lawson, & Jacobi, 2008). Observational<br />
studies provide visual <strong>in</strong>terpretations <strong>of</strong> visitor behavior <strong>and</strong> thus lack non-visual<br />
demographical data <strong>and</strong> detailed <strong>in</strong>formation related to visitor it<strong>in</strong>eraries or motivations<br />
(Shoval & Issacson, 2007).<br />
Survey techniques, however, can provide some <strong>of</strong> this lack<strong>in</strong>g <strong>in</strong>formation regard<strong>in</strong>g<br />
visitor use patterns, demographics, detailed it<strong>in</strong>eraries, <strong>and</strong> visitor motivations (James &<br />
Harper, 1965; Kovacs, 1970). Surveys are particularly useful <strong>in</strong> situations <strong>of</strong> dispersed<br />
visitor use where observational techniques may not be feasible (Cushwa & McG<strong>in</strong>nes,<br />
1963; James & Henley 1968; Hollenhorst et al., 1992). However, survey methodology<br />
dem<strong>and</strong>s a significant time <strong>in</strong>vestment from visitors <strong>and</strong> is susceptible to issues <strong>of</strong> accuracy<br />
(Hallo, Mann<strong>in</strong>g, Valliere, & Budruk, 2005). Often surveys exam<strong>in</strong><strong>in</strong>g visitor use patterns<br />
will require participants to recall characteristics <strong>of</strong> their visit, <strong>in</strong>troduc<strong>in</strong>g opportunities<br />
for <strong>in</strong>accuracies <strong>and</strong> biased results (Park et al., 2008). Visitor diaries may reduce issues <strong>of</strong><br />
recall bias but require an even higher dem<strong>and</strong> on visitor time than other survey techniques<br />
(Shoval & Isaacson, 2007). F<strong>in</strong>ally, the data entry <strong>and</strong> analysis result<strong>in</strong>g from survey-based<br />
studies can be extremely time consum<strong>in</strong>g <strong>and</strong> tedious (Hallo et al., 2005).<br />
As automated technology for count<strong>in</strong>g visitors became available <strong>in</strong> the late 1960s,<br />
<strong>in</strong>direct-count<strong>in</strong>g techniques became widely used <strong>in</strong> parks <strong>and</strong> protected areas to estimate<br />
visitor use levels. Indirect-count<strong>in</strong>g techniques <strong>in</strong>clude pressure plates, automatic trail<br />
counters us<strong>in</strong>g photoelectric technology, <strong>and</strong> electronic vehicle counters (James & Ripley,<br />
1963; Leonard et al., 1980; Hollenhorst et al., 1992). The use <strong>of</strong> automated counters is<br />
commonplace as they are relatively <strong>in</strong>expensive <strong>and</strong> easy to set up <strong>and</strong> ma<strong>in</strong>ta<strong>in</strong> (Watson<br />
et al., 2000). Recent technological advances <strong>in</strong> dual <strong>and</strong> array passive <strong>in</strong>frared technology<br />
have allowed automatic trail counters to collect <strong>in</strong>formation related to visitor use patterns,<br />
such as speed <strong>and</strong> direction, as well as use estimates. However, these counters are<br />
expensive <strong>and</strong> can be sensitive to temperature changes <strong>in</strong> the environment (Greene-Roesel,<br />
Diogenes, Ragl<strong>and</strong>, & L<strong>in</strong>dau, 2008). While the data from counters are clearly useful,<br />
even with technological advances, counters alone cannot provide specifics such as visitor<br />
demographics or specific visitor it<strong>in</strong>eraries (Arrowsmith & Chhetri, 2003; O’Connor,<br />
Zerger, & Itami, 2005). Visitor counter methodology is also subject to confound<strong>in</strong>g factors<br />
such as accuracy, calibration, <strong>and</strong> battery life (Pettebone, 2009).<br />
In order for managers to make the most <strong>in</strong>formed management actions, detailed,<br />
specific <strong>in</strong>formation about both visitor use <strong>in</strong>tensity <strong>and</strong> patterns is required. Moreover,
many contemporary issues <strong>in</strong> protected area management are more thoroughly understood<br />
with a detailed exam<strong>in</strong>ation <strong>of</strong> visitor use patterns. Although self-count<strong>in</strong>g, directcount<strong>in</strong>g,<br />
<strong>and</strong> <strong>in</strong>direct-count<strong>in</strong>g approaches can provide useful <strong>in</strong>formation to managers,<br />
research us<strong>in</strong>g global position<strong>in</strong>g system (<strong>GPS</strong>) technology has shown significant promise<br />
<strong>in</strong> provid<strong>in</strong>g more detailed data from which to exam<strong>in</strong>e visitor use patterns <strong>and</strong> <strong>in</strong>tensity,<br />
as well as visitor flows <strong>and</strong> densities (Hallo et al., 2005; O’Connor et al., 2000). Recent<br />
studies have used <strong>GPS</strong> track<strong>in</strong>g methodologies to collect <strong>in</strong>formation on the spatial extent,<br />
patterns, <strong>and</strong> <strong>in</strong>tensity <strong>of</strong> visitor use (Lai, Li, Chan, & Kwong, 2007; Ligtenburg, van<br />
Marwijk, Moelans, & Kuijpers, 2008). These studies <strong>in</strong>dicate that the <strong>in</strong>formation collected<br />
us<strong>in</strong>g <strong>GPS</strong>-based technology is more accurate, more detailed, <strong>and</strong> more robust than data<br />
collected from traditional methodologies (Hallo et al., 2005). Compared to observational<br />
<strong>and</strong> survey techniques, <strong>GPS</strong>-based methodologies require m<strong>in</strong>imal time dem<strong>and</strong>s on the<br />
visitor <strong>and</strong> less tra<strong>in</strong><strong>in</strong>g <strong>of</strong> staff for data collection (Hallo et al., 2005).<br />
<strong>GPS</strong>-based approaches can also provide data that has been heret<strong>of</strong>ore difficult to<br />
collect. First, <strong>in</strong> many protected area situations, visitors depart<strong>in</strong>g from designated trails<br />
<strong>and</strong> sites are <strong>of</strong> <strong>in</strong>creas<strong>in</strong>g management concern. Short <strong>of</strong> observational studies, no<br />
techniques are readily available to determ<strong>in</strong>e the spatial extent <strong>and</strong> duration <strong>of</strong> <strong>of</strong>f-trail<br />
use. <strong>GPS</strong>-based measurements provide results with enough detail to exam<strong>in</strong>e relatively<br />
small-scale visitor movements both on <strong>and</strong> <strong>of</strong>f-trail. Second, precise <strong>in</strong>formation about<br />
visitor use levels <strong>and</strong> patterns is helpful <strong>in</strong> develop<strong>in</strong>g <strong>and</strong> validat<strong>in</strong>g computer models that<br />
are becom<strong>in</strong>g a more common tool to identify visitor flows <strong>in</strong> parks <strong>and</strong> protected areas<br />
(e.g., Lawson, 2006). These data have traditionally been measured via survey methods,<br />
which have limited spatial <strong>and</strong> temporal precision due to recall bias <strong>and</strong> limits to visitors’<br />
knowledge <strong>of</strong> areas studied. <strong>GPS</strong> approaches can be used to collect model<strong>in</strong>g <strong>in</strong>puts <strong>and</strong><br />
have the potential to be more reliable <strong>and</strong> accurate data sources.<br />
This study reports on the development <strong>of</strong> <strong>GPS</strong>-based measurements <strong>of</strong> visitor<br />
use patterns through the exam<strong>in</strong>ation <strong>of</strong> three case studies that utilized <strong>GPS</strong> track<strong>in</strong>g<br />
methodologies; a visitor track<strong>in</strong>g study <strong>in</strong> Yosemite National Park, a day-use visitor<br />
track<strong>in</strong>g study <strong>in</strong> the Bear Lake Corridor <strong>of</strong> Rocky Mounta<strong>in</strong> National Park, <strong>and</strong> a w<strong>in</strong>ter<br />
recreation study <strong>in</strong> the Teton Range <strong>of</strong> Wyom<strong>in</strong>g. In the course <strong>of</strong> these <strong>in</strong>vestigations, we<br />
conducted extensive track<strong>in</strong>g <strong>of</strong> visitors via r<strong>and</strong>om sampl<strong>in</strong>g at trailheads <strong>in</strong> each study<br />
area <strong>and</strong> developed accuracy-check<strong>in</strong>g procedures to m<strong>in</strong>imize positional errors associated<br />
with the current, available <strong>GPS</strong> technology. Our goal <strong>in</strong> this paper is to illustrate the utility<br />
<strong>of</strong> <strong>GPS</strong> track<strong>in</strong>g as a means <strong>of</strong> ga<strong>in</strong><strong>in</strong>g further underst<strong>and</strong><strong>in</strong>g <strong>of</strong> several important protected<br />
area management issues.<br />
Method<br />
Study Areas<br />
Yosemite National Park. Yosemite National Park (YNP) is located <strong>in</strong> the Sierra<br />
Nevada range <strong>of</strong> California approximately 240 km east <strong>of</strong> the San Francisco Bay area. As<br />
one <strong>of</strong> the most visited parks <strong>in</strong> the United States, YNP receives over 3.5 million visitors<br />
annually (National Park Service, 2009). While the majority <strong>of</strong> park use is concentrated <strong>in</strong><br />
Yosemite Valley, the Tuolumne Meadows area <strong>of</strong> the park <strong>of</strong>fers visitors opportunities for<br />
day hik<strong>in</strong>g, backpack<strong>in</strong>g, rock climb<strong>in</strong>g, <strong>and</strong> fish<strong>in</strong>g <strong>in</strong> an alp<strong>in</strong>e environment. Trailheads<br />
<strong>in</strong> the Tuolumne Meadows area <strong>of</strong> the park provide access to vast areas <strong>of</strong> congressionally<br />
designated Wilderness <strong>and</strong> are accessed via Tioga Road, which is a National Scenic Byway.<br />
The National Park Service is conduct<strong>in</strong>g transportation <strong>and</strong> visitor use plann<strong>in</strong>g<br />
activities throughout the park, <strong>in</strong>clud<strong>in</strong>g collect<strong>in</strong>g <strong>in</strong>formation to underst<strong>and</strong> relationships<br />
among vehicle traffic volumes, visitor use levels <strong>in</strong> locations throughout the park, the<br />
45
46<br />
quality <strong>of</strong> visitors’ experiences, <strong>and</strong> park resource conditions. To support park plann<strong>in</strong>g,<br />
<strong>GPS</strong>-based track<strong>in</strong>g data were collected dur<strong>in</strong>g summer 2009 to measure visitor use<br />
patterns <strong>in</strong> Tuolumne. Specifically, research technicians were stationed at five trailheads<br />
along Tioga Road <strong>and</strong> recruited visitor groups to participate <strong>in</strong> the study (see Figure 1).<br />
In addition, <strong>in</strong>frared trail counters were <strong>in</strong>stalled at each <strong>of</strong> the five trailhead locations to<br />
measure daily trailhead visitation.<br />
Rocky Mounta<strong>in</strong> National Park. Rocky Mounta<strong>in</strong> National Park (RMNP) is located<br />
<strong>in</strong> north central Colorado, approximately 160 km from the Denver metropolitan area.<br />
RMNP receives over 3 million visitors per year (National Park Service, 2009). One <strong>of</strong> the<br />
most popular dest<strong>in</strong>ations with<strong>in</strong> RMNP is the Bear Lake Road Corridor, which provides<br />
access to many alp<strong>in</strong>e lakes <strong>and</strong> is a popular dest<strong>in</strong>ation for day users, backpackers, <strong>and</strong><br />
boulderers. In 1998, due to the high level <strong>of</strong> use <strong>in</strong> the Bear Lake Road Corridor, RMNP<br />
created a shuttle bus system to service the area (Gamble, Lawson, Monz, & Newman, 2007).<br />
Ridership on the shuttle bus to the Bear Lake Road Corridor has <strong>in</strong>creased substantially<br />
s<strong>in</strong>ce its <strong>in</strong>stallment, result<strong>in</strong>g <strong>in</strong> apparent <strong>in</strong>creased visitation to hik<strong>in</strong>g dest<strong>in</strong>ations <strong>in</strong> this<br />
corridor.<br />
<strong>GPS</strong>-based track<strong>in</strong>g methodologies were performed at three trailheads served by the<br />
shuttle bus <strong>in</strong> the Bear Lake Road Corridor; Bear Lake, Glacier Gorge, <strong>and</strong> Bierstadt Lake.<br />
Participants <strong>in</strong> the study were asked to complete an optional survey at the end <strong>of</strong> their hike<br />
that gathered <strong>in</strong>formation on crowd<strong>in</strong>g <strong>and</strong> visitor behavior <strong>in</strong> response to crowd<strong>in</strong>g.<br />
The Teton Range. Gr<strong>and</strong> Teton National Park (GTNP) receives 2.5 million visitors<br />
annually <strong>and</strong> is located <strong>in</strong> Northwestern Wyom<strong>in</strong>g bordered by Yellowstone National Park<br />
<strong>and</strong> two National Forest Service units. To the east <strong>and</strong> south <strong>of</strong> GTNP is the Bridger-Teton<br />
National Forest (BTNF) <strong>and</strong> to the west <strong>of</strong> GTNP is the Caribou-Targhee National Forest<br />
(CTNF).<br />
The Teton Range supports the smallest native bighorn sheep population <strong>in</strong> Wyom<strong>in</strong>g.<br />
Due to anthropogenic disturbance at lower elevations, the Teton Range bighorn sheep<br />
(Ovis canadensis) herd resides year-round at high elevation <strong>in</strong> the Teton Range (Kauffman<br />
& Courtemanch, 2009). Although nearly all <strong>of</strong> the bighorn sheep w<strong>in</strong>ter range falls<br />
with<strong>in</strong> designated Wilderness, where motorized recreation is prohibited, non-motorized<br />
recreation such as backcountry ski<strong>in</strong>g is popular. Participation <strong>in</strong> backcountry ski<strong>in</strong>g is<br />
rapidly <strong>in</strong>creas<strong>in</strong>g <strong>in</strong> the Teton Range <strong>and</strong> has the potential to <strong>in</strong>fluence bighorn sheep<br />
w<strong>in</strong>ter habitat use patterns (Kauffman & Courtemanch, 2009).<br />
Trail counter <strong>and</strong> <strong>GPS</strong>-based track<strong>in</strong>g data were collected at seven popular<br />
backcountry access po<strong>in</strong>ts <strong>in</strong> the Teton Range from January to April <strong>of</strong> the 2009 w<strong>in</strong>ter<br />
recreation season. These access po<strong>in</strong>ts <strong>in</strong>cluded three backcountry gates at Jackson Hole<br />
Mounta<strong>in</strong> Resort (where skiers enter BTNF <strong>and</strong> GNTP), Death Canyon trailhead <strong>in</strong> GTNP,<br />
Bradley-Taggart Lake trailhead <strong>in</strong> GTNP, <strong>and</strong> Teton Canyon <strong>and</strong> Gr<strong>and</strong> Targhee access<br />
po<strong>in</strong>ts to backcountry ski<strong>in</strong>g <strong>in</strong> CTNF. For the purpose <strong>of</strong> this paper, we will focus on the<br />
visitor track<strong>in</strong>g data collected at the Death Canyon <strong>and</strong> Bradley-Taggart Lake trailheads<br />
<strong>in</strong> GTNP (see Figure 2).<br />
<strong>GPS</strong>-<strong>Based</strong> Data Collection <strong>and</strong> Data Analysis<br />
In all three case studies, <strong>GPS</strong> data on visitor routes were recorded us<strong>in</strong>g recreation-<br />
grade Garm<strong>in</strong> <strong>GPS</strong> 60 units (Table 1). <strong>GPS</strong> 60 models have 28 hours <strong>of</strong> battery life,<br />
storage <strong>of</strong> 1MB, <strong>and</strong> are Wide Area Augmentation System (WAAS) enabled allow<strong>in</strong>g<br />
for signal corrections <strong>and</strong> improved real-time accuracy. Each Garm<strong>in</strong> <strong>GPS</strong> 60 model<br />
costs approximately $190, can store track logs up to 10,000 po<strong>in</strong>ts, <strong>and</strong> is cited by the<br />
manufacture as hav<strong>in</strong>g a positional accuracy <strong>of</strong> with<strong>in</strong> 15 meters 95% <strong>of</strong> the time (Garm<strong>in</strong><br />
Ltd., 2010). <strong>Visitors</strong> were r<strong>and</strong>omly <strong>in</strong>tercepted at each trailhead accord<strong>in</strong>g to a sampl<strong>in</strong>g
Table 1. <strong>GPS</strong> sampl<strong>in</strong>g characteristics by study site.<br />
Study Data Number Response Number <strong>GPS</strong><br />
Site Collection <strong>of</strong> <strong>GPS</strong> Rate <strong>of</strong> Visitor Positional<br />
Dates Units Tracks Error<br />
Used Collected Estimate (m)<br />
Yosemite July 2009 30 82% 199 N/A<br />
(10 days)<br />
Rocky Mounta<strong>in</strong> July - August 2008 20 80% 301 6.40<br />
(13 days)<br />
Gr<strong>and</strong> Teton January - April 2009 10 90% 108 3.67<br />
(27 days)<br />
protocol <strong>of</strong> r<strong>and</strong>om days stratified by time <strong>of</strong> day <strong>and</strong> weekend <strong>and</strong> weekdays. All visitors<br />
were asked to voluntarily participate <strong>and</strong> only day use visitors were sampled. One <strong>GPS</strong> unit<br />
was given to a volunteer <strong>in</strong> each group <strong>and</strong> the visitor was asked to carry the unit clipped<br />
on to the outside <strong>of</strong> their pack for the duration <strong>of</strong> their hike or ski. The <strong>GPS</strong> unit recorded<br />
location po<strong>in</strong>ts at 15-second <strong>in</strong>tervals <strong>in</strong> YNP <strong>and</strong> RMNP or 5-second <strong>in</strong>tervals <strong>in</strong> GTNP.<br />
A shorter time <strong>in</strong>terval was used <strong>in</strong> GTNP to account for skiers’ greater speed <strong>of</strong> travel<br />
as compared to the hikers tracked <strong>in</strong> YNP <strong>and</strong> RMNP. The units were returned at the end<br />
<strong>of</strong> the visitor’s trip to technicians positioned at all possible exit trailheads. In the case <strong>of</strong><br />
trailheads <strong>in</strong> the GTNP, the <strong>GPS</strong> units could also be returned to a labeled drop box found<br />
at all possible exit trailheads.<br />
No units were broken, lost, or stolen <strong>in</strong> YNP or RMNP for a return rate <strong>of</strong> 100%. In<br />
GTNP two <strong>of</strong> the 10 units were lost out <strong>of</strong> a total <strong>of</strong> 108 samples. Each study site varied<br />
<strong>in</strong> topography <strong>and</strong> vegetation cover, which can affect signal reception. However, overall<br />
the unique environmental conditions at each study site did not <strong>in</strong>terfere significantly with<br />
data collection. In YNP, <strong>GPS</strong> track<strong>in</strong>g occurred mostly <strong>in</strong> high-elevation meadows with<br />
little canopy cover. The conditions <strong>in</strong> YNP resulted <strong>in</strong> very few miss<strong>in</strong>g or corrupt tracks;<br />
199 usable tracks out <strong>of</strong> 212 total tracks collected. In RMNP, the Bear Lake Road Corridor<br />
is located <strong>in</strong> a subalp<strong>in</strong>e ecosystem with dense to sparse tree cover <strong>and</strong> large cirque walls<br />
at some <strong>of</strong> the subalp<strong>in</strong>e lakes. Due to the areas <strong>of</strong> dense tree cover <strong>and</strong> mounta<strong>in</strong>ous<br />
environment, 301 usable tracks were collected out <strong>of</strong> 350 total tracks <strong>in</strong> RMNP. In GTNP,<br />
the backcountry ski routes range <strong>in</strong> elevation from approximately 2,000 meters to 3,500<br />
meters. The majority <strong>of</strong> backcountry ski<strong>in</strong>g occurs on the east slope <strong>of</strong> the Teton Range,<br />
which is characterized by steep, open slopes <strong>and</strong> deep canyons. At low elevations, there<br />
is significant conifer cover <strong>in</strong> many areas, but the cover did not affect <strong>GPS</strong> unit satellite<br />
reception. Occasionally, <strong>GPS</strong> units missed locations while visitors were travell<strong>in</strong>g <strong>in</strong> very<br />
deep, narrow canyons. In GTNP, most problems that occurred with <strong>GPS</strong> reception was<br />
usually due to visitors mov<strong>in</strong>g <strong>GPS</strong> units to <strong>in</strong>side their backpacks dur<strong>in</strong>g their trip or<br />
problems with low batteries due to colder conditions.<br />
To account for any possible site-specific, positional error associated with recreation<br />
grade <strong>GPS</strong> measures, calibration techniques were employed <strong>in</strong> RMNP <strong>and</strong> the Teton Range.<br />
Calibration also allowed for a verification <strong>of</strong> the accuracies calculated <strong>and</strong> displayed by the<br />
Garm<strong>in</strong> <strong>GPS</strong> 60, as no <strong>in</strong>formation on this process is available from the manufacturer due<br />
to the proprietary nature <strong>of</strong> the s<strong>of</strong>tware. In RMNP, a sub-meter Trimble GeoXT <strong>GPS</strong> unit<br />
47
48<br />
was used to map a calibration track along the center <strong>of</strong> the designated trail at each sampled<br />
trailhead. Before each sampl<strong>in</strong>g day began, a r<strong>and</strong>omly selected Garm<strong>in</strong> <strong>GPS</strong> 60 unit was<br />
used to record the same calibration track. Upon completion <strong>of</strong> data collection, all <strong>of</strong> the<br />
calibration tracks from Garm<strong>in</strong> <strong>GPS</strong> 60 units were compared to the high accuracy tracks<br />
assessed by the Trimble <strong>in</strong> ArcGIS s<strong>of</strong>tware. A Euclidian distance measure (a straight l<strong>in</strong>e<br />
distance measure between two po<strong>in</strong>ts) was used to determ<strong>in</strong>e the average positional error<br />
for each Garm<strong>in</strong> 60 <strong>GPS</strong> track. These error measures were then averaged to determ<strong>in</strong>e the<br />
overall positional error estimate for the Garm<strong>in</strong> <strong>GPS</strong> 60 dur<strong>in</strong>g the sampl<strong>in</strong>g period (Table<br />
1).<br />
In the Teton Range, due to logistical differences from RMNP, a slightly different<br />
calibration technique was used. At each trailhead sampled, a high accuracy po<strong>in</strong>t was<br />
recorded us<strong>in</strong>g a Trimble GeoXT <strong>GPS</strong> unit. At the start <strong>of</strong> each sampl<strong>in</strong>g day, a Garm<strong>in</strong><br />
60 <strong>GPS</strong> unit was r<strong>and</strong>omly selected <strong>and</strong> 75 po<strong>in</strong>ts were recorded at the same location at<br />
which the calibration po<strong>in</strong>t was recorded. A Euclidean distance was then calculated from<br />
each po<strong>in</strong>t recorded by the Garm<strong>in</strong> 60 <strong>GPS</strong> units to the calibration po<strong>in</strong>t; these values were<br />
averaged to determ<strong>in</strong>e the overall positional error (Table 1). No calibration methodologies<br />
were performed <strong>in</strong> YNP due to our previous experience with the method <strong>and</strong> because the<br />
project goal was to exam<strong>in</strong>e visitor travel routes rather than small spatial scale visitor use<br />
issues.<br />
The dataset result<strong>in</strong>g from <strong>GPS</strong>-based track<strong>in</strong>g methodologies is a series <strong>of</strong> po<strong>in</strong>t<br />
data that can then be exam<strong>in</strong>ed <strong>in</strong> a geographic <strong>in</strong>formation system (GIS). When exam<strong>in</strong>ed<br />
spatially, these data <strong>in</strong>herently comb<strong>in</strong>e visitor use levels <strong>and</strong> certa<strong>in</strong> behavioral aspects,<br />
such as visitors paus<strong>in</strong>g or congregat<strong>in</strong>g <strong>in</strong> one location. The data also <strong>in</strong>cludes additional<br />
attributes such as time, speed, <strong>and</strong> elevation. Analysis <strong>of</strong> the po<strong>in</strong>t data yields <strong>in</strong>formation<br />
on visitor densities <strong>and</strong> temporal <strong>and</strong> spatial patterns. When comb<strong>in</strong>ed with visitor surveys<br />
<strong>and</strong> total use estimation techniques, these data provide an important <strong>and</strong> highly accurate<br />
picture <strong>of</strong> visitor use <strong>and</strong> behavior.<br />
Visitor Use Estimation Data Collection <strong>and</strong> Data Analysis<br />
<strong>GPS</strong>-based measures can be used to supplement traditional visitor use estimation<br />
techniques. As such, total visitor use was estimated at selected attraction sites <strong>and</strong> trailheads<br />
<strong>in</strong> YNP <strong>and</strong> RMNP us<strong>in</strong>g active <strong>in</strong>frared automated monitors. These devices are commonly<br />
used by researchers <strong>and</strong> park managers to monitor recreation use levels <strong>in</strong> protected natural<br />
areas because they are relatively easy to <strong>in</strong>stall <strong>and</strong> operate. (Bates, Wallace, & Vaske,<br />
2007; Gracia-Longares, 2005; Pettebone, Newman, Beaton, Stack, & Gibson, 2008; Vaske<br />
& Donnelly, 2007).<br />
Similar approaches were used <strong>in</strong> both parks. For example, <strong>in</strong> RMNP, TrailMaster1550<br />
active <strong>in</strong>frared monitors were deployed at seven locations <strong>in</strong> the Bear Lake area to estimate<br />
visitor use at attraction sites <strong>and</strong> trailheads. At each study site, 10 hours <strong>of</strong> direct observation<br />
data were collected to calibrate results specific to each device. <strong>Based</strong> on the calibrations<br />
for each device, seasonal, daily, <strong>and</strong> hourly visitor use was estimated for each study site.<br />
Estimates <strong>of</strong> visitor use were comb<strong>in</strong>ed with data collected via <strong>GPS</strong> to determ<strong>in</strong>e spatially<br />
detailed total seasonal use along the Bear Lake trail system (Pettebone, 2009).<br />
Results <strong>and</strong> Discussion<br />
Spatial Aspects <strong>of</strong> Visitor Use<br />
The <strong>GPS</strong> techniques employed <strong>in</strong> the three studies allow for the exam<strong>in</strong>ation <strong>of</strong> spatial<br />
patterns <strong>of</strong> visitor use at a much more detailed level than is possible through observational<br />
or survey techniques. At the relatively large spatial scale <strong>of</strong> a park or management unit,
<strong>GPS</strong>-based track<strong>in</strong>g data can be mapped to show the extent <strong>of</strong> use with<strong>in</strong> the system<br />
(Figures 1 <strong>and</strong> 2). For example, <strong>in</strong> YNP, visitors were tracked with<strong>in</strong> the Tuolumne<br />
Meadows trail system <strong>and</strong> mapp<strong>in</strong>g <strong>of</strong> these data <strong>in</strong>dicate the spatial extent <strong>of</strong> day use<br />
hikers orig<strong>in</strong>at<strong>in</strong>g from the Tuolumne visitor center trailheads (Figure 1). This <strong>in</strong>formation<br />
is relevant to managers <strong>in</strong> provid<strong>in</strong>g a thorough underst<strong>and</strong><strong>in</strong>g <strong>of</strong> the nature <strong>of</strong> hik<strong>in</strong>g<br />
use <strong>in</strong> this trail system. The detail provided by <strong>GPS</strong>-based techniques, even at a large<br />
spatial scale, is greater than that which could be provided by traditional techniques, which<br />
typically provide only total use on trail segments where they are located.<br />
Information on the overall spatial extent <strong>of</strong> visitation is also particularly valuable<br />
<strong>in</strong> situations where the visitor use patterns are not as predictable—where most <strong>of</strong> the<br />
visitation is occurr<strong>in</strong>g <strong>of</strong>f <strong>of</strong> a designated trail system. This is illustrated <strong>in</strong> the analysis <strong>of</strong><br />
data collected <strong>in</strong> the GTNP study <strong>of</strong> backcountry skiers (Figure 2). Data <strong>of</strong> this k<strong>in</strong>d are<br />
useful <strong>in</strong> identify<strong>in</strong>g locations, densities, <strong>and</strong> temporal patterns <strong>of</strong> <strong>of</strong>f-trail use <strong>and</strong>, <strong>in</strong> this<br />
case, are able to be directly compared with <strong>GPS</strong>-collared wildlife locations <strong>and</strong> habitat use<br />
patterns. <strong>GPS</strong> track<strong>in</strong>g data can be easily <strong>in</strong>corporated <strong>in</strong>to statistical models as a predictor<br />
variable <strong>of</strong> wildlife distribution.<br />
The spatial components <strong>of</strong> the backcountry skier tracks (distance <strong>of</strong> backcountry travel<br />
routes, <strong>of</strong> vary<strong>in</strong>g densities, to <strong>GPS</strong>-collared bighorn sheep locations) can be <strong>in</strong>cluded,<br />
along with several additional predictor variables, <strong>in</strong>to a resource selection function (RSF)<br />
model<strong>in</strong>g procedure for w<strong>in</strong>ter habitat use (Sawyer et al., 2006). In GTNP, visitor use<br />
data was collected concurrently with <strong>GPS</strong>-collared bighorn sheep data. In future work,<br />
the detailed location data from both bighorn sheep <strong>and</strong> backcountry visitors will allow<br />
for the determ<strong>in</strong>ation <strong>of</strong> how various spatial <strong>and</strong> temporal patterns <strong>of</strong> backcountry ski<strong>in</strong>g<br />
affect bighorn sheep w<strong>in</strong>ter habitat use. W<strong>in</strong>ter backcountry recreation will be <strong>in</strong>cluded as<br />
a predictor variable <strong>in</strong> the RSF (as distance to backcountry use areas <strong>of</strong> vary<strong>in</strong>g densities<br />
<strong>of</strong> use) to determ<strong>in</strong>e if bighorn sheep avoid backcountry recreation routes, even if these<br />
areas have been identified by the RSF as suitable w<strong>in</strong>ter habitat. Specifically, the RSF<br />
can determ<strong>in</strong>e if a threshold <strong>of</strong> visitor use at which bighorn sheep ab<strong>and</strong>on suitable w<strong>in</strong>ter<br />
habitat areas exists. These model<strong>in</strong>g procedures are especially useful to wildlife managers<br />
to identify areas <strong>of</strong> potential <strong>in</strong>teraction between recreationists <strong>and</strong> wildlife.<br />
The detail associated with <strong>GPS</strong> track<strong>in</strong>g data, where positional errors can be estimated,<br />
also allows for analysis at smaller spatial scales such as dest<strong>in</strong>ation po<strong>in</strong>ts. In these cases,<br />
exam<strong>in</strong>ation <strong>of</strong> particular aspects <strong>of</strong> visitor behavior, <strong>in</strong>clud<strong>in</strong>g wait<strong>in</strong>g times at the<br />
dest<strong>in</strong>ation po<strong>in</strong>t <strong>and</strong> exam<strong>in</strong>ation <strong>of</strong> <strong>of</strong>f-trail use may be particularly relevant to manag<strong>in</strong>g<br />
for visitor experience <strong>and</strong> resource protection. In the case <strong>of</strong> RMNP, the error calculated<br />
from the calibration procedures was used to create a 12.8m buffer around designated trails.<br />
All visitor po<strong>in</strong>ts with<strong>in</strong> the buffer were considered to be “on trail.” Specific po<strong>in</strong>ts <strong>of</strong><br />
<strong>in</strong>terest can then be exam<strong>in</strong>ed more closely to explore the details <strong>of</strong> visitor use <strong>in</strong> these<br />
dispersed-use sett<strong>in</strong>gs. For example, <strong>in</strong> RMNP, <strong>of</strong>f-trail use was exam<strong>in</strong>ed at Alberta Falls<br />
(Figure 3). Off-trail use can be given further context when comb<strong>in</strong>ed with <strong>GPS</strong>-recorded<br />
visitor impacts such as visitor created trails <strong>and</strong> sites. The comb<strong>in</strong>ation <strong>of</strong> visitor-impact<br />
data <strong>and</strong> <strong>GPS</strong> track<strong>in</strong>g data can highlight how visitors are access<strong>in</strong>g <strong>of</strong>f trail areas <strong>and</strong> how<br />
visitors are us<strong>in</strong>g areas that have already experienced resource change.<br />
Underst<strong>and</strong><strong>in</strong>g the typical spatial patterns <strong>of</strong> visitor use can <strong>in</strong>form decisions related<br />
to designated trail management. Also, by underst<strong>and</strong><strong>in</strong>g spatial patterns <strong>of</strong> <strong>of</strong>f-trail use,<br />
managers can evaluate the effectiveness <strong>of</strong> current management techniques to discourage<br />
<strong>of</strong>f-trail use. The level <strong>of</strong> accuracy <strong>and</strong> detail provided by <strong>GPS</strong>-based measures, at both<br />
the large <strong>and</strong> small spatial scale, allows managers to identify <strong>and</strong> focus on areas <strong>of</strong> most<br />
concern for resource change <strong>and</strong> dim<strong>in</strong>ished visitor experience. Traditional techniques,<br />
such as observational studies <strong>and</strong> survey methodologies may not provide the same level <strong>of</strong><br />
detail or accuracy, especially <strong>in</strong> situations <strong>of</strong> dispersed visitor use.<br />
49
50<br />
Figure 1. Extent <strong>of</strong> hik<strong>in</strong>g use orig<strong>in</strong>at<strong>in</strong>g from trailheads <strong>in</strong> Tuolumne Meadows trail<br />
system <strong>in</strong> YNP. Stars mark trailheads where sampl<strong>in</strong>g occurred.
Figure 2. Extent <strong>of</strong> backcountry ski use from trailheads <strong>in</strong> GTNP. Stars make trailheads<br />
where sampl<strong>in</strong>g occurred.<br />
51
52<br />
Figure 3. <strong>GPS</strong> track<strong>in</strong>g <strong>of</strong> <strong>of</strong>f-trail travel by visitors at Alberta Falls <strong>in</strong> RMNP.<br />
Density Analysis<br />
Visitor po<strong>in</strong>t data can be used to calculate a density <strong>of</strong> visitor track<strong>in</strong>g po<strong>in</strong>ts. High<br />
visitor densities can be caused by overall high levels <strong>of</strong> use or by a few visitors stay<strong>in</strong>g <strong>in</strong><br />
an area for an extended period <strong>of</strong> time. Visitor use density can be exam<strong>in</strong>ed at a systemwide<br />
level to highlight areas <strong>of</strong> high use that can then be analyzed at a more detailed<br />
level (Figure 4). Once sites for further <strong>in</strong>vestigation are identified, a density analysis can<br />
be completed for popular hik<strong>in</strong>g dest<strong>in</strong>ations such as Dog Lake <strong>in</strong> YNP (Figure 5). A<br />
density analysis <strong>of</strong> the visitors tracked to Dog Lake show that the highest densities <strong>of</strong><br />
po<strong>in</strong>ts are found where the designated trail first connects to the lake <strong>and</strong> at various spots<br />
along the edge <strong>of</strong> Dog Lake. The density analysis also shows that there is concentrated<br />
use at an area <strong>of</strong>f <strong>of</strong> the designated trail on the northwest shore <strong>of</strong> Dog Lake. Managers<br />
can use density analyses to highlight areas that may be at risk for changes to resource<br />
conditions or dim<strong>in</strong>ished visitor experience from crowd<strong>in</strong>g or conflict. Further analysis<br />
can be performed us<strong>in</strong>g the same <strong>GPS</strong>-based track<strong>in</strong>g data to exam<strong>in</strong>e temporal <strong>and</strong> spatial<br />
patterns at these areas to better underst<strong>and</strong> visitor behavior at these popular dest<strong>in</strong>ations.<br />
Temporal Aspects <strong>of</strong> Visitor Use<br />
<strong>GPS</strong> units record visitor location at a selected time <strong>in</strong>terval. As such, the track<strong>in</strong>g<br />
data can be analyzed to better underst<strong>and</strong> the temporal patterns <strong>of</strong> visitor use <strong>in</strong> an area. At<br />
the large scale, characteristics for an entire visit can be determ<strong>in</strong>ed. For example, visitortrack<strong>in</strong>g<br />
data were used to determ<strong>in</strong>e the average time visitors spent <strong>in</strong> each study area<br />
(Table 2). <strong>Visitors</strong> spent the most time <strong>in</strong> the GTNP system, averag<strong>in</strong>g 6 hours <strong>and</strong> 28<br />
m<strong>in</strong>utes. In YNP, the visitors tracked spent an average <strong>of</strong> 5 hours <strong>and</strong> 20 m<strong>in</strong>utes <strong>in</strong> the<br />
Tuolumne Meadows trail system. While <strong>in</strong> RMNP, visitors spent an average <strong>of</strong> 2 hours <strong>and</strong><br />
30 m<strong>in</strong>utes <strong>in</strong> the Bear Lake Road Corridor trail system. An exam<strong>in</strong>ation <strong>of</strong> the temporal
Figure 4. Density analysis <strong>of</strong> visitor use po<strong>in</strong>ts <strong>in</strong> the Tuolumne Meadows trail system<br />
<strong>in</strong> YNP.<br />
Table 2. Analysis <strong>of</strong> temporal patterns <strong>of</strong> visitor use.<br />
Location Average Total Time Max Time M<strong>in</strong> Time St<strong>and</strong>ard<br />
<strong>in</strong> Area <strong>in</strong> Area <strong>in</strong> Area Deviation<br />
(h:mm) (h:mm) (h:mm)<br />
Tuolumne Meadows<br />
(Yosemite) 5:20 11:08 0:29 2.33<br />
Bear Lake<br />
(Rocky Mounta<strong>in</strong>) 2:30 8:00 0:04 0.07<br />
Gr<strong>and</strong> Teton 6:28 13:52 0:32 2.51<br />
53
54<br />
Figure 5. Density analysis <strong>of</strong> visitor use po<strong>in</strong>ts at Dog Lake <strong>in</strong> Tuolumne Meadows, YNP.<br />
component <strong>of</strong> visitor use at a large scale can <strong>in</strong>form managers about length <strong>of</strong> stay <strong>in</strong> an<br />
area or on a trail system.<br />
Large-scale temporal data can also be <strong>in</strong>tegrated with other studies. For example,<br />
the temporal aspects <strong>of</strong> visitor hikes collected <strong>in</strong> RMNP were used <strong>in</strong> comb<strong>in</strong>ation<br />
with a transportation noise model <strong>of</strong> the park to underst<strong>and</strong> visitors’ experiences <strong>of</strong> the<br />
park’s soundscape. Specifically, the <strong>GPS</strong> visitor data <strong>and</strong> maps <strong>of</strong> transportation-related<br />
noise levels were analyzed spatially. GIS spatial statistics were applied to these data to<br />
estimate the amount <strong>of</strong> time <strong>and</strong> distance visitors must hike from trailheads away from the<br />
transportation corridor to experience natural sounds. Estimates were also generated for the<br />
proportion <strong>of</strong> visitors who experience at least 15 m<strong>in</strong>utes <strong>of</strong> natural sounds <strong>and</strong> quiet. At<br />
the time <strong>of</strong> the study, the National Park Service had not def<strong>in</strong>ed a threshold for road noise,<br />
beyond which natural sounds <strong>and</strong> quiet are compromised. Thus, a range <strong>of</strong> example road<br />
noise thresholds were evaluated to estimate the proportion <strong>of</strong> visitors who experience at<br />
least 15 m<strong>in</strong>utes <strong>of</strong> natural sounds <strong>and</strong> quiet. The example road noise thresholds used <strong>in</strong> the<br />
analysis <strong>in</strong>clude ≤25 dBA (nighttime ambient natural sound level measured <strong>in</strong> the study),<br />
≤30 dBA <strong>and</strong> ≤35 dBA (daytime ambient natural sound levels), <strong>and</strong> ≤65 dBA (the level at<br />
which noise <strong>in</strong>terferes with conversational tones).<br />
Temporal patterns <strong>of</strong> use can also be exam<strong>in</strong>ed at a small scale such as at specific<br />
sites <strong>of</strong> <strong>in</strong>terest. In RMNP, visitors frequently travel <strong>of</strong>f-trail <strong>in</strong> an area <strong>of</strong> dispersed<br />
use adjacent to Alberta Falls (Figure 2). By us<strong>in</strong>g the positional error calculated from<br />
calibration techniques to elim<strong>in</strong>ate all on trail use from the analysis <strong>and</strong> us<strong>in</strong>g the temporal
data collected from the <strong>GPS</strong> units, it was determ<strong>in</strong>ed that 46% <strong>of</strong> visitors that were tracked<br />
travel<strong>in</strong>g along the Glacier Gorge trail left the designated trail adjacent to Alberta Falls <strong>and</strong><br />
spent, on average, 17 m<strong>in</strong>utes <strong>of</strong>f trail. Visitor use can also be analyzed by the distance<br />
traveled from the designated trail, for example at Alberta Falls, the area <strong>of</strong> dispersed<br />
use was split <strong>in</strong>to two <strong>of</strong>f-trail zones; one near the designated trail <strong>and</strong> one far from the<br />
designated trail. The data result<strong>in</strong>g from this analysis can then be <strong>in</strong>corporated <strong>in</strong> model<strong>in</strong>g<br />
efforts to exam<strong>in</strong>e dispersed use with<strong>in</strong> <strong>of</strong>f trail areas.<br />
Integration with Visitor Use Estimation <strong>and</strong> Survey Techniques<br />
Estimates <strong>of</strong> use level are important for managers <strong>in</strong> terms <strong>of</strong> <strong>in</strong>form<strong>in</strong>g issues such<br />
as the potential for resource change <strong>and</strong> experiential impacts such as crowd<strong>in</strong>g. Automatic<br />
counter data can be comb<strong>in</strong>ed with <strong>GPS</strong>-based measurements to ga<strong>in</strong> a better underst<strong>and</strong><strong>in</strong>g<br />
<strong>of</strong> visitor use for popular dest<strong>in</strong>ations. For example, <strong>in</strong> RMNP, automatic visitor counters<br />
were placed on the trailheads that were sampled us<strong>in</strong>g <strong>GPS</strong>-based methodologies. An<br />
automatic visitor counter was placed at the Bear Lake trailhead, which provides access<br />
to the Emerald Lake trail <strong>and</strong> three alp<strong>in</strong>e lakes. From the <strong>GPS</strong>-based measures recorded<br />
<strong>and</strong> the visitor counters, it can be determ<strong>in</strong>ed that 28% <strong>of</strong> visitors traveled to a dest<strong>in</strong>ation<br />
along the Emerald Lake trail. The average seasonal use for the Bear Lake trailhead, as<br />
determ<strong>in</strong>ed by the automated visitor counters can then be comb<strong>in</strong>ed with the <strong>GPS</strong>-based<br />
results <strong>of</strong> travel to dest<strong>in</strong>ations along the Emerald Lake trail to estimate overall seasonal<br />
use patterns along the designated trail.<br />
Strategic placement <strong>of</strong> automatic visitor counters can also be comb<strong>in</strong>ed with <strong>GPS</strong>based<br />
measures to determ<strong>in</strong>e use levels at specific areas <strong>of</strong> visitor <strong>in</strong>terest or <strong>of</strong>f-trail<br />
dest<strong>in</strong>ations. <strong>GPS</strong>-based measurements provide an additional layer <strong>of</strong> detail to traditional<br />
visitor use-estimation techniques, which can only provide an estimate <strong>of</strong> use level at the<br />
specific location <strong>of</strong> the counter mechanism. <strong>GPS</strong>-track<strong>in</strong>g methodologies can provide<br />
<strong>in</strong>formation regard<strong>in</strong>g exactly where visitors are go<strong>in</strong>g <strong>and</strong> the routes that visitors are us<strong>in</strong>g<br />
to get to their dest<strong>in</strong>ations.<br />
<strong>GPS</strong>-based track<strong>in</strong>g data can effectively provide spatial <strong>and</strong> temporal data <strong>and</strong> be used<br />
to complement automated visitor counters <strong>in</strong> use estimation, but the result<strong>in</strong>g dataset does<br />
not conta<strong>in</strong> any <strong>in</strong>formation about visitor characteristics. However, the visitor-track<strong>in</strong>g<br />
methodologies discussed here can be comb<strong>in</strong>ed with traditional survey techniques. In<br />
RMNP, visitors who participated <strong>in</strong> the <strong>GPS</strong>-based visitor track<strong>in</strong>g study were asked to<br />
complete a short survey follow<strong>in</strong>g their hike. The surveys were coded so that <strong>in</strong>dividual<br />
<strong>GPS</strong> tracks could be l<strong>in</strong>ked to the visitor’s survey (Table 3). For example, Euclidean<br />
distance calculations were computed for <strong>in</strong>dividual visitors <strong>and</strong> the average distance that<br />
each <strong>in</strong>dividual traveled <strong>of</strong>f <strong>of</strong> the designated trail can be calculated (Table 3). <strong>Visitors</strong> were<br />
asked whether or not they hiked <strong>of</strong>f-trail to avoid feel<strong>in</strong>g crowded with results show<strong>in</strong>g<br />
that some visitors who answered ‘no’ to this question were recorded as travel<strong>in</strong>g <strong>of</strong>f-trail.<br />
The comb<strong>in</strong>ation <strong>of</strong> survey <strong>and</strong> <strong>GPS</strong>-based techniques allows for a comparison between<br />
reported behavior by visitors <strong>and</strong> actual, measured behaviors.<br />
It is possible that some visitors hiked <strong>of</strong>f-trail for reasons other than feel<strong>in</strong>g crowded<br />
<strong>and</strong> thus answered ‘no’ to this question on the survey; however, the comb<strong>in</strong>ation <strong>of</strong> <strong>GPS</strong>based<br />
methodology with survey techniques provides a means <strong>of</strong> comb<strong>in</strong><strong>in</strong>g <strong>in</strong>dividual<br />
visitor behavior with visitor characteristics. Survey techniques allow for the stratification<br />
<strong>of</strong> <strong>GPS</strong>-based track<strong>in</strong>g data by visitor characteristics, such as knowledge <strong>of</strong> Leave No<br />
Trace practices or activity type, <strong>and</strong> for comparisons <strong>of</strong> visitor behavior across groups. The<br />
comb<strong>in</strong>ation <strong>of</strong> survey results with <strong>GPS</strong>-based methodology allows managers to exam<strong>in</strong>e<br />
visitor use patterns stratified by user group. This <strong>in</strong>formation could further underst<strong>and</strong><strong>in</strong>g<br />
<strong>of</strong> the needs <strong>and</strong> behaviors <strong>of</strong> different groups <strong>and</strong> how to target certa<strong>in</strong> user groups based<br />
on behavior.<br />
55
56<br />
Table 3. Survey results from r<strong>and</strong>omly selected visitors at the Glacier Gorge<br />
Trailhead at RMNP.<br />
Visitor ID Distance Visitor Traveled Off-Trail 1 Hike Off-Trail To<br />
Avoid Feel<strong>in</strong>g Crowded?<br />
M<strong>in</strong> (m) Max (m) Mean (m)<br />
126 0 2.73 0.14 No<br />
148 0 28.07 4.09 No<br />
275 0 8.18 0.69 No<br />
309 0 2.73 0.14 No<br />
55 0 50.12 4.96 Yes<br />
128 0 8.18 1.12 Yes<br />
146 0 17.46 2.08 Yes<br />
295 0 53.70 3.39 Yes<br />
1 Euclidian distance calculated to trail buffer<br />
Conclusion<br />
<strong>GPS</strong>-based track<strong>in</strong>g methodologies provide accurate <strong>and</strong> detailed datasets that <strong>of</strong>fer<br />
<strong>in</strong>formation that cannot be practically collected us<strong>in</strong>g traditional methods for estimat<strong>in</strong>g<br />
visitor use. <strong>GPS</strong> methodologies are an established means <strong>of</strong> gather<strong>in</strong>g spatial <strong>and</strong> behavioral<br />
<strong>in</strong>formation <strong>in</strong> the wildlife sciences (Bowmen, Kochanny, Demarais, & Leopold, 2000;<br />
Burger & Shaffer, 2008; Rutter, 2007) <strong>and</strong> provide very valuable <strong>in</strong>formation to wildlife<br />
managers. This research shows that <strong>GPS</strong> methods can be employed successfully to further<br />
underst<strong>and</strong> visitor use <strong>in</strong> park <strong>and</strong> protected area management.<br />
<strong>GPS</strong> approaches do present some challenges <strong>and</strong> limitations. Logistically, an effective<br />
methodology needs to be devised to adm<strong>in</strong>ister <strong>and</strong> retrieve the <strong>GPS</strong> units used (Schaick<br />
& van der Spek, 2008). In complicated trail systems, to ensure a high return rate <strong>of</strong> units,<br />
it is important to have technicians or drop boxes located at all possible exit locations. Also,<br />
each unit should be labeled with <strong>in</strong>structions regard<strong>in</strong>g how to return the unit <strong>in</strong> the event<br />
that the visitor cannot f<strong>in</strong>d a technician or drop box. The battery life <strong>and</strong> data storage <strong>of</strong> the<br />
units employed <strong>in</strong> this study is a limitation if <strong>GPS</strong>-based methodology is to be utilized <strong>in</strong><br />
a backcountry, multi-day trip sett<strong>in</strong>g, but technology is be<strong>in</strong>g developed that will work <strong>in</strong><br />
this situation as well (Rupf, Koechli, Haider, Skov-Petersen, & Probstl, 2010).<br />
The issue <strong>of</strong> positional error <strong>and</strong> satellite reception can become a problem <strong>in</strong> certa<strong>in</strong><br />
environmental sett<strong>in</strong>gs, <strong>and</strong> therefore calibration techniques can be helpful to quantify the<br />
site-specific error associated with the track<strong>in</strong>g data. Recent <strong>GPS</strong> technological advances<br />
have resulted <strong>in</strong> more sensitive, accurate h<strong>and</strong>held units such as the Garm<strong>in</strong> <strong>GPS</strong> 60Cx <strong>and</strong><br />
<strong>GPS</strong> 60 CSx. However, the use <strong>of</strong> these updated units <strong>in</strong> <strong>GPS</strong>-based studies may be less<br />
feasible as they are more expensive than less sophisticated units <strong>and</strong> have a shorter battery<br />
life (Garm<strong>in</strong> Ltd., 2010). Regardless, as <strong>GPS</strong> technology cont<strong>in</strong>ues to improve, calibration<br />
<strong>and</strong> accuracy issues may become less <strong>of</strong> a concern.<br />
Data process<strong>in</strong>g <strong>and</strong> analysis are also significant considerations, as the approaches<br />
illustrated require some knowledge <strong>of</strong> GIS to edit <strong>and</strong> analyze the data collected. Recently<br />
developed extensions for ArcMap (a GIS s<strong>of</strong>tware program) allow for quick <strong>and</strong> easy<br />
importation <strong>of</strong> large numbers <strong>of</strong> <strong>GPS</strong> tracks <strong>in</strong>to a GIS environment. Once <strong>in</strong> a GIS<br />
environment, a basic knowledge <strong>of</strong> ArcGIS is required for the data-clean<strong>in</strong>g process as<br />
corrupt files are easily identified <strong>and</strong> many <strong>of</strong> the analysis presented here (po<strong>in</strong>t density,
straight l<strong>in</strong>e distance calculations, time analyses) can be completed us<strong>in</strong>g available tools<br />
<strong>in</strong> ArcMap (Schaick & van der Spek, 2008). An overrid<strong>in</strong>g concern is that the approach<br />
illustrated here, particularly the density analysis, is a result <strong>of</strong> both visitor use levels<br />
<strong>and</strong> visitor behavior—high-po<strong>in</strong>t densities can be the result <strong>of</strong> either high total use or<br />
visitors paus<strong>in</strong>g <strong>and</strong> congregat<strong>in</strong>g while the <strong>GPS</strong> is collect<strong>in</strong>g data. These po<strong>in</strong>t densities<br />
were applicable for the larger social <strong>and</strong> ecological projects for which these methods<br />
were developed, but other <strong>in</strong>vestigators may be <strong>in</strong>terested <strong>in</strong> assess<strong>in</strong>g use <strong>and</strong> behavior<br />
<strong>in</strong>dependently. In this case, some additional methodological development is needed.<br />
Despite these limitations, <strong>GPS</strong>-based methodologies have clear advantages <strong>and</strong><br />
applications. The time dem<strong>and</strong> on visitors is m<strong>in</strong>imal <strong>and</strong> less tra<strong>in</strong><strong>in</strong>g is required for<br />
staff to conduct a <strong>GPS</strong>-based track<strong>in</strong>g study compared to other techniques. In the case<br />
studies presented, there were low refusal rates for participation that resulted <strong>in</strong> very ample<br />
datasets be<strong>in</strong>g collected <strong>in</strong> a relatively short period <strong>of</strong> time. <strong>GPS</strong> technology allows for<br />
the exam<strong>in</strong>ation <strong>of</strong> subtle visitor movements such as <strong>of</strong>f-trail use that would be difficult<br />
or even impossible to measure accurately with traditional techniques. <strong>GPS</strong>-based track<strong>in</strong>g<br />
datasets conta<strong>in</strong> valuable descriptive data such as time, speed, direction, <strong>and</strong> elevation <strong>and</strong><br />
the method produces potentially less biased datasets compared to observational studies,<br />
diaries, <strong>and</strong> survey techniques. The case studies presented demonstrate just a few examples<br />
<strong>of</strong> analysis that can be conducted us<strong>in</strong>g <strong>GPS</strong>-based tracks. Other possible data analyses<br />
techniques <strong>in</strong>clude time series analysis, three-dimensional displays <strong>of</strong> density, analysis <strong>of</strong><br />
visitor speed, <strong>and</strong> stratification <strong>of</strong> results by activity type characteristics (Schaick & van<br />
der Spek, 2008).<br />
As demonstrated through the case studies exam<strong>in</strong>ed <strong>in</strong> this paper, the methods<br />
presented can be implemented <strong>in</strong> a range <strong>of</strong> sett<strong>in</strong>gs to address a variety <strong>of</strong> managerial issues<br />
or problems. There is potential for the <strong>in</strong>formation provided by <strong>GPS</strong>-based techniques to<br />
lead to more <strong>in</strong>formed management decisions due to the high levels <strong>of</strong> accuracy <strong>and</strong> detail<br />
that cannot be practically collected us<strong>in</strong>g traditional methodologies. Future implementation<br />
<strong>and</strong> development <strong>of</strong> the techniques presented here can serve to exp<strong>and</strong> the utility <strong>and</strong><br />
worth<strong>in</strong>ess <strong>of</strong> the <strong>GPS</strong>-based measures as an emerg<strong>in</strong>g technique to underst<strong>and</strong> visitor use<br />
<strong>in</strong> parks <strong>and</strong> protected areas.<br />
References<br />
Arnberger, A., Haider, W., & Br<strong>and</strong>enburg, C. (2005). Evaluation visitor-monitor<strong>in</strong>g<br />
techniques: A comparison <strong>of</strong> count<strong>in</strong>g <strong>and</strong> video observation data. Environmental<br />
Management, 36(2), 317-327.<br />
Arrowsmith, C., & Chhetri, P. (2003). Port Campbell National Park: Patterns <strong>of</strong> Use. A<br />
report for the development <strong>of</strong> a visitor typology as <strong>in</strong>put to a generic model <strong>of</strong> visitor<br />
movements <strong>and</strong> patterns <strong>of</strong> use. Melbourne.<br />
Bates, M., Wallace, G., & Vaske, J. J. (2007). Estimat<strong>in</strong>g visitor use <strong>in</strong> Rocky Mounta<strong>in</strong><br />
National Park. (HDNRU Report No. 74). Report for Rocky Mounta<strong>in</strong> National Park.<br />
Fort Coll<strong>in</strong>s: Colorado State University, Human Dimensions <strong>in</strong> Natural Resources<br />
Unit.<br />
Bowman, J. L., Kochanny, C.O., Demarais, S., & Leopold, B. D. (2000). Evaluation <strong>of</strong> a<br />
<strong>GPS</strong> collar for white-tailed deer. Wildlife Society Bullet<strong>in</strong> 28, 141–145.<br />
Burger, A. E., & Shaffer, S. A. (2008). Application <strong>of</strong> track<strong>in</strong>g <strong>and</strong> data-logg<strong>in</strong>g technology<br />
<strong>in</strong> research <strong>and</strong> conservation <strong>of</strong> seabirds. The Auk, 125(2), 253-264.<br />
Cordell, H. K., Betz, C. J., & Green, G. T. (2008). Nature-based outdoor recreation trends<br />
<strong>and</strong> wilderness. International Journal <strong>of</strong> Wilderness, 14(2), 7–13.<br />
57
58<br />
Cushwa, C.T., & McG<strong>in</strong>nes, B.S. (1963). Sampl<strong>in</strong>g procedures <strong>and</strong> estimates <strong>of</strong> recreation<br />
use on 100 square miles <strong>of</strong> the George Wash<strong>in</strong>gton National Forest. National<br />
American Wildlife & Natural Resources Conference 28, 457-465.<br />
De Lacy, T., & Whitmore, M. (2006). Tourism <strong>and</strong> recreation. In: Lockwood, M., Worboys,<br />
G. L., & Kothari, A. (Eds.), Manag<strong>in</strong>g protected areas: A global guide. Earthscan,<br />
London, pp. 497-527.<br />
Echelberger, H. E., Leonard, R. E., & Plumley, H. J. (1981). Validation <strong>of</strong> trailside<br />
registration boxes. Journal <strong>of</strong> Soil <strong>and</strong> Water Conservation, 36(1), 53-54.<br />
Gamble, L., Lawson, S., Monz, C. A., & Newman, P. L. (2007). Model<strong>in</strong>g the effects<br />
<strong>of</strong> alternative transportation on resource protection <strong>and</strong> visitor experience <strong>in</strong> Rocky<br />
Mounta<strong>in</strong> National Park. Alternative Transportation <strong>in</strong> the <strong>Parks</strong> <strong>and</strong> Public L<strong>and</strong>s<br />
Program. Project Proposal. 17pp.<br />
Garm<strong>in</strong> Ltd (2010). <strong>GPS</strong> 60 Product Specifications. Available from: http://www.garm<strong>in</strong>.<br />
com/garm<strong>in</strong>/cms/site/us/onthetrail.<br />
Greene-Roesel, R., Diogenes, M. C., Ragl<strong>and</strong>, D. R., & L<strong>in</strong>dau, L. A. (2008). Effectiveness<br />
<strong>of</strong> a Commercially Available Automated Pedestrian Count<strong>in</strong>g Device <strong>in</strong> Urban<br />
Environments: Comparison with Manual Counts. In proceed<strong>in</strong>gs <strong>of</strong> the 2008<br />
Transportation Research Board 87th Annual Meet<strong>in</strong>g, Wash<strong>in</strong>gton D.C., USA.<br />
Hallo, J. C., Mann<strong>in</strong>g, R. E., Valliere, W., & Budruk, M. (2005). A case study comparison<br />
<strong>of</strong> visitor self-reported <strong>and</strong> <strong>GPS</strong> recorded travel routes. In proceed<strong>in</strong>gs <strong>of</strong> the 2004<br />
Northeastern Recreation Research Symposium, (Gen. Tech. Rep. NE-326), U.S.<br />
Department <strong>of</strong> Agriculture, Forest Service, Northeastern Research Station, Newtown<br />
Square, PA.<br />
Hammitt, W. E., & D. N. Cole. (1998). Wildl<strong>and</strong> recreation: Ecology <strong>and</strong> management.<br />
New York: John Wiley & Sons.<br />
Hendee, J. C., & Lucas, R. C. (1973). M<strong>and</strong>atory wilderness permits: a necessary<br />
management tool. Journal <strong>of</strong> Forestry, 71, 206-209.<br />
Hollenhorst, S. J., Whisman, S. A., & Ewert, A. W. (1992). Monitor<strong>in</strong>g Visitor Use <strong>in</strong><br />
<strong>Backcountry</strong>. In: Pacific Southwest Forest Research Station, General Technical<br />
Report.<br />
James, G. A., & Ripley, T. H. (1963). Instructions for us<strong>in</strong>g traffic counters to estimate<br />
recreation visits <strong>and</strong> use. Research Paper SE-3. Asheville, NC: U.S. Department <strong>of</strong><br />
Agriculture, Forest Service, Southeastern Forest Experiment Station. 12 p.<br />
James, G. A., & Harper, R. A. (1965). Recreation use <strong>of</strong> the Ocala National Forest <strong>in</strong><br />
Florida. USDA Forest Service Research Paper SE-31, 28pp.<br />
James, G. A., & Henley, R. K. (1968). Sampl<strong>in</strong>g procedures for estimat<strong>in</strong>g mass <strong>and</strong><br />
dispersed types <strong>of</strong> recreation use on large areas. Research Paper. SE-31. Asheville,<br />
NC: U.S. Department <strong>of</strong> Agriculture, Forest Service, Southeastern Forest Experiment<br />
Station. 15 p.<br />
James, G. A. (1971). Inventory<strong>in</strong>g recreation use. In proceed<strong>in</strong>gs from the forest recreation<br />
symposium, Syracuse, NY (78-95). Northeast Forest Experiment Station, Upper<br />
Darby, PA.<br />
Kauffman, M. J., & Courtemanch, A. (2009). Unpublished report. Wyom<strong>in</strong>g Cooperative<br />
Fish <strong>and</strong> Wildlife Research Unit. Laramie, WY: University <strong>of</strong> Wyom<strong>in</strong>g.<br />
Kovas, T. J. (1970). Self-adm<strong>in</strong>istered park visitor survey technique. Canadian Outdoor<br />
Recreation Study. Canada National <strong>Parks</strong> Service-Plann<strong>in</strong>g Department <strong>of</strong> Indian<br />
Affairs <strong>and</strong> Northern Development. 23 pp.<br />
Lai, P. C., Li, C. L., Chan, K. W., & Kwong, K. H. (2007). An Assessment <strong>of</strong> <strong>GPS</strong> <strong>and</strong><br />
GIS <strong>in</strong> Recreational Track<strong>in</strong>g. Journal <strong>of</strong> Park <strong>and</strong> Recreation Adm<strong>in</strong>istration, 25(1),<br />
128–139.
Lawson, S. (2006). Computer simulation as a tool for plann<strong>in</strong>g <strong>and</strong> management <strong>of</strong> visitor<br />
use <strong>in</strong> protected natural areas. Journal <strong>of</strong> Susta<strong>in</strong>able Tourism, 14(6), 600-617.<br />
Leatherberry, E. C., & Lime, D. W. (1981). Unstaffed trail registration compliance <strong>in</strong> a<br />
backcountry recreation area. Res. Paper NC-214. St. Paul, MN: North Central Forest<br />
Experiment Station, Forest Service, U.S. Department <strong>of</strong> Agriculture; 11 p.<br />
Leonard, R. E., Echelberger, H. E., Plumley, H. J., & Van Meter, L. W. (1980).<br />
Management guidel<strong>in</strong>es for monitor<strong>in</strong>g use on backcountry trails. Research Paper<br />
NE-286. Broomall, PA: Northeastern Forest Experiment Station, Forest Service, U.S.<br />
Department <strong>of</strong> Agriculture; 20 p.<br />
Ligtenberg, A., van Marwijk, R., Moelans, B., & Kuijpers, B. (2008). Recogniz<strong>in</strong>g<br />
patterns <strong>of</strong> movements <strong>in</strong> visitor flows <strong>in</strong> nature areas. In proceed<strong>in</strong>gs from the<br />
Fourth International Conference on Monitor<strong>in</strong>g <strong>and</strong> management <strong>of</strong> visitor flows <strong>in</strong><br />
recreational <strong>and</strong> protected areas, Montecat<strong>in</strong>i Terme, Italy.<br />
Mann<strong>in</strong>g, R. E. (1999). Studies <strong>in</strong> outdoor recreation: Search <strong>and</strong> research for satisfaction.<br />
Corvallis OR: Oregon State University Press.<br />
Monz, C. A., Cole, D. N., Marion, J. L., Leung, Y. F. (2010). Susta<strong>in</strong><strong>in</strong>g Visitor Use <strong>in</strong><br />
Protected Areas: Future Opportunities <strong>in</strong> Recreation Ecology Research <strong>Based</strong> on the<br />
USA Experience. Environmental Management, 45(3), 551-562.<br />
Muhar, A., Arnberger, A., & Br<strong>and</strong>enburg, C. (2002). Methods for visitor monitor<strong>in</strong>g <strong>in</strong><br />
recreational <strong>and</strong> protected areas: An overview. In proceed<strong>in</strong>gs from the Conference<br />
on Monitor<strong>in</strong>g <strong>and</strong> Management <strong>of</strong> <strong>Visitors</strong> Flows <strong>in</strong> Recreational <strong>and</strong> Protected<br />
Areas. Bodenkultur University, Vienna, Austria.<br />
National Park Service. (2009). Visitor Statistics [data file]. Available from: http://www.<br />
nature.nps.gov/stats/.<br />
Newsome, D., Moore, S. A., & Dowl<strong>in</strong>g, R. K. (2002). Natural area tourism: Ecology,<br />
impacts, <strong>and</strong> management. Clevedon: Channel View Publications.<br />
O’Connor, A., Zerger, A., & Itami, B. (2005). Geo-temporal track<strong>in</strong>g <strong>and</strong> analysis <strong>of</strong> tourist<br />
movement. Mathematics <strong>and</strong> Computers <strong>in</strong> Simulation, 69(1-2), 135–150.<br />
Park, L. O., Mann<strong>in</strong>g, R. E., Marion, J. L., Lawson, S. R., & Jacobi, C. (2008). Manag<strong>in</strong>g<br />
Visitor Impacts <strong>in</strong> <strong>Parks</strong>: A Multi-Method Study <strong>of</strong> the Effectiveness <strong>of</strong> Alternative<br />
Management Practices. Journal <strong>of</strong> Park <strong>and</strong> Recreation Adm<strong>in</strong>istration, 26(1), 97–<br />
121.<br />
Pettebone, D., Newman, P., Beaton, C., Stack, D., & Gibson, A. (2008). Estimat<strong>in</strong>g visitor<br />
use <strong>in</strong> Yosemite National Park. Report for Yosemite National Park. Fort Coll<strong>in</strong>s:<br />
Colorado State University, Center for Protected Areas Management <strong>and</strong> Tra<strong>in</strong><strong>in</strong>g.<br />
Pettebone, D. (2009). Quantify<strong>in</strong>g <strong>and</strong> model<strong>in</strong>g visitor use <strong>in</strong> Yosemite National Park<br />
<strong>and</strong> Rocky Mounta<strong>in</strong> National Park. Doctoral dissertation, Colorado State University,<br />
2009.<br />
Rupf, R., Koechli, D., Haider, W., Skov-Petersen, H., Probstl, U. (2010). Framework<br />
Mafre<strong>in</strong>a: Management toolkit for recreation <strong>and</strong> wildlife <strong>in</strong> the Swiss Alps. In<br />
proceed<strong>in</strong>gs from the Fifth International Conference on Monitor<strong>in</strong>g <strong>and</strong> Management<br />
<strong>of</strong> Visitor flows <strong>in</strong> Recreational <strong>and</strong> Protected Areas. Wagen<strong>in</strong>gen, The Netherl<strong>and</strong>s.<br />
Rutter, S. M. (2007). The <strong>in</strong>tegration <strong>of</strong> <strong>GPS</strong>, vegetation mapp<strong>in</strong>g <strong>and</strong> GIS <strong>in</strong> ecological<br />
<strong>and</strong> behavioral studies. Revista Brasileira de Zootecnia, 36, 63–70.<br />
Sawyer, H., Nielson, R. M., L<strong>in</strong>dzey, F., & McDonald, L. L. (2006). W<strong>in</strong>ter Habitat<br />
Selection <strong>of</strong> Mule Deer Before <strong>and</strong> Dur<strong>in</strong>g Development <strong>of</strong> a Natural Gas Field.<br />
Journal <strong>of</strong> Wildlife Management, 70(2), 396-403.<br />
Schaick, J., & van der Spek, S. (2008). Urbanism on track. Amsterdam, Netherl<strong>and</strong>s: Deft<br />
University Press.<br />
59
60<br />
Schreuder, H. T., Tyre, G. L. & James, G. A. (1975). Instant- <strong>and</strong> <strong>in</strong>terval-count sampl<strong>in</strong>g.<br />
Forest Science, 21(1), 40-45.<br />
Shoval, N., & Isaacson, M. (2007). Track<strong>in</strong>g tourists <strong>in</strong> the digital age. Annals <strong>of</strong> Tourism<br />
Research, 34(1), 141–159.<br />
Thorsell, J.W. (1967). Recreation use <strong>in</strong> Waterton Lake National Park. (Master’s Thesis,<br />
University <strong>of</strong> Western Ontario, 1967).<br />
Vaske, J. J., & Donnelly, M. P. (2007). Estimat<strong>in</strong>g visitor use at Boulder Open Space<br />
<strong>and</strong> Mounta<strong>in</strong> <strong>Parks</strong>: Summer 2004-2006 Comparisons. (HDNRU Report No. 79).<br />
Report for Boulder Open Space <strong>and</strong> Mounta<strong>in</strong> <strong>Parks</strong>. Fort Coll<strong>in</strong>s: Colorado State<br />
University, Human Dimensions <strong>in</strong> Natural Resources Unit.<br />
Wagar, J. A. (1969). Estimation <strong>of</strong> visitor use from self-registration at developed recreation<br />
sites. Research Paper INT-70. Ogden, UT: Intermounta<strong>in</strong> Forest <strong>and</strong> Range Experiment<br />
Station, Forest Service, U.S. Depart¬ment <strong>of</strong> Agriculture; 27 p.<br />
Watson, A. E., Cole, D. N., Turner, D. L., & Reynolds, P. S. (2000). Wilderness recreation<br />
use estimation: a h<strong>and</strong>book <strong>of</strong> methods <strong>and</strong> systems. USDA Forest Service General<br />
Technical Report RMRS-GTR-56. Rocky Mounta<strong>in</strong> Research Station.<br />
Wenger, Wiley D. Jr., & Gregerson, H. M. (1964). The effect <strong>of</strong> nonresponse on<br />
representativeness <strong>of</strong> wilderness-trail register <strong>in</strong>formation. Res. Pap. PNW-17.<br />
Portl<strong>and</strong>, OR: U.S. Department <strong>of</strong> Agriculture, Forest Service, Pacific Northwest<br />
Forest <strong>and</strong> Range Experiment Station. 20 p.