
Create successful ePaper yourself
Turn your PDF publications into a flip-book with our unique Google optimized e-Paper software.
OPNET Technologies, Inc.<br />
2 0 1 1 A N N U A L R E P O R T
This <strong>Annual</strong> <strong>Report</strong> contains forward-looking statements that<br />
involve substantial risks and uncertainties. You can identify these<br />
statements by forward-looking words such as “anticipate,” “believe,”<br />
“could,” “estimate,” “expect,” “intend,” “may,” “plan,” “potential,” “should,”<br />
“will,” and “would” or similar words. You should read statements<br />
that contain these words carefully because they discuss our future<br />
expectations, contain projections of our future results of opera-<br />
tions or of our financial position, or state other forward-looking<br />
information. We believe that it is important to communicate our<br />
future expectations to our investors. However, there may be events<br />
in the future that we are not able to predict accurately or control.<br />
The factors listed in our <strong>Annual</strong> <strong>Report</strong> on Form 10-K filed with the<br />
Securities and Exchange Commission on June 3, <strong>2011</strong> under “Risk<br />
$101,346<br />
OPNET Technologies, Inc. <strong>2011</strong> <strong>Annual</strong> <strong>Report</strong><br />
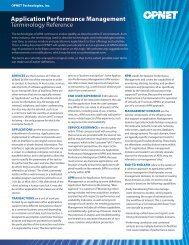
<strong>Annual</strong> Revenue Fiscal <strong>2011</strong> Operating Margins Fiscal <strong>2011</strong> Diluted Earnings<br />
per share<br />
Factors,” as well as any<br />
$147,986<br />
cautionary language in this <strong>Annual</strong> <strong>Report</strong>,<br />
provide $122,879 examples $126,347 of risks, uncertainties, and events that may cause<br />
15.2%<br />
$101,346 our actual results to differ materially from the expectations 14.1% we de-<br />
12.9%<br />
scribe in our forward-looking statements. You should also carefully<br />
review the risks outlined in other<br />
7.4%<br />
documents that we file from time<br />
to time with the Securities and Exchange Commission, including<br />
our Quarterly <strong>Report</strong>s on Form 10-Q that we will file in fiscal 2012.<br />
The forward-looking statements provided in this <strong>Annual</strong> <strong>Report</strong><br />
2008 represent 2009 our 2010 expectations <strong>2011</strong> as of July Q1 28, <strong>2011</strong>. Q2 We Q3 anticipate Q4that<br />
Q1 Q2 Q3 Q4<br />
subsequent events and developments will cause our expectations<br />
to change. However, while we may elect to update this forward-<br />
looking information at some point in the future, we specifically<br />
disclaim any obligation to do so. This forward-looking information<br />
should not be relied upon as representing our expectations as of<br />
any date subsequent to July 28, <strong>2011</strong>.<br />
$122,879 $126,347<br />
$147,986<br />
$0.06<br />
$101,346<br />
$122,879 $126,347<br />
$147,986<br />
<strong>Annual</strong> Revenue Fiscal 201<br />
$101,346<br />
$122,879 $126,347<br />
$147,986<br />
7.4%<br />
12.<br />
2008 2009 2010 <strong>2011</strong> Q1 Q<br />
<strong>Annual</strong> Revenue Fiscal <strong>2011</strong> Operating Margins Fiscal 201<br />
per share<br />
7.4%<br />
12.9%<br />
14.1%<br />
15.2%<br />
$0.06<br />
2008 2009 2010 <strong>2011</strong> Q1 Q2 Q3 Q4 Q1 Q<br />
<strong>Annual</strong> Revenue Fiscal <strong>2011</strong> Operating Margins Fiscal <strong>2011</strong> Diluted Earnings<br />
per share<br />
7.4%<br />
$0.13<br />
12.9%<br />
$0.19<br />
2008 2009 2010 <strong>2011</strong> Q1 Q2 Q3 Q4 Q1 Q2 Q3 Q4<br />
14.1%<br />
$0.17<br />
15.2%<br />
Corporate<br />
Highlights<br />
<strong>Annual</strong> Diluted Earnings<br />
per share<br />
$0.03<br />
2008 2009 2010 <strong>2011</strong><br />
$0.06<br />
$0.23<br />
$0.13<br />
$0.28<br />
$0.19<br />
$0.55<br />
$0.17<br />
$<br />
Annu<br />
per sh<br />
$0.03<br />
2008
Letter To Shareholders<br />
Dear Shareholders,<br />
Fiscal <strong>2011</strong> was a year of growth for OPNET. We achieved record<br />
revenue of approximately $148 million, up by 17% relative to the<br />
prior fiscal year. We also increased new software license revenue<br />
by 39% to $72.4 million, grew operating income by 132% to $18.8<br />
million, and increased deferred revenue to $47.5 million. We accom-<br />
plished this with relatively flat headcount.<br />
Due to OPNET’s strong cash position and the ability we have shown<br />
to generate positive cash flow from operations, we increased our<br />
dividend distribution to $.10 per share for each of the four quarters<br />
in fiscal <strong>2011</strong>. Additionally, we paid a one-time special dividend<br />
of $0.75 per share. Notwithstanding these dividend distributions,<br />
OPNET increased its cash position during fiscal <strong>2011</strong> to a record<br />
$114.7 million, up from $104.7 at the end of fiscal 2010.<br />
In fiscal <strong>2011</strong>, OPNET continued its broad initiative to expand its<br />
activities in Service Assurance, aligning its solution portfolio and<br />
service offerings with two highly complementary sectors: Applica-<br />
tion Performance Management (APM) and Network Performance<br />
Management (NPM). OPNET is a leader among IT management<br />
software vendors in promoting the view that NPM is, in fact, a key<br />
component of APM. OPNET and its customers have demonstrated<br />
that while NPM can be viewed as an IT discipline in its own right,<br />
it delivers far more value to the enterprise when viewed from an<br />
APM perspective, allowing a much more powerful service assur-<br />
ance capability to be developed. As a result<br />
of OPNET’s innovative approach, increased<br />
market share, and visibility in the IT service<br />
management space, we were pleased to<br />
be recognized by multiple leading industry<br />
analysts as a significant player in APM. OPNET<br />
is now viewed as a prominent technology<br />
supplier with unique advantages due to its<br />
ability to span both APM and NPM. We believe<br />
that OPNET can achieve much deeper market<br />
penetration in this large and growing space,<br />
and have significantly expanded our market-<br />
ing programs in order to achieve this goal.<br />
OPNET Technologies, Inc. <strong>2011</strong> <strong>Annual</strong> <strong>Report</strong><br />
Marc A. Cohen<br />
Chairman and Chief Executive Officer<br />
1<br />
We believe that our results in fiscal <strong>2011</strong> demonstrate that our<br />
strategy is working to grow our market recognition and our sales<br />
momentum. In fiscal <strong>2011</strong>, OPNET continued to expand its network<br />
of sales partners and independent resellers, both in the US and<br />
overseas. Our channel program now generates over 20% of new<br />
product sales. In fiscal <strong>2011</strong>, APM sales increased by 41% relative to<br />
the prior fiscal year – the third consecutive year of strong double-<br />
digit growth. During fiscal <strong>2011</strong>, APM represented nearly 70% of<br />
product bookings.<br />
During fiscal <strong>2011</strong> we also generated cash flow from operations of<br />
$26.7 million, maintained a strong balance sheet with no debt, and<br />
invested 24% of our total revenue into research and development.<br />
Despite the soft economy, we grew operating margin to 12.7% from<br />
6.4% in fiscal 2010. We believe our expanded presence in the APM<br />
sector has positioned OPNET for long-term growth in revenue and<br />
profitability.<br />
None of this would have been possible without the dedication and<br />
hard work of our staff and their successful track record of continu-<br />
ous innovation. During fiscal <strong>2011</strong>, OPNET filed ten new patent<br />
applications, further building on our base of intellectual property<br />
and extending barriers to entry.<br />
In summary, fiscal <strong>2011</strong> was a year of significant accomplishments<br />
for OPNET. We believe that we are uniquely positioned to be a lead-<br />
Alain J. Cohen<br />
ing global provider of IT Service Management<br />
solutions in a market where growth is driven<br />
by increasing infrastructure complexity, more<br />
stringent performance demands, and a need<br />
for greater automation in order to drive down<br />
costs.<br />
We would like to thank all the employees of<br />
OPNET, our customers, and our shareholders<br />
for their commitment to our solutions and<br />
belief in our vision.<br />
President and Chief Technology Officer
Corporate Profile<br />
OPNET Technologies, Inc. is a leading provider of solutions for<br />
application and network performance management. Applications<br />
are utilized by the enterprise to conduct business, both internally<br />
and externally. Due to the many facets of their operations, most<br />
organizations have a large number of such applications, commonly<br />
several hundred, including dozens or more that are considered<br />
“mission critical.” There are also other essential IT services, such as<br />
telephony, video-conferencing, and access to information (e.g., file<br />
storage and retrieval). It is indisputable that today’s large organiza-<br />
tions, and even many medium sized entities, have evolved a busi-<br />
ness model that is directly reflected by, and dependent upon, the<br />
services provided by IT. The IT organization’s primary objective is to<br />
ensure that these services are provided with the level of reliability<br />
and performance required to satisfy the enterprise, which is the<br />
“customer” of IT.<br />
Within this rapidly evolving, complex environment, traditional ap-<br />
proaches to managing the performance of IT services are no longer<br />
sufficient to empower IT to provide the requisite level of service to<br />
the enterprise. These approaches provide the ability to monitor,<br />
record, and alert on basic health and status metrics of the individual<br />
elements that constitute the service delivery infrastructure. How-<br />
ever, this “silo-based monitoring” paradigm falls short for two fun-<br />
damental reasons: the information that is gathered is insufficiently<br />
fine-grained; and there is an absence of analytical tools needed to<br />
combine and correlate the many sources of information to deliver<br />
actionable information.<br />
OPNET’s solutions address the major requirements for service assur-<br />
ance, which are Application Performance Management (APM) and<br />
Network Performance Management (NPM), collectively referred to<br />
as Performance Management. These are central to OPNET’s business<br />
strategy, and critical to organizations in every industry and geog-<br />
raphy. OPNET is uniquely positioned to deliver a suite of solutions<br />
that excel at addressing the most critical challenges associated with<br />
Performance Management.<br />
• OPNET was among the first to recognize that beyond simply<br />
covering a broad scope of technology domains, management<br />
solutions should also enable organizations to bridge the gaps<br />
between domains, with data and workflow integrations that<br />
overcome the fractured approach that hinders end-to-end per-<br />
formance management.<br />
• OPNET introduced new thinking about the respective roles of<br />
performance and forensic data, and an analytics framework that<br />
combines these data sets across its APM suite for greater insight<br />
into application behavior.<br />
OPNET Technologies, Inc. <strong>2011</strong> <strong>Annual</strong> <strong>Report</strong><br />
2<br />
• OPNET is a leader in addressing the critical dependency of APM<br />
on NPM, particularly with the emerging prominence of cloud<br />
computing, virtualization, Service Oriented Architecture, and<br />
other models wherein the application is significantly more<br />
susceptible to network performance issues. Further, certain<br />
critical applications, by their nature, must be managed from the<br />
network perspective, including VoIP, video, and messaging.<br />
• OPNET was an early promoter of Performance Engineering as<br />
a discipline, with methodologies and solutions for pre-deploy-<br />
ment performance assurance. Recently, OPNET adapted these<br />
methodologies to ensure application performance in cloud<br />
deployments.<br />
• OPNET was a leader in introducing licensing models that ad-<br />
dress dynamic environments inherent in virtualization and<br />
cloud computing. OPNET’s approach covers all users and com-<br />
ponents associated with a given application, regardless of their<br />
number, location, or growth over time, and provides a clear view<br />
of the total cost of ownership.<br />
OPNET continues to extend its well-established technology leader-<br />
ship, demonstrated by our substantial portfolio of intellectual prop-<br />
erty. Central to OPNET’s approach is our High Definition blueprint<br />
for APM, which describes technology architecture and go-to-mar-<br />
ket strategy, highlighting differentiating characteristics of OPNET’s<br />
approach. High Definition APM embodies the critical attributes of<br />
an effective APM solution, and is characterized by the following:<br />
Breadth: Applications are implemented across many functional<br />
domains in the IT infrastructure. All of these domains may impact<br />
application performance. An APM solution with breadth provides<br />
visibility into all or most of these areas.<br />
Depth: Depth is the “high resolution” part of high-definition. It<br />
means that the collected information is rich enough to characterize<br />
problems, uncover behavioral patterns, and isolate the root cause of<br />
performance issues.<br />
Analytics: Breadth and depth multiply to yield vast quantities of<br />
data. Putting that data to work to solve problems requires advanced<br />
tools. OPNET calls these tools “Analytics”: an array of algorithms and<br />
techniques for extracting useful information from data collected by<br />
the APM instrumentation. OPNET has been a pioneer in introducing<br />
advanced, yet practical analytics in APM solutions.<br />
Integration: To address each of the domains of an application<br />
requires specialized tools. These tools, by their very nature, have<br />
different workflows and manipulate different types of information.
However, using the tools in a coordinated fashion delivers far more<br />
support and efficiency to APM users. OPNET’s integrated solution<br />
suite provides workflows that transition between domains contex-<br />
tually, as well as true correlation and data fusion.<br />
Low Overhead: APM capabilities become impractical to deploy if<br />
they impose overhead that noticeably impacts application perfor-<br />
mance. OPNET has specialized in developing zero-overhead passive<br />
monitoring and low-overhead agent-based technologies to collect<br />
data for its APM solutions. All of OPNET’s solutions are designed for<br />
production environments.<br />
Application Performance Management<br />
Application Performance Management is now a key IT discipline<br />
because maintaining the performance and availability of appli-<br />
cations is the primary service an IT department provides to the<br />
enterprise. To enable this vital activity, OPNET has been delivering<br />
pioneering APM capabilities for more than eleven years, and has<br />
emerged as a leading provider of solutions in this rapidly growing<br />
market.<br />
By implementing a comprehensive APM solution, IT organizations<br />
can realize the following high-impact benefits:<br />
• Observe the experience of real application users live, and alert<br />
on service level agreement violations.<br />
• Trend historical performance of an application to detect or<br />
confirm degradation in user experience.<br />
• Accelerate troubleshooting and remediation.<br />
• Eliminate “finger-pointing” among teams, promoting coopera-<br />
tive approaches to solving problems.<br />
• Detect early warnings signs of application performance prob-<br />
lems and take preventive action.<br />
• Understand the relationship among applications and infrastruc-<br />
ture components.<br />
• Make informed decisions about infrastructure improvements<br />
related to application performance.<br />
• Reduce the risk of delay or failure by verifying application readi-<br />
ness prior to deployment.<br />
OPNET Technologies, Inc. <strong>2011</strong> <strong>Annual</strong> <strong>Report</strong><br />
3<br />
OPNET’s software solutions aim to generate return on invest-<br />
ment for a broad customer base, including corporate enterprises,<br />
government agencies, network service providers, defense agencies,<br />
and network equipment manufacturers. These organizations rely<br />
on OPNET software to improve operational effectiveness through<br />
higher availability and performance, reduce mean time to resolution<br />
of incidents, accelerate the deployment of strategic services, reduce<br />
IT operating and capital costs, manage risk associated with growth<br />
and change, and increase productivity.<br />
APM XPERT SOLUTION SUITE<br />
AppResponse Xpert (formerly ACE Live) is an appliance-based<br />
solution that monitors and analyzes end-user experience. It also<br />
supports in-depth monitoring and analysis of the underlying net-<br />
work, a domain that is vital to comprehensive APM. AppResponse<br />
Xpert leverages the central role of the network in transporting<br />
transaction data to obtain vital information about relationships<br />
among clients and servers, and server tiers. On-board analytics ex-<br />
tract transactions from application flows and break down applica-<br />
tion response time, identifying which parts of the infrastructure are<br />
contributing most to delays.<br />
AppInternals Xpert (formerly OPNET Panorama®) delves into the<br />
complex software frameworks and operating systems of modern<br />
servers to extract vast amounts of performance and forensic data<br />
to support all aspects of APM from the server perspective. AppIn-<br />
ternals Xpert can provide analysis for any type of application, but<br />
excels, in particular, in Java and .NET environments.<br />
AppMapper Xpert automatically produces a run-time applica-<br />
tion map, identifying the underlying application components and<br />
infrastructure components that enable a production application.<br />
This model of the application, captured at the time of execution, is<br />
essential for troubleshooting application performance problems. It<br />
also provides critical information to improve many key operational<br />
processes, such as configuration and change management, impact<br />
analysis, migration to cloud computing, and data center virtualiza-<br />
tion and consolidation.
AppSQL Xpert provides deep visibility into database performance<br />
through real-time monitoring of a broad range of metrics, with<br />
drilldowns to fine-grained forensic database transaction data for<br />
troubleshooting. It performs detailed tracking of database usage<br />
for trending and performance optimization. It also detects data-<br />
base policy violations, such as unauthorized access and suspicious<br />
usage patterns. AppSQL Xpert provides high definition analysis of<br />
database performance while offering an agentless approach that<br />
imposes zero overhead on database operation.<br />
BTM Xpert is a solution bundle that delivers business transaction<br />
management (BTM) and extends that paradigm by enriching it with<br />
significantly greater performance information. BTM Xpert lever-<br />
ages the capabilities of AppResponse Xpert for end-user experience<br />
monitoring and AppInternals Xpert for transaction following. BTM<br />
Xpert also joins two key workflows: user analytics, which identify<br />
when performance issues are impacting business operations; and<br />
deep transaction tracing for precise root cause analysis.<br />
AppTransaction Xpert (formerly ACE Analyst) is a powerful tool<br />
for detailed analysis of individual transactions. In today’s complex<br />
Network Performance Management<br />
Network management teams who plan, engineer, and operate<br />
complex and constantly changing networks are responsible for<br />
the infrastructure that supports business-critical services and ap-<br />
plications. OPNET’s customers rely on our solutions to ensure high<br />
performance and availability. Key capabilities include the ability to:<br />
• Validate network configuration changes prior to deployment.<br />
• Enhance security and reliability with scheduled network audits.<br />
• Optimize network performance through traffic engineering.<br />
• Minimize costs through capacity planning.<br />
• Ensure network survivability by simulating failures.<br />
• Accelerate new service deployments and data center consolida-<br />
tions.<br />
• Visualize the network in logical and physical views, including<br />
live overlays of infrastructure and traffic.<br />
• Automate troubleshooting procedures.<br />
• Automatically produce up-to-date network diagrams for<br />
regulatory compliance, faster troubleshooting, and engineering<br />
changes.<br />
OPNET Technologies, Inc. <strong>2011</strong> <strong>Annual</strong> <strong>Report</strong><br />
4<br />
application architectures, a single transaction can involve many<br />
tiers and require thousands of messages to traverse the network.<br />
AppTransaction Xpert makes extensive use of patented visualization<br />
and analytics to accelerate troubleshooting in production. In pre-<br />
deployment, AppTransaction Xpert is used proactively and is the<br />
industry-leading solution for application network readiness testing.<br />
AppSensor Xpert uses remote instrumentation interfaces<br />
exposed by many systems to enrich the data set used for APM ana-<br />
lytics. In addition, AppSensor Xpert is able to capture performance<br />
information from infrastructure components that may otherwise be<br />
difficult to monitor, including servers, application components, net-<br />
work devices, and vendor-specific management systems. AppSensor<br />
Xpert supplies this data to the rest of OPNET’s APM solution suite<br />
for a more complete picture of end-to-end application performance.<br />
AppTransaction Xpert Packet Trace Warehouse (formerly ACE<br />
Enterprise Management Server) delivers centralized control and stor-<br />
age for AppTransaction Xpert transaction data and packet capture<br />
agents.<br />
NETONE SOLUTIONS SUITE<br />
IT NetMapper® and SP NetMapper® automatically produce<br />
engineering-quality network diagrams, which are comprehensive,<br />
and up-to-date. NetMapper generates network documentation in<br />
the popular Microsoft Visio® format. The solution eliminates the bur-<br />
densome effort associated with manually representing the state of<br />
the network, thereby improving timeliness, accuracy, and usefulness<br />
of diagrams. NetMapper is the only solution on the market today<br />
capable of generating logical and physical diagrams with a level of<br />
detail and graphical quality that rivals diagrams network engineers<br />
create by hand. NetMapper takes diagramming one step further by<br />
leveraging OPNET’s rich repository of discovered network data to<br />
enhance diagrams with detailed configuration information.<br />
IT Sentinel® and SP Sentinel® ensure correct network operation,<br />
performance, resiliency, compliance, and security for enterprises<br />
and service providers. Sentinel performs automated, systematic,<br />
network-wide configuration audits of the production network,<br />
identifying errors and misconfigurations that can impact network<br />
availability, performance, and security. Sentinel detects unexposed<br />
problems, and proactively notifies staff of critical errors. Sentinel<br />
leverages OPNET’s rich repository of discovered network data,
including device configuration and connectivity, in order to provide<br />
the most advanced network auditing capability available today.<br />
For example, Sentinel is unique in its ability to verify configuration<br />
consistency across groups of devices, based on its understanding of<br />
network connectivity and inter-device relationships.<br />
OPNET nCompass® for Enterprises and OPNET nCompass® for<br />
Service Providers provide a unified, graphical visualization of large,<br />
heterogeneous production networks, including devices, their con-<br />
nectivity and status, and live traffic. nCompass unifies data from a<br />
wide range of network management systems, providing consolidat-<br />
ed views for more intuitive and productive navigation and analy-<br />
sis. nCompass’s geographical network dashboard is dynamically<br />
updated with real-time operational information. Third-party tools<br />
can be launched from its console for deeper drill-down and assisted<br />
troubleshooting.<br />
IT Guru® Network Planner automates analysis and planning of<br />
multi-layer, multi-vendor networks. Organizations can accurately<br />
plan for growth, consolidation, technology migration, and new ap-<br />
plication deployments, including Voice-Over-IP (VoIP), Virtual Private<br />
Networks (VPNs), and IPv6. Exclusive OPNET algorithms automati-<br />
Network R&D<br />
Network R&D organizations rely on OPNET software to boost pro-<br />
ductivity, improve product performance and quality, and accelerate<br />
time-to-market for fixed and wireless communication technologies.<br />
Key capabilities include the ability to:<br />
• Optimize proprietary wireless protocols and technologies.<br />
• Test and demonstrate technology designs in realistic scenarios<br />
before production.<br />
• Increase network R&D productivity and accelerate time-to-market.<br />
OPNET MODELER® SOLUTIONS SUITE<br />
OPNET Modeler® accelerates the R&D process for analyzing and<br />
designing communication networks, devices, protocols, and ap-<br />
plications. Users can analyze simulated networks to compare the<br />
impact of different technology designs on end-to-end behavior.<br />
Modeler incorporates a broad library of protocols and technologies,<br />
and includes a development environment to enable modeling of all<br />
network types and technologies.<br />
OPNET Technologies, Inc. <strong>2011</strong> <strong>Annual</strong> <strong>Report</strong><br />
5<br />
cally suggest optimizations for the network in terms of capacity<br />
and configuration to meet traffic growth projections, and achieve<br />
performance and survivability.<br />
SP Guru® Network Planner provides additional network plan-<br />
ning and design capabilities to meet the unique requirements of<br />
network service providers, enabling them to accelerate new service<br />
deployment and maximize return on network investments. SP Guru<br />
Network Planner automatically performs traffic engineering for Mul-<br />
tiProtocol Label Switching (MPLS) networks, and optimizes Quality<br />
of Service (QoS) for offerings such as VoIP.<br />
SP Guru®Transport Planner enables service providers and network<br />
equipment manufacturers to design resilient, cost effective opti-<br />
cal and SONET networks. It performs “what if” analyses for a wide<br />
variety of transport network architectures, technologies, and design<br />
scenarios, featuring unique multi-layer network presentation and<br />
optimization and design capabilities. SP Guru Transport Planner<br />
integrates with SP Guru Network Planner to provide a unique capa-<br />
bility for optimization of capacity and survivability that spans both<br />
the optical transport network and the IP/MPLS network.<br />
Modeler Wireless Suite provides high fidelity modeling, simula-<br />
tion, and analysis of a wide range of wireless networks. Technology<br />
developers leverage advanced simulation capabilities and rich<br />
protocol model suites to design and optimize proprietary wireless<br />
protocols, such as access control and scheduling algorithms. Simula-<br />
tions incorporate motion in mobile networks, including ground,<br />
airborne, and satellite systems. Modeler Wireless Suite supports<br />
any network with mobile devices, including cellular, mobile ad hoc<br />
networks, wireless LAN, and satellite.<br />
Modeler Wireless Suite for Defense supports the unique R&D<br />
requirements of the defense community, including research and<br />
development of network protocols and architectures crucial to Net-<br />
work-Centric Warfare implementations. Three-dimensional displays<br />
of network simulations incorporate topology, node relationships,<br />
and performance statistics, overlaid on realistically rendered terrain.<br />
Modeler Wireless Suite for Defense enables analysis and prediction<br />
of communications effects in the theater of operations. Interaction<br />
of simulated and real systems is also supported, using OPNET’s<br />
System In The Loop module.
OPNET Technologies, Inc. <strong>2011</strong> <strong>Annual</strong> <strong>Report</strong><br />
6
Financial StatementS<br />
OPNET Technologies, Inc. <strong>2011</strong> <strong>Annual</strong> <strong>Report</strong><br />
Table of ConTenTs<br />
8 Selected Consolidated Financial Data<br />
9 Management’s Discussion and Analysis of Financial Condition and Results of Operations<br />
25 Quantitative and Qualitative Dusclosures About Market Risk<br />
26 Management’s <strong>Report</strong> on Internal Control Over Financial <strong>Report</strong>ing<br />
27 <strong>Report</strong> of Independent Registered Public Accounting Firm<br />
28 <strong>Report</strong> of Independent Registered Public Accounting Firm<br />
29 Consolidated Balance Sheets<br />
30 Consolidated Statements of Operations<br />
31 Consolidated Statements of Changes in Stockholders’ Equity<br />
32 Consolidated Statements of Cash Flows<br />
33 Notes to Consolidated Financial Statements<br />
1
SelecteD cOnSOliDateD Financial Data<br />
OPNET Technologies, Inc. <strong>2011</strong> <strong>Annual</strong> <strong>Report</strong><br />
The following selected consolidated financial data should be read in conjunction with our consolidated financial statements and the related<br />
notes and ‘‘Management’s Discussion and Analysis of Financial Condition and Results of Operations’’ included elsewhere in this <strong>Annual</strong><br />
<strong>Report</strong>. The statement of operations data for the years ended March 31, <strong>2011</strong>, 2010, and 2009, and the balance sheet data as of March 31,<br />
<strong>2011</strong> and 2010, are derived from our audited consolidated financial statements included in this <strong>Annual</strong> <strong>Report</strong>. The balance sheet data as<br />
of March 31, 2009, 2008 and 2007 and the statement of operations data for the years ended March 31, 2008 and 2007 are derived from our<br />
consolidated financial statements that are not included in this <strong>Annual</strong> <strong>Report</strong>. Historical results are not necessarily indicative of results that<br />
may be expected for any future period.<br />
sTaTemenT of operaTions DaTa:<br />
Revenue:<br />
8<br />
Year Ended March 31,<br />
<strong>2011</strong> 2010 2009 2008 2007<br />
(in thousands, except per share data)<br />
Product $ 72,392 $ 52,252 $ 51,211 $ 38,838 $ 43,186<br />
Product updates, technical support and services 53,392 47,264 43,067 34,787 28,062<br />
Professional services 22,202 26,831 28,601 27,721 23,882<br />
Total revenue 147,986 126,347 122,879 101,346 95,130<br />
Cost of revenue:<br />
Product 9,293 5,983 3,536 1,035 638<br />
Product updates, technical support and services 5,260 4,859 4,665 4,514 3,264<br />
Professional services 16,183 19,328 20,911 19,154 15,904<br />
Amortization of acquired technology 2,050 1,835 2,172 1,486 723<br />
Total cost of revenue 32,786 32,005 31,284 26,189 20,529<br />
Gross profit 115,200 94,342 91,595 75,157 74,601<br />
Operating expenses:<br />
Research and development 34,718 32,043 30,791 27,471 21,688<br />
Sales and marketing 48,733 43,181 42,533 39,357 34,133<br />
General and administrative 12,947 11,011 11,857 11,747 10,994<br />
Total operating expenses 96,398 86,235 85,181 78,575 66,815<br />
Income (loss) from operations 18,802 8,107 6,414 (3,418) 7,786<br />
Interest and other (expense) income, net (151) (70) 1,246 3,579 3,834<br />
Income before provision for income taxes 18,651 8,037 7,660 161 11,620<br />
Provision (benefit) for income taxes 6,250 2,214 2,928 (372) 3,655<br />
Net income $ 12,401 $ 5,823 $ 4,732 $ 533 $ 7,965<br />
Basic net income per common share $ 0.57 $ 0.28 $ 0.23 $ 0.03 $ 0.39<br />
Diluted net income per common share $ 0.55 $ 0.28 $ 0.23 $ 0.03 $ 0.37<br />
Basic weighted average shares outstanding 21,429 20,529 20,296 20,342 20,357<br />
Diluted weighted average shares outstanding 22,130 20,790 20,533 20,596 21,189<br />
balanCe sheeT DaTa (enD of perioD):<br />
Cash, cash equivalents and marketable securities $114,728 $ 104,681 $ 91,989 $ 85,829 $ 91,381<br />
Total assets $191,823 $ 178,352 $ 166,064 $ 153,538 $ 147,658<br />
Dividends declared per common share (a) $1.15 $ 0.36 $ — $ — $ —<br />
Total stockholders’ equity $124,823 $ 118,676 $ 116,505 $ 110,645 $ 112,871<br />
(a) Includes special dividend of $0.75 per share in fiscal <strong>2011</strong>.
OPNET Technologies, Inc. <strong>2011</strong> <strong>Annual</strong> <strong>Report</strong><br />
manaGement’S DiScUSSiOn anD analYSiS OF Financial cOnDitiOn<br />
anD ReSUltS OF OPeRatiOnS<br />
You should read the following discussion and analysis in conjunction with our consolidated financial statements and the related notes<br />
included elsewhere in this <strong>Annual</strong> <strong>Report</strong> on Form 10-K. This discussion and analysis contains forward-looking statements that involve risks,<br />
uncertainties, and assumptions. Our actual results may differ materially from those anticipated in these forward-looking statements as a<br />
result of certain factors, including, but not limited to, those set forth under ‘‘Item 1A. Risk Factors’’ and elsewhere in this <strong>Annual</strong> <strong>Report</strong> on<br />
Form 10-K.<br />
Overview<br />
OPNET Technologies, Inc. is a provider of application and network performance management, or APM, solutions. Our software products<br />
address application performance management, network operations, capacity management, and network research and development. Our<br />
customers include corporate enterprises, government and defense agencies, network service providers, and network equipment manufacturers.<br />
Our software products and related services are designed to help our customers make better use of resources, reduce operational<br />
problems and improve competitiveness.<br />
We operate in one reportable industry segment, the development and sale of computer software products and related services. Our operations<br />
are principally in the United States, and we have subsidiaries in Belgium, France, Germany, the United Kingdom and Singapore. We<br />
primarily depend upon our direct sales force to generate revenue in the United States. Sales outside the United States are made through<br />
our international sales team as well as third-party distributors and value-added resellers, who generally are responsible for providing technical<br />
support and service to customers within their territory.<br />
Our revenue is derived from three primary sources: (1) product, (2) product updates, technical support and services, and (3) professional services,<br />
which include consulting and training services for customers without current maintenance agreements. Product revenue represents<br />
all fees earned from granting customers licenses to use our software and fees associated with hardware necessary to run our software, and<br />
excludes revenue derived from product updates, which are included in product updates, technical support, and services revenue. Our software<br />
master license agreement provides our customers with the right to use our software either perpetually, which we refer to as perpetual<br />
licenses, or during a defined term, generally for one to four years, which we refer to as term licenses. For the years ended March 31, <strong>2011</strong>,<br />
2010, and 2009, perpetual licenses represented approximately 91%, 92%, and 93% of product revenue, respectively. Substantially all of our<br />
product arrangements include both product licenses and product updates, technical support, and services. Product updates, technical<br />
support, and services revenue represent fees associated with the sale of unspecified product updates, technical support and when-and-if<br />
available training under our maintenance agreements. We offer professional services, under both time-and-material and fixed-price agreements,<br />
primarily to facilitate the adoption of our software products.<br />
We consider our consulting services to be an integral part of our business model as they are centered on our software product offerings.<br />
Because our consulting services facilitate the adoption of our software product offerings, we believe that they ultimately generate additional<br />
sales of product licenses.<br />
The key strategies of our business plan include increasing sales to existing customers, increasing deal size by selling modules and introducing<br />
new software products, improving our sales and marketing execution, establishing alliances to extend our market reach, increasing our<br />
international presence and increasing profitability. We have focused our sales, marketing, and other efforts on corporate enterprise and<br />
United States government opportunities, and to a much lesser extent, service provider and network equipment manufacturer opportunities.<br />
Our focus and strategies are designed to increase revenue and profitability. Because of the uncertainty surrounding the amount and<br />
timing of revenue growth, we expect to need to closely control the increases in our total expenses as we implement these strategies.<br />
In March 2008, we launched an initiative to extend our market reach by establishing sales alliances with third parties called the Synergy program.<br />
The Synergy program is designed to increase the penetration of our software products, particularly into mid-sized organizations. The<br />
Synergy program’s primary focus is on selling our application performance management software products, including AppResponse Xpert<br />
that provides end-user experience monitoring and real-time application performance analytics, as we believe these software products are<br />
particularly well-suited for indirect channel distribution. As of March 31, <strong>2011</strong>, there were 139 third parties participating in our Synergy<br />
program.<br />
9
summary of our fisCal <strong>2011</strong> finanCial performanCe<br />
OPNET Technologies, Inc. <strong>2011</strong> <strong>Annual</strong> <strong>Report</strong><br />
During fiscal <strong>2011</strong>, as compared to fiscal 2010, we generated growth in total revenue and expanded our income from operations and net<br />
income. The increase in total revenue was primarily the result of growth in sales of our APM products to corporate enterprise customers. We<br />
believe the increase in sales of our APM products is the result of competitive advantages offered by our products and increased sales efforts<br />
on our part, together with loosening customer budgets and more normal purchasing patterns as compared to fiscal 2010.<br />
During fiscal <strong>2011</strong>, as compared to fiscal 2010, we also generated an increase in deferred revenue and cash flows from operations. The<br />
increase in deferred revenue was largely the result of growth in the sale of new maintenance contracts. The increase in cash flows from<br />
operations was primarily the result of growth in sales of our products and maintenance contracts together with strong collections activity<br />
during fiscal <strong>2011</strong>.<br />
The following table summarizes information on some of our key financial and operating metrics.<br />
finanCial DaTa:<br />
10<br />
Fiscal Fiscal Amount Percentage<br />
<strong>2011</strong> 2010 Change Change<br />
(dollars in thousands, except per share data)<br />
Total revenue $ 147,986 $ 126,347 $ 21,639 17.1%<br />
Total cost of revenue $ 32,786 $ 32,005 $ 781 2.4%<br />
Gross profit $ 115,200 $ 94,342 $ 20,858 22.1%<br />
Gross profit as a percentage of total revenue (gross margin) 77.8% 74.7%<br />
Total operating expenses $ 96,398 $ 86,235 $ 10,163 11.8%<br />
Income from operations $ 18,802 $ 8,107 $ 10,695 131.9%<br />
Income from operations as a percentage of total revenue (operating margin) 12.7% 6.4%<br />
Net income $ 12,401 $ 5,823 $ 6,578 113.0%<br />
Diluted net income per common share $ 0.55 $ 0.28 $ 0.27 96.4%<br />
oTher operaTions DaTa:<br />
Total employees (period end) 578 582 (4) (0.7)%<br />
Total average employees 567 580 (13) (2.2)%<br />
Total consultants (period end) 86 100 (14) (14.0)%<br />
Total period end quota-carrying sales persons<br />
(excluding directors and inside sales representatives) 73 72 1 1.4%<br />
finanCial ConDiTion anD liquiDiTy DaTa:<br />
Cash, cash equivalents, and marketable securities (period end) $ 114,728 $ 104,681 $ 10,047 9.6%<br />
Cash flows from operating activities $ 26,675 $ 21,777 $ 4,898 22.5%<br />
Total deferred revenue (period end) $ 47,497 $ 43,371 $ 4,126 9.5%<br />
We achieved growth in product revenue and product updates,<br />
technical support and services revenue, offset by a decrease in<br />
professional services revenue during fiscal <strong>2011</strong>, as compared to<br />
fiscal 2010. Product revenue increased by $20.1 million, or 38.5%,<br />
and product updates, technical support and services revenue<br />
increased by $6.1 million, or 13.0%, which was partially offset by a<br />
decrease in professional services revenue of $4.6 million, or 17.3%.<br />
The increase in product revenue was the result of growth in sales<br />
to corporate enterprise customers. The increase in revenue from<br />
product updates, technical support and services revenue reflects<br />
growth in the overall customer installed base. Increases in the overall<br />
customer installed base increase the demand for annual renewals<br />
of maintenance contracts. The sequential decrease in revenue from<br />
professional services was largely the result of a decrease in billable<br />
hours worked on projects for United States government customers.<br />
We believe the decrease in billable hours worked on projects for<br />
United States government customers was primarily related to budget<br />
constraints. We believe the sequential decrease in revenue from<br />
professional services is also due to an increase in the proportion<br />
of sales of our APM products as compared to our other products,
as our APM products generally require less consulting services to<br />
implement. Total revenue generated from sales to United States<br />
government customers decreased by $2.2 million during fiscal <strong>2011</strong><br />
as compared to fiscal 2010. The percentage of total revenue from<br />
United States government customers decreased to 32.5% in fiscal<br />
<strong>2011</strong> from 39.9% in fiscal 2010. We believe the decrease in revenue<br />
from United States government customers was due to budget<br />
constraints experienced by United States government customers<br />
during fiscal <strong>2011</strong>.<br />
Our international revenue increased 35% to $38.3 million, or 25.9%<br />
of total revenue, for fiscal <strong>2011</strong>. We expect revenue from sales<br />
outside the United States to continue to account for a significant<br />
portion of our total revenue in the future. The increase in international<br />
revenue was primarily the result of growth in sales of our APM<br />
products to corporate enterprise. International revenue in fiscal<br />
<strong>2011</strong> also benefited from a more experienced direct sales force, an<br />
increased number of VARs, and our increased focus on sales to corporate<br />
enterprises. Sales to corporate enterprises accounted for the<br />
largest portion of our international revenue during fiscal <strong>2011</strong>. We<br />
believe that continued growth and profitability will require further<br />
expansion of our sales, marketing and customer service functions in<br />
international markets.<br />
During fiscal <strong>2011</strong>, gross profit increased 22.1% to $115.2 million.<br />
Our gross margin increased to 77.8% for fiscal <strong>2011</strong> from 74.7% in<br />
fiscal 2010. The increase in our gross profit and gross margin was<br />
primarily due to an increase in product revenue of $20.1 million<br />
in fiscal <strong>2011</strong> and an increase in our product updates, technical<br />
support and services revenue of $6.1 million during fiscal <strong>2011</strong> as<br />
compared to fiscal 2010, as our gross margin on product revenue<br />
and product updates, technical support and services revenue during<br />
fiscal <strong>2011</strong> was 87.2% and 90.2%, respectively.<br />
During fiscal <strong>2011</strong>, operating income increased to $18.8 million<br />
from $8.1 million during fiscal 2010. The increase in operating<br />
income was largely the result of an increase in revenue of 17.1%,<br />
while holding our operating expense increase to 11.8%.<br />
TrenDs ThaT may affeCT our business anD fuTure resulTs<br />
We anticipate the following trends and patterns over the next<br />
several quarters:<br />
ToTal Revenue. We believe the current economic environment<br />
is showing signs of improvement, but our ability to generate<br />
increased revenue domestically and internationally will depend<br />
largely upon continued improvement in economic conditions.<br />
We expect future growth opportunities in product revenue and<br />
product updates, technical support and services revenue to come<br />
from sales to corporate enterprise customers and the United States<br />
government, as we believe our products offer competitive advantages<br />
in these markets. Our ability to generate increased revenue<br />
OPNET Technologies, Inc. <strong>2011</strong> <strong>Annual</strong> <strong>Report</strong><br />
11<br />
from United States government customers will be impacted by the<br />
length and severity of budget constraints. We expect product revenue<br />
and product updates, technical support and services revenue<br />
from sales to service providers and network equipment manufacturers<br />
to fluctuate from quarter to quarter with the potential for<br />
periods of declining revenue. Our ability to increase professional<br />
services revenue will depend in part on our ability to attract and<br />
retain additional qualified consultants, including those with security<br />
clearances. We believe that continued increases in the proportion<br />
of sales of our APM products, as compared to our other products,<br />
would cause the percentage of our total revenue attributable to<br />
professional services revenue to decline and might also cause an<br />
absolute decline in professional services revenue because our APM<br />
products generally require less consulting time to implement. As<br />
a result of these factors, we believe that we will likely experience<br />
fluctuations in quarterly revenue.<br />
GRoss PRofIT MaRGIn. Our overall gross profit margin will continue<br />
to be affected by the percentage of total revenue generated from<br />
product revenue and product updates, technical support and<br />
services revenue, as revenue from these sources have substantially<br />
higher gross margins than the gross margin on revenue from professional<br />
services. Our overall gross profit margin will also be affected<br />
by the profitability of individual consulting engagements. Amortization<br />
of technology associated with the purchase and/or acquisition<br />
of technology we may make in future periods may also affect<br />
our gross profit margin.<br />
ReseaRch and develoPMenT exPense. We believe that continued<br />
investment in research and development will be required<br />
to maintain our competitive position and broaden our software<br />
product lines, as well as enhance the features and functionality of<br />
our current software products, especially our APM products. We<br />
believe there is more competition in the markets served by our APM<br />
products as compared to the markets for our other products. We<br />
made personnel investments in research and development during<br />
fiscal 2010 and <strong>2011</strong>, and we plan to continue making investments<br />
in additional personnel during the next several quarters. We expect<br />
that the absolute dollar amount of these expenses will grow but<br />
generally decrease as a percentage of total revenue in future periods.<br />
Our ability to decrease this expense as a percentage of revenue<br />
will depend upon increases in our revenue, among other factors.<br />
sales and MaRkeTInG exPense. We depend upon our direct sales<br />
model to generate revenue and believe that increasing the size of<br />
our quota-carrying sales team is essential for long-term growth.<br />
During fiscal <strong>2011</strong>, we focused on improving the productivity of our<br />
existing sales force and only made modest investments in additional<br />
direct sales personnel. We plan to accelerate our hiring of quotacarrying<br />
salespeople as compared to fiscal <strong>2011</strong> in order to address<br />
what we believe is a large and growing market for our products. We<br />
also plan to increase expenditures in areas we believe will enhance
the visibility of our products in the marketplace, especially our APM<br />
products. While we expect that the absolute dollar amount of sales<br />
and marketing expense will increase in fiscal 2012 as compared<br />
to fiscal <strong>2011</strong>, our ability to lower this expense as a percentage of<br />
revenue will depend upon increases in our revenue.<br />
GeneRal and adMInIsTRaTIve exPense. We expect the dollar<br />
amount of general and administrative expenses to increase as we<br />
continue to expand our operations but generally decrease as a percentage<br />
of total revenue in future periods. Our ability to decrease<br />
this expense as a percentage of revenue will depend upon increases<br />
in our revenue, among other factors.<br />
oPeRaTInG MaRGIn. Since a significant portion of our product<br />
arrangements close in the latter part of each quarter, we may not<br />
be able to adjust our cost structure in the short-term to respond to<br />
lower than expected revenue, which would adversely impact our<br />
operating margin and earnings. Our operating margin increased to<br />
12.7% during fiscal <strong>2011</strong> from 6.4% during fiscal 2010. We remain<br />
committed to increasing profitability and generating long-term<br />
growth. As the economy improves, we plan to strategically increase<br />
research and development and marketing expenditures in order to<br />
maintain our products’ competitive advantages and increase market<br />
share. While we intend to strategically increase expenditures in certain<br />
areas, we intend to closely monitor and control overall operating<br />
expense in order to maximize our operating margin.<br />
CriTiCal aCCounTing poliCies anD use of esTimaTes<br />
The accompanying discussion and analysis of our financial condition<br />
and results of operations are based upon our audited consolidated<br />
financial statements, which have been prepared in accordance with<br />
accounting principles generally accepted in the United States of<br />
America, or GAAP. The preparation of these financial statements<br />
requires that we make estimates and judgments that affect the<br />
reported amounts of assets, liabilities, revenue and expenses, and<br />
related disclosure of contingent assets and liabilities. We base our<br />
estimates on historical experience and on various other assumptions<br />
that we believe to be reasonable under the circumstances,<br />
the results of which form the basis for making judgments about the<br />
carrying values of assets and liabilities that are not readily apparent<br />
from other sources. Actual results could differ from the estimates<br />
made by management with respect to these and other items that<br />
require management’s estimates.<br />
We have identified the accounting policies that are critical to<br />
understanding our historical and future performance, as these<br />
policies affect the reported amounts of revenue and the more<br />
significant areas involving management’s judgments and estimates.<br />
These critical accounting policies relate to revenue recognition and<br />
deferred revenue, stock based compensation, allowance for doubtful<br />
accounts, valuation of long-lived assets, including intangible<br />
assets and impairment review of goodwill, software development<br />
OPNET Technologies, Inc. <strong>2011</strong> <strong>Annual</strong> <strong>Report</strong><br />
12<br />
costs, and income taxes. These policies, and our procedures related<br />
to these policies, are described in detail below. In addition, please<br />
refer to Note 1 to our consolidated financial statements included<br />
elsewhere in this <strong>Annual</strong> <strong>Report</strong> on Form 10-K for further discussion<br />
of our accounting policies.<br />
Revenue Recognition. We derive revenue from three primary sources:<br />
(1) products, (2) product updates, technical support and services,<br />
which include product updates, certain training provided and<br />
offered on a when-and-if available basis to customers, and technical<br />
support, and (3) professional services, which include consulting and<br />
custom training services for customers without a current maintenance<br />
agreement. We recognize revenue based on the provisions of<br />
Accounting Standards Codification 605-985 Revenue Recognition<br />
- Software, or ASC 605-985.<br />
Product Revenue<br />
Product revenue represents all fees earned from granting customers<br />
perpetual and term licenses to use our software as well as the<br />
hardware that we use to deliver our AppResponse Xpert software<br />
products. It excludes revenue derived from product updates, which<br />
is included in product updates, technical support and services<br />
revenue. For the years ended March 31, <strong>2011</strong>, 2010, and 2009,<br />
perpetual licenses represented approximately 91%, 92%, and 93%<br />
of product revenue, respectively. Product revenue is recognized<br />
when the following four criteria are met: (i) persuasive evidence<br />
of an arrangement exists, (ii) delivery of the product has occurred,<br />
(iii) the product fee is fixed or determinable, and (iv) collectibility is<br />
probable. We analyze each of these four criteria as follows:<br />
• Persuasive evidence of an arrangement exists. For license arrangements<br />
with end-users, it is our customary practice to have<br />
a written software license agreement, which is signed by both<br />
the end user and us, and a purchase order or equivalent. A written<br />
contract can be executed based on the customer-specific<br />
format or on the standard “shrink wrap” software master license<br />
agreement. For those end users who have previously negotiated<br />
a software license agreement with us, the initial software<br />
license agreement is used as evidence of a written contract.<br />
Sales to distributors, resellers, and value-added resellers, which<br />
we collectively refer to as resellers, are evidenced by a master<br />
reseller agreement governing the relationship, which is signed<br />
by both the reseller and us, together with a purchase order<br />
on a transaction-by-transaction basis. To further evidence an<br />
arrangement, our master reseller agreement requires that the<br />
reseller provide us copies of the end user’s executed software<br />
master license agreements.<br />
• Delivery has occurred. Physical delivery of our software products<br />
to end users or resellers, which are collectively referred to<br />
as customers, is generally considered to have occurred upon<br />
the transfer of media containing our software products to a
common carrier, usually FOB shipping point based on standard<br />
agreement terms. Software licenses may also be delivered<br />
electronically to end users. Electronic delivery is deemed to occur<br />
after end users have been provided with access codes that<br />
allow them to take immediate possession of the software. If a<br />
software arrangement includes undelivered software products<br />
or services that are essential to the functionality of delivered<br />
software products, delivery is not considered to have occurred<br />
until these software products or services are delivered.<br />
• The fee is fixed or determinable. It is our policy to not provide<br />
customers the right to any adjustments or refund of any portion<br />
of their license fees paid, acceptance provisions, cancellation<br />
privileges, or rights of return. Our normal payment terms for<br />
our software products and services currently range from net<br />
30 days to net 90 days and primarily vary based on the country<br />
in which an agreement is executed. Payments that extend<br />
beyond our normal payment terms from the contract date but<br />
that are due within six months are generally deemed to be fixed<br />
or determinable based on our successful collection history on<br />
such arrangements, and thereby satisfy the required criteria<br />
for revenue recognition. Arrangements with payment terms<br />
extending beyond six months are considered not to be fixed or<br />
determinable, and revenue from such arrangements is recognized<br />
as payments become due and payable.<br />
• Collectibility is probable. Collectibility is assessed on a customer-by-customer<br />
basis. We typically sell to customers for whom<br />
there is a history of successful collection. New customers are<br />
subject to a credit review process that evaluates the customer’s<br />
ability to pay. If we determine from the outset of an arrangement<br />
that collectibility is not probable, revenue is recognized as<br />
cash is collected.<br />
In instances when any of the four criteria are not met, we defer<br />
recognition of product revenue until the criteria are met. When<br />
the sale of the software product requires us to make significant<br />
enhancements, customization or modifications to the software that<br />
are essential to its functionality, product revenue and consulting<br />
fees are recognized using contract accounting under ASC 605-35,<br />
Revenue Recognition – Construction-Type and Production. We estimate<br />
the percentage-of-completion, under ASC 605-35, based on<br />
our estimate of total hours to complete the project as a percentage<br />
of total hours incurred and the estimated hours to complete.<br />
The process of estimation inherent in the application of the percentage-of-completion<br />
method of accounting for revenue is subject<br />
to judgments and uncertainties and may affect the amounts of<br />
product revenue and professional services revenue under certain<br />
contracts and related expenses reported in our consolidated financial<br />
statements. A number of internal and external factors can affect<br />
our estimates to complete client engagements, including skill level<br />
OPNET Technologies, Inc. <strong>2011</strong> <strong>Annual</strong> <strong>Report</strong><br />
13<br />
and experience of project managers, staff assigned to engagements<br />
and continuity and attrition level of professional services staff.<br />
Changes in the estimated stage of completion of a particular project<br />
could create variability in our revenue and results of operations if we<br />
are required to increase or decrease previously recognized revenue<br />
related to a particular project or if we expect to incur a loss on the<br />
project.<br />
All fees billed to clients for shipping and handling are classified as<br />
product revenue. All costs associated with shipping and handling<br />
are classified as cost of product revenue.<br />
Product Updates, Technical Support and Services Revenue<br />
Product updates, technical support and services revenue represents<br />
fees associated with the sale of product updates, training,<br />
and technical support, all except technical support provided on a<br />
when-and-if-available basis under our maintenance agreement.<br />
Payments for product updates, technical support and services on<br />
initial order or on renewal are generally made in advance and are<br />
nonrefundable. Product updates consist of the right to unspecified<br />
software updates on a when-and-if-available basis and are typically<br />
entered into in connection with the initial product purchase.<br />
Product updates, technical support and services may be renewed<br />
upon expiration of the term. Customers can purchase product updates<br />
separately from technical support and services. Revenue from<br />
product updates, technical support and services is deferred and<br />
recognized as revenue on a straight-line basis over the term of the<br />
maintenance agreement.<br />
We allocate revenue under multiple-element arrangements, which<br />
typically include product, consulting services, training and maintenance<br />
agreements sold together, to each element in the arrangement<br />
primarily using the residual method based upon the fair value<br />
of the undelivered elements, which is specific to our vendor-specific<br />
objective evidence of fair value, or VSOE. This means that we defer<br />
revenue from the arrangement fee equivalent to the fair value of the<br />
undelivered elements. We apply discounts, if any, to the delivered<br />
elements, usually product, under the residual method. For periodic<br />
unspecified product updates and technical support agreements,<br />
VSOE is based upon either the renewal rate specified in each<br />
contract or the price charged when sold separately. For consulting<br />
services and training for customers without a current maintenance<br />
agreement, VSOE is based upon the rates charged for these services<br />
when sold separately.<br />
If we are unable to establish VSOE for an undelivered post contract<br />
support, or PCS, element, for example, in a two-year term license<br />
where the license term and PCS are coterminous and no PCS renewal<br />
period exists, all revenue is recognized ratably over the contract<br />
period. For income statement classification purposes, our allocation<br />
methodology is based on VSOE of fair value for our professional<br />
services which is determined by the price charged when sold
OPNET Technologies, Inc. <strong>2011</strong> <strong>Annual</strong> <strong>Report</strong><br />
separately, and the contractually stated renewal rates for our PCS, Sales taxes and other taxes collected from customers and remitted<br />
generally 18% to 21% of the license fee paid on perpetual licenses. to governmental authorities are presented on a net basis and, as<br />
We use the residual method to allocate any remaining arrangement such, are excluded from revenues.<br />
fee to product revenue.<br />
IncoMe Taxes. We account for income taxes in accordance with<br />
Professional Services Revenue<br />
ASC 740, Income Taxes. The income tax provision includes income<br />
Professional services revenue consists of fees from consulting services<br />
and training for customers without a current maintenance agreement<br />
and is recognized as the services are performed. When we enter into<br />
consulting service arrangements that include significant modifications<br />
to the software that are essential to the customer’s use and the arrangement<br />
is bundled with software, we recognize revenue under the entire<br />
arrangement under the percentage-of-completion method. For income<br />
statement classification purposes, we have developed a revenue<br />
taxes currently payable plus the net change during the year in deferred<br />
tax assets or liabilities. Under ASC 740, deferred tax assets and<br />
liabilities reflect the differences between the carrying value under<br />
GAAP and the tax basis of assets and liabilities using enacted statutory<br />
tax rates in effect for the period in which the differences are<br />
expected to reverse. Judgments and estimates are required in the<br />
calculation of the deferred tax assets, valuation allowance, research<br />
and development tax credits, and foreign tax credits.<br />
allocation methodology for these arrangements that is consistent with ASC 740 prescribes a recognition threshold of more-likely-than-<br />
the residual method used, and described under ASC 605-985, when not, and a measurement attribute for all tax positions taken or<br />
services are not essential to the functionality of the software. In these expected to be taken on a tax return, in order for these positions to<br />
circumstances, we allocate revenue to the various elements of the ar- be recognized in the financial statements. We continually review<br />
rangement based on our VSOE of fair value and the residual amount is tax laws, regulations and guidance in order to properly record any<br />
allocated to product revenue.<br />
uncertain tax positions. At March 31, <strong>2011</strong>, the gross unrecognized<br />
We sell product, product updates, technical support and services<br />
agreements to distributors at predetermined prices. Sales to distributors<br />
are not contingent upon resale of the software to the end user.<br />
In most cases, we provide product updates, technical support and<br />
services agreements directly to distributors and the distributors provide<br />
support to the end customer. We record revenue from sales to distributors<br />
at the amounts charged to the distributor and in the same manner<br />
as product, product updates, technical support and services sales sold<br />
through our direct sales force. We classify amounts received in advance<br />
of revenue recognition as deferred revenue.<br />
benefit related to uncertain tax benefits was $691,000, $669,000 of<br />
which would favorably affect the effective income tax rate in future<br />
periods. The total amount of gross unrecognized tax benefits related<br />
to uncertain tax positions as of April 1, 2010 was $786,000. Of this<br />
total, $761,000 represents the amount of unrecognized tax benefits,<br />
net of federal benefit on state issues that, if recognized, would favorably<br />
affect the effective income tax rate in any future periods. A<br />
reconciliation of the beginning and ending amount of unrecognized<br />
tax benefits for fiscal <strong>2011</strong>, 2010, and 2009 follows:<br />
<strong>2011</strong> 2010<br />
(in thousands)<br />
2009<br />
Beginning balance $ 786 $ 804 $ 838<br />
Gross decreases – prior period tax positions — 45 —<br />
Gross increases – current period tax positions 154 150 139<br />
Gross increase – prior period tax postions 60 — —<br />
Settlements (106) (19) —<br />
Lapse of statute of limitations (203) (197) (159)<br />
Foreign currency translation adjustment — 3 (14)<br />
Ending balance $ 691 $ 786 $ 804<br />
14
The following table summarizes the tax years that are either cur-<br />
rently under audit or remain open under the statute of limitations<br />
and are subject to examination by the tax authorities in the most<br />
significant jurisdictions that we operate:<br />
Australia FY08 – FY09<br />
Belgium FY08 – FY10<br />
France FY07 – FY10<br />
Germany FY05 – FY09<br />
Singapore FY08 - FY10<br />
United Kingdom FY10<br />
United States FY08 – FY10<br />
Maryland FY07 – FY10<br />
We are currently under an income tax audit in Germany for fiscal<br />
years 2005 through 2007.<br />
Our continuing practice is to recognize interest, if any, related to<br />
income tax matters in interest expense in our consolidated statements<br />
of operations and penalties as part of general and administrative<br />
expense in our consolidated statements of operations.<br />
During fiscal <strong>2011</strong>, we recognized $9,000 in potential interest<br />
expense associated with uncertain tax positions. During fiscal 2010,<br />
we recognized $6,000 in potential interest expense associated with<br />
uncertain tax positions and reversed $13,000 associated with potential<br />
claims barred by the statute of limitations. The total accrued<br />
interest and accrued penalties related to uncertain tax positions at<br />
March 31, <strong>2011</strong> was $17,000 and $107,000, respectively.<br />
We believe it is reasonably possible that changes in the liability for<br />
uncertain tax positions will occur in the next twelve months as a result<br />
of final decisions related to the voluntary payments of our state<br />
and local income taxes. In the aggregate, we believe the liability<br />
for uncertain tax positions could decrease by $30,000 in the next<br />
twelve months.<br />
Stock-Based Compensation. ASC 718 Compensation – Stock<br />
Compensation requires an entity to recognize an expense within<br />
its income statement for all share-based payment arrangements,<br />
which include employee stock option plans, restricted stock grants,<br />
and employee stock purchase plans. We have elected to use<br />
straight-line amortization of stock-based compensation expense<br />
for the entire award over the service period since the awards have<br />
only service conditions and graded vesting. Our stock options and<br />
nonvested stock do not contain performance conditions. There<br />
have been no modifications to awards in <strong>2011</strong> or 2010.<br />
Our stock option grants are accounted for as equity awards. The expense<br />
is based on the grant-date fair value of the options granted,<br />
which we recognize over the requisite service period.<br />
To estimate the grant-date fair value of our stock options, we use<br />
the Black-Scholes option-pricing model. The Black-Scholes model<br />
estimates the per share fair value of an option on its date of grant<br />
OPNET Technologies, Inc. <strong>2011</strong> <strong>Annual</strong> <strong>Report</strong><br />
15<br />
based on the following: the option’s exercise price; the price of<br />
the underlying stock on the date of grant; the estimated dividend<br />
yield; a “risk-free” interest rate; the estimated option term; and the<br />
expected volatility. For the “risk-free” interest rate, we use a U.S.<br />
Treasury bond due in a number of years equal to the option’s expected<br />
term. To estimate expected volatility, we analyze the historic<br />
volatility of our common stock. We did not grant any stock options<br />
during fiscal <strong>2011</strong>. As of March 31, <strong>2011</strong>, nonvested stock-based<br />
deferred compensation associated with the stock options totaled<br />
$710,000, which we expect to recognize over a weighted average<br />
period of 2 years.<br />
We recognize compensation cost for stock option grants on a<br />
straight-line basis over the requisite service period for the entire<br />
award from the date of grant through the period of the last separately<br />
vesting portion of the grant. We recognize compensation<br />
cost within the income statement in the same expense line as the<br />
cash compensation paid to the respective employees. ASC 718 also<br />
requires us to estimate forfeitures in calculating the expense related<br />
to stock-based compensation. We have concluded that our historical<br />
forfeiture rate is the best measure to estimate future forfeitures<br />
of granted stock options. We will recognize the impact on compensation<br />
cost due to changes in the expected forfeiture rate of 10% in<br />
the period that they become known. We do not apply a forfeiture<br />
rate to the options granted to certain key executives or directors.<br />
We have concluded that historically certain key executives and<br />
directors will perform the requisite service to vest in the award.<br />
We account for our restricted stock grants as equity awards. The<br />
expense is based on the price of our common stock, and is recognized<br />
on a straight-line basis over the requisite service period.<br />
The restricted stock agreements do not contain any post-vesting<br />
restrictions. We have concluded that our historical forfeiture rate is<br />
the best measure to estimate future forfeitures of granted restricted<br />
stock. We will recognize the impact on compensation cost due<br />
to changes in the expected forfeiture rate of 10% in the period<br />
that they become known. We do not apply a forfeiture rate to the<br />
restricted stock granted to certain key executives or directors. As of<br />
March 31, <strong>2011</strong>, nonvested stock-based deferred compensation associated<br />
with restricted stock totaled $2.3 million, which we expect<br />
to recognize over a weighted average period of 1 year.<br />
Our 2000 Employee Stock Purchase Plan, or ESPP, provides all<br />
eligible employees to collectively purchase up to a total of 3,070,000<br />
shares of our common stock. On September 14, 2009, our stockholders<br />
voted to increase the number of shares authorized for<br />
issuance under the ESPP from 820,000 shares to 3,070,000 shares,<br />
effective February 1, 2010. An employee may authorize a payroll<br />
deduction up to a maximum of 10% of his or her compensation during<br />
the plan period. The purchase price for each share purchased is<br />
the lesser of 85% of the closing price of the common stock on the<br />
first or last day of the plan period. The plan period for the ESPP ends
on the last day of January and July of each year. To estimate the<br />
fair value of shares issued under our ESPP, we use the Black-Scholes<br />
option-pricing model. The Black-Scholes model estimates the per<br />
share fair value of an ESPP share at the beginning of the plan period<br />
based on the following: the price of the underlying stock on the<br />
first day of the plan period; the estimated dividend yield; a “risk-free”<br />
interest rate; the term of the plan period, which is six months; and<br />
the expected volatility. For the “risk-free” interest rate, we use a U.S.<br />
Treasury Bond due in six months. To determine expected volatility,<br />
we analyze the historical volatility of our stock over the 6 months<br />
prior to the first day of the plan period. We calculate the expense<br />
based on the difference between the fair market value of the shares<br />
purchased at the close of each plan period and the discounted price<br />
paid by the employee, and we recognize that expense on a straightline<br />
basis over the plan period. As of March 31, <strong>2011</strong>, nonvested<br />
stock-based deferred compensation associated with the ESPP<br />
totaled $197,000, which we expect to recognize over a weighted<br />
average period of 4 months.<br />
Cash, Cash Equivalents, and Marketable Securities. We measure<br />
our cash and cash equivalents using the fair value measurement<br />
principles of ASC 820 Fair Value Measurements and Disclosures, or<br />
ASC 820, which requires that fair value be based on the assumptions<br />
that market participants would use when pricing an asset or liability.<br />
OPNET Technologies, Inc. <strong>2011</strong> <strong>Annual</strong> <strong>Report</strong><br />
16<br />
ASC 820 requires disclosures regarding the manner in which fair<br />
value is determined for assets and liabilities and establishes a threetiered<br />
value hierarchy into which these assets and liabilities must be<br />
grouped, based upon significant levels of inputs as follows:<br />
• Level 1 – Quoted prices (unadjusted) in active markets for identical<br />
assets or liabilities.<br />
• Level 2 – Observable inputs, other than Level 1 prices, such as<br />
quoted prices in active markets for similar assets and<br />
liabilities in markets that are not active, or other inputs that are<br />
observable or can be corroborated by observable inputs<br />
• Level 3 – Unobservable inputs that are supported by little or no<br />
market activity and that are significant to the fair value of the<br />
assets or liabilities. This includes certain pricing models, discounted<br />
cash flow methodologies and similar techniques that<br />
use significant unobservable inputs.<br />
The lowest level of significant input determines the placement of<br />
the entire fair value measurement in the hierarchy. We view corporate<br />
notes as Level 2 assets, and money market funds as Level 1<br />
assets. We did not hold any marketable securities at March 31, 2010.<br />
The following table summarizes the composition of our marketable<br />
securities at March 31, <strong>2011</strong>:<br />
March 31, <strong>2011</strong><br />
(in thousands)<br />
Classification on Balance Sheet<br />
Gross Gross<br />
Amortized Unrealized Unrealized Market Short-Term Long-Term<br />
Cost Gain Loss Value Investments Investments<br />
United States government obligations $ 31,428 $ 4 $ — $ 31,432 $ 31,432 $ —<br />
Total marketable securities $ 31,428 $ 4 $ — $ 31,432 $ 31,432 $ —
OPNET Technologies, Inc. <strong>2011</strong> <strong>Annual</strong> <strong>Report</strong><br />
The following table details the fair value measurements within the three levels of fair value hierarchy of our financial assets, consisting of<br />
cash, cash equivalents, and marketable securities, at March 31, <strong>2011</strong> and 2010:<br />
17<br />
Fair Value Measurement at March 31, <strong>2011</strong> Using<br />
Total Fair Value Level 1 Level 2 Level 3<br />
(in thousands)<br />
Cash $ 30,821 $ 30,821 $ — $ —<br />
Money market funds 48,976 48,976 — —<br />
United States government obligations<br />
included in cash & cash equivalents<br />
United States government obligations<br />
3,499 3,499 — —<br />
included in marketable securities 31,432 31,432 — —<br />
Total $ 114,728 $ 114,728 $ — $ —<br />
Fair Value Measurement at March 31, 2010 Using<br />
Total Fair Value Level 1 Level 2 Level 3<br />
(in thousands)<br />
Cash $ 21,545 $ 21,545 $ — $ —<br />
Money market funds 83,136 83,136 — —<br />
Total $104,681 $ 104,681 $ — $ —<br />
At March 31, <strong>2011</strong> and 2010, we valued money market funds and<br />
United States government obligations using a Level 1 valuation because<br />
market prices in active markets for identical assets were readily<br />
available. The per-share net asset value of our money market<br />
funds has remained at a constant amount of $1.00 per share. Also,<br />
as of March 31, <strong>2011</strong>, there were no withdrawal limits on redemptions<br />
for any of the money market funds that we hold. We did not<br />
group any financial assets using Level 2 or Level 3 valuations at<br />
March 31, <strong>2011</strong> or 2010.<br />
Allowance for Doubtful Accounts. We maintain an allowance for<br />
doubtful accounts receivable for estimated losses resulting from the<br />
inability of our customers to make required payments and for the<br />
limited circumstances when the customer disputes the amounts<br />
due us. Our methodology for determining this allowance requires<br />
significant estimates. In estimating the allowance, we consider the<br />
age of the receivable, the creditworthiness of the customer, the<br />
economic conditions of the customer’s industry and general economic<br />
conditions. While we believe that the estimates we use are<br />
reasonable, should any of these factors change, our estimates may<br />
also change, which could affect the amount of our future allowance<br />
for doubtful accounts as well as future operating income. Specifically,<br />
if the financial condition of our customers were to deteriorate,<br />
resulting in an impairment of their ability to make payments to us,<br />
additional allowances could be required. As of March 31, <strong>2011</strong> and<br />
2010, accounts receivable and unbilled accounts receivable totaled<br />
$34.5 million and $32.8 million, net of an allowance for doubtful<br />
accounts of $346,000 and $336,000, respectively.<br />
Valuation of Intangible Assets and Goodwill. We account for our<br />
goodwill and intangible assets in accordance with ASC 805, Business<br />
Combinations and ASC 350, Intangibles – Goodwill and Other.<br />
Our intangible assets consist of acquired technology related to our<br />
acquisitions of a software product for modeling voice communications<br />
in December 2003, Altaworks in October 2004, purchased<br />
technology we purchased from RadView Software, Ltd. in December<br />
2005, SQMworks, Inc. in April 2006, Network Physics, Inc. in October<br />
2007, and substantially all of the assets of Embarcadero Technologies,<br />
Inc. in August 2010. Our intangible assets also consist of<br />
customer relationships and acquired workforce assets we purchased<br />
from Network Physics, Inc. related to the purchase of specified assets<br />
of Network Physics in October 2007 and trade names, trademark,<br />
customer relationships, and non-compete agreements we<br />
acquired from Embarcadero, Inc. related to the acquisition of substantially<br />
all the assets associated with the DSAuditor product line in<br />
August 2010. The acquired and purchased technologies are stated<br />
at the lower of unamortized cost or net realizable value and are<br />
amortized on a straight-line basis over their expected useful lives<br />
of three to five years. We amortize our customer relationship and<br />
workforce intangible assets we purchased from Network Physics,<br />
Inc. on an accelerated depreciation basis over their expected useful<br />
lives of four and one half years and five years, respectively. We<br />
amortize our trade names, trademark, customer relationships, and<br />
non-compete agreements we acquired from Embarcadero, Inc. on a<br />
straight-line basis over the expected useful lives. The trade names,<br />
trademark and customer relationships have useful lives of five years.<br />
The non-compete agreements have a useful life of one year.
We use the projected discounted cash flow method in valuing our<br />
acquired technology and purchased customer relationships using<br />
certain assumptions including revenue growth, cost levels, present<br />
value discount rate, and working capital requirements. We use the<br />
lower of the amount of cash paid or the present value of projected<br />
discounted cash flows to value purchased technology. We valued<br />
the workforce asset associated with the purchase of specified assets<br />
of Network Physics, Inc. on a replacement cost basis. We valued<br />
the developed technology (now our DSAuditor product line) associated<br />
with the acquisition of substantially all of the assets of<br />
Embarcadero, Inc. using an income approach known as the Relief-<br />
From-Royalty Method. While we believe the assumptions used to<br />
value our acquired technology and developed technology related<br />
to acquisitions are reasonable, actual results will likely differ from<br />
those assumptions. Future cash flows are subject to change for a<br />
variety of internal and external factors. We will periodically review<br />
the value of acquired technology, developed technology, and<br />
purchased intangible assets for reasonableness in accordance with<br />
ASC 360, Property, Plant and Equipment. If changes in our assumptions<br />
at the time of future periodic reviews indicate that the carrying<br />
value of our acquired technology and purchased intangible assets<br />
exceeds their fair value and we determine that carrying amounts<br />
can not be recovered, it would result in impairment losses. As of<br />
March 31, <strong>2011</strong> and 2010, intangible assets totaled $4.5 million and<br />
$5.1 million, net of accumulated amortization of $11.9 million and<br />
$9.7 million, respectively. We have not recorded any impairment<br />
losses to date.<br />
OPNET Technologies, Inc. <strong>2011</strong> <strong>Annual</strong> <strong>Report</strong><br />
18<br />
We record goodwill when the consideration paid for acquisitions<br />
exceeds the fair value of net tangible and intangible assets acquired.<br />
Goodwill is not amortized. We perform an annual review in the<br />
fourth quarter of each fiscal year, or more frequently if conditions<br />
dictate, to identify any facts or circumstances that indicate the carrying<br />
value of goodwill is impaired. The review is based on various<br />
analyses including cash flow and profitability projections and the<br />
market capitalization of our common stock. Impairment, if any, is<br />
based on the excess of the carrying amount of goodwill over its fair<br />
value. We performed our annual impairment test of goodwill as of<br />
March 31, <strong>2011</strong> and 2010 and concluded that the fair value substantially<br />
exceeded the carrying value; therefore, we did not record any<br />
impairment. As of March 31, <strong>2011</strong> and 2010, goodwill was $15.4<br />
million and $14.6 million, respectively. No impairment losses have<br />
been recorded to date.<br />
Accounting for Software Development Costs. We expense costs<br />
incurred in the research and development of new software products<br />
as incurred until technological feasibility is established. Development<br />
costs are capitalized beginning when a product’s technological<br />
feasibility has been established and ending when the product<br />
is available for general release to our customers. Technological<br />
feasibility is reached when the product reaches the working model<br />
stage. To date, products and enhancements have generally reached<br />
technological feasibility and have been released for sale at substantially<br />
the same time, thus all research and development costs have<br />
been expensed. Consequently, we did not capitalize any research<br />
and development costs in fiscal <strong>2011</strong>, 2010 or 2009.
Results of Operations<br />
OPNET Technologies, Inc. <strong>2011</strong> <strong>Annual</strong> <strong>Report</strong><br />
The following table sets forth items from our consolidated statements of operations expressed as a percentage of total revenue for the<br />
periods indicated:<br />
FiScal <strong>2011</strong> Fiscal 2010 Fiscal 2009<br />
revenue:<br />
Product 48.9% 41.4% 41.7%<br />
Product updates, technical support and services 36.1 37.4 35.0<br />
Professional services 15.0 21.2 23.3<br />
Total revenue 100.0 100.0 100.0<br />
CosT of revenue:<br />
Product 6.3 4.7 2.9<br />
Product updates, technical support, and services 3.6 3.8 3.8<br />
Professional services 10.9 15.3 17.0<br />
Amortization of acquired technology 1.4 1.5 1.8<br />
Total cost of revenue 22.2 25.3 25.5<br />
Gross profit 77.8 74.7 74.5<br />
operaTing expenses:<br />
Research and development 23.5 25.4 25.1<br />
Sales and marketing 32.9 34.2 34.6<br />
General and administrative 8.7 8.7 9.6<br />
Total operating expenses 65.1 68.3 69.3<br />
Income from operations 12.7 6.4 5.2<br />
Interest and other (expense) income, net (0.1) 0.0 1.0<br />
Income before provision for income taxes 12.6 6.4 6.2<br />
Provision for income taxes 4.2 1.8 2.3<br />
Net income 8.4% 4.6% 3.9%<br />
Revenue<br />
Product Revenue. Product revenue was $72.4 million, $52.3 million,<br />
and $51.2 million, in fiscal <strong>2011</strong>, 2010, and 2009, respectively,<br />
representing an increase of 38.5% in fiscal <strong>2011</strong> from fiscal 2010 and<br />
an increase of 2.0% in fiscal 2010 from fiscal 2009. For fiscal <strong>2011</strong>,<br />
the increase in product revenue was primarily due to an increase in<br />
sales to corporate enterprise customers. For fiscal 2010, the increase<br />
in product revenue was primarily due to an increase in sales to<br />
United States government customers and corporate enterprise<br />
customers, partially offset by a decrease in sales to service providers<br />
and network equipment manufacturers. The increase in fiscal <strong>2011</strong><br />
and 2010 was primarily due to an increase in revenue from sales of<br />
our APM products.<br />
Product Updates, Technical Support and Services Revenue. Product<br />
updates, technical support and services revenue was $53.4<br />
19<br />
million, $47.3 million, and $43.1 million, in fiscal <strong>2011</strong>, 2010, and<br />
2009, respectively, representing increases of 13% in fiscal <strong>2011</strong><br />
from fiscal 2010 and 9.7% in fiscal 2010 from fiscal 2009. Product<br />
updates, technical support and services revenue growth rates are<br />
affected by the overall product revenue growth rates, as well as the<br />
renewal rate of annual maintenance contracts by existing customers.<br />
The increase in product updates, technical support and services<br />
revenue in fiscal <strong>2011</strong> and fiscal 2010 primarily reflected increases<br />
in the overall customer installed base as compared to the prior fiscal<br />
year. Increases in the overall customer installed base increase the<br />
demand for annual renewals of maintenance contracts.<br />
The dollar amount of our deferred revenue under our maintenance<br />
contracts at the end of each year is a key factor in determining the<br />
near-term growth of our product updates, technical support and<br />
services revenue. The balance of deferred revenue under our maintenance<br />
contracts generally increases when we sell product licenses
and when we sell renewals of annual maintenance contracts. The<br />
amount of deferred revenue under our maintenance contracts was<br />
$41.1 million, $35.5 million, and $29.0 million at March 31, <strong>2011</strong>,<br />
2010, and 2009, respectively. The amount of deferred revenue<br />
under our maintenance contracts will generally be recognized as<br />
product updates, technical support and services revenue over the<br />
life of each individually purchased maintenance contract, which is<br />
typically a twelve-month period.<br />
Professional Services Revenue. The components of professional<br />
services revenue for fiscal <strong>2011</strong>, 2010, and 2009 were as follows:<br />
Fiscal <strong>2011</strong> Fiscal 2010<br />
(in thousands)<br />
Fiscal 2009<br />
Consulting services $ 21,788 $ 26,399 $ 27,949<br />
Training and other revenue 414 432 652<br />
Professional services $ 22,202 $ 26,831 $ 28,601<br />
Professional services revenue was $22.2 million, $26.8 million, and<br />
$28.6 million in fiscal <strong>2011</strong>, 2010, and 2009, respectively, representing<br />
decreases of 17.3% in fiscal <strong>2011</strong> from fiscal 2010 and 6.2% in<br />
fiscal 2010 from fiscal 2009. Consulting services revenue accounted<br />
for 98.1%, 98.4%, and 97.7%, of professional services revenue for fiscal<br />
<strong>2011</strong>, 2010, and 2009, respectively. For fiscal <strong>2011</strong>, the decrease<br />
in professional services revenue was largely the result of a decrease<br />
in billable hours worked on projects for United States government<br />
customers. We believe the decrease in billable hours worked on<br />
projects for United States government customers was primarily<br />
related to budget constraints. We believe the sequential decrease in<br />
revenue from professional services is also due to an increase in the<br />
proportion of sales of our APM products as compared to our other<br />
products, as our APM products generally require less consulting<br />
services to implement. For fiscal 2010, the decrease in professional<br />
services revenue was primarily due to a decrease in billable hours<br />
worked on projects related to corporate enterprise customers and<br />
service providers. We believe the decrease in billable hours worked<br />
in fiscal <strong>2011</strong> and fiscal 2010 were related to the increase in the<br />
proportion of sales of our APM products as compared to our other<br />
products, as our APM products generally require less consulting<br />
services to implement. The percentage of total consulting revenue<br />
from United States government customers for fiscal <strong>2011</strong>, 2010,<br />
and 2009 was 66.5%, 70.4%, and 65.8%, respectively, representing a<br />
decrease of 22.0% in fiscal <strong>2011</strong> from fiscal 2010, and an increase of<br />
1.1% in fiscal 2010 from fiscal 2009.<br />
Training and other revenue was $414,000, $432,000, and $652,000<br />
in fiscal <strong>2011</strong>, 2010, and 2009, respectively. The decrease in training<br />
and other revenue was due to a decrease in custom trainings in<br />
fiscal <strong>2011</strong> as compared to fiscal 2010 and in fiscal 2010 as compared<br />
to fiscal 2009. We believe the decrease in custom training is<br />
largely related to the increase in the proportion of sales of our APM<br />
OPNET Technologies, Inc. <strong>2011</strong> <strong>Annual</strong> <strong>Report</strong><br />
20<br />
products as compared to our other products, as our APM products<br />
generally require less training to utilize.<br />
International Revenue. International revenue was $38.3 million,<br />
$28.4 million, and $26.0 million in fiscal <strong>2011</strong>, 2010, and 2009, respectively,<br />
representing increases of 35.0% in fiscal <strong>2011</strong> from fiscal<br />
2010 and 9.3% in fiscal 2010 from fiscal 2009. International revenue<br />
was 25.9%, 22.5%, and 21.1% of total revenue in fiscal <strong>2011</strong>, 2010,<br />
and 2009, respectively. The increase in international revenue in fiscal<br />
<strong>2011</strong> was primarily the result of an increase in sales to corporate<br />
enterprise customers, which was partially offset by a decrease in<br />
sales to service providers. The increase in international revenue in<br />
fiscal 2010 was primarily the result of an increase in sales to corporate<br />
enterprise customers, which was partially offset by a decrease<br />
in sales to network equipment manufacturers. Our international<br />
revenue is primarily generated in Europe and Asia. Our goal is to<br />
increase international sales to corporate enterprise customers. International<br />
revenue from corporate enterprise customers comprised<br />
the largest portion of international revenue for fiscal <strong>2011</strong>. During<br />
each of fiscal <strong>2011</strong>, 2010, and 2009, we expanded our operations<br />
outside the United States through the hiring of additional direct<br />
sales persons in our foreign subsidiaries.<br />
cost of Revenue<br />
The following table sets forth, for each component of revenue, the<br />
cost of the revenue as a percentage of the related revenue for the<br />
periods indicated:<br />
Fiscal <strong>2011</strong> Fiscal 2010 Fiscal 2009<br />
Cost of product<br />
Cost of product updates,<br />
12.8% 11.5% 6.9%<br />
technical support, and services 9.9 10.3 10.8<br />
Cost of professional services 72.9 72.0 73.1<br />
Cost of product revenue consists primarily of the cost of hardware<br />
platforms associated with the delivery of some software products,<br />
royalties, fees paid to indirect channel partners and, to a lesser<br />
extent, media, manuals, and distribution costs. Cost of product updates,<br />
technical support and services revenue consists of personnelrelated<br />
costs necessary to provide technical support and training<br />
to customers with active maintenance contracts on a when-andif-available<br />
basis, royalties, media, and distribution costs. Cost of<br />
professional services revenue consists primarily of personnel-related<br />
costs necessary to provide consulting and training to customers<br />
without active maintenance contracts. Gross margins on product<br />
revenue and product updates, technical support and services<br />
revenue are substantially higher than gross margin on professional<br />
services revenue, due to the low cost of delivering product revenue<br />
and providing technical support and maintenance compared with<br />
the relatively high personnel costs associated with providing consulting<br />
services and customer training.
cosT of PRoducT Revenue. Cost of product revenue was $9.3<br />
million, $6.0 million, and $3.5 million in fiscal <strong>2011</strong>, 2010, and 2009,<br />
respectively. The increase in costs of 55.3% from fiscal 2010 to fiscal<br />
<strong>2011</strong> and 69.2% from fiscal 2009 to fiscal 2010 were primarily the<br />
result of increases in costs related to hardware platforms used to<br />
deliver our AppResponse Xpert, formerly ACE Live, software products<br />
of $2.4 million and $2.5 million, respectively. Total hardware<br />
platform costs related to the delivery of our AppResponse Xpert<br />
software products for fiscal <strong>2011</strong>, 2010, and 2009 were $7.3 million,<br />
$4.9 million, and $2.4 million respectively. Gross margin on product<br />
revenue was 87.2%, 88.6%, and 93.1%, for fiscal <strong>2011</strong>, 2010, and<br />
2009, respectively.<br />
cosT of PRoducT uPdaTes, TechnIcal suPPoRT and seRvIces<br />
Revenue. Cost of product updates, technical support and services<br />
revenue was $5.3 million, $4.9 million, and $4.7 million in<br />
fiscal <strong>2011</strong>, 2010, and 2009, respectively. Gross margin on product<br />
updates, technical support and services revenue was 90.2%, 89.7%,<br />
and 89.2%, for fiscal <strong>2011</strong>, 2010, and 2009, respectively. The 8.3%<br />
increase in cost of product updates, technical support and services<br />
revenue for fiscal <strong>2011</strong> as compared to fiscal 2010 was primarily the<br />
result of a $272,000 increase in personnel costs necessary to provide<br />
technical support and a $67,000 increase in depreciation expense<br />
on hardware necessary to provide customer support. The 4.2%<br />
increase in cost of product updates, technical support and services<br />
revenue for fiscal 2010 as compared to fiscal 2009 was primarily the<br />
result of a $93,000 increase in personnel costs necessary to provide<br />
technical support and a $35,000 increase in the cost of supplies<br />
necessary to support our products. The increases in gross margin<br />
on product updates, technical support and services revenue for<br />
fiscal <strong>2011</strong> as compared to 2010 and fiscal 2010 as compared to<br />
fiscal 2009 were primarily the result of a 13.0% and 9.7% increase<br />
in product license updates, technical support and services revenue.<br />
Stock-based compensation expense included in cost of product<br />
updates, technical support and services was $20,000, $17,000, and<br />
$20,000 foR fIscal <strong>2011</strong>, 2010, and 2009, ResPecTIvely.<br />
cosT of PRofessIonal seRvIces Revenue. Cost of professional<br />
services revenue was $16.2 million, $19.3 million, and $20.9 million<br />
in fiscal <strong>2011</strong>, 2010, and 2009, respectively. Gross margin on professional<br />
services revenue decreased to 27.1% for fiscal <strong>2011</strong> from<br />
28.0% in fiscal 2010. Gross margin on professional services revenue<br />
increased to 28.0% for fiscal 2010 from 26.9% in fiscal 2009. The<br />
decreases of 16.3% and 7.6% in cost of professional service revenue<br />
were largely due to a $2.5 million and $1.3 million decrease in direct<br />
labor expense in fiscal <strong>2011</strong> from 2010 and in fiscal 2010 from fiscal<br />
2009, respectively. The decrease in direct labor expense was attributable<br />
to decreased staffing levels in response to weaker demand<br />
for our consulting services. We believe the weaker demand for our<br />
consulting services was due to the increase in the proportion of<br />
sales of our APM products to sales of our other products, as our APM<br />
OPNET Technologies, Inc. <strong>2011</strong> <strong>Annual</strong> <strong>Report</strong><br />
21<br />
products generally require less time to implement. The decrease<br />
in gross margin on professional services in fiscal <strong>2011</strong> from fiscal<br />
2010 was primarily due to a decrease in the number of high margin<br />
fixed priced projects. The increase in gross margin on professional<br />
services in fiscal 2010 from fiscal 2009 was primarily due to the<br />
increase in profitability related to certain consulting engagements.<br />
We expect the cost of professional services revenue as a percentage<br />
of professional services revenue to vary based primarily on the<br />
profitability of individual consulting engagements. Stock-based<br />
compensation expense included in cost of professional services<br />
was $72,000, $83,000, and $113,000 for fiscal <strong>2011</strong>, 2010, and 2009,<br />
respectively.<br />
Operating Expenses<br />
ReseaRch and develoPMenT. Research and development expense<br />
was $34.7 million, $32.0 million, and $30.8 million in fiscal <strong>2011</strong>,<br />
2010, and 2009, respectively, representing increases of 8.3% in fiscal<br />
<strong>2011</strong> from fiscal 2010 and 4.1% in fiscal 2010 from fiscal 2009. The<br />
increase in fiscal <strong>2011</strong> from fiscal 2010 was primarily due to a $2.6<br />
million increase in compensation expense as a result of increased<br />
staffing levels required for developing new products as well as sustaining<br />
and upgrading existing products. The increase in fiscal 2010<br />
from fiscal 2009 was primarily due to a $1.3 million increase in compensation<br />
expense as a result of increased staffing levels required<br />
for developing new products as well as sustaining and upgrading<br />
existing products. We do not capitalize research and development<br />
costs since we release our products to the market at the same time<br />
that technological feasibility is reached. Stock-based compensation<br />
expense included in research and development was $929,000,<br />
$676,000, and $591,000 for fiscal <strong>2011</strong>, 2010, and 2009, respectively.<br />
sales and MaRkeTInG. Sales and marketing expenses were $48.7<br />
million, $43.2 million, and $42.5 million in fiscal <strong>2011</strong>, 2010, and<br />
2009, respectively. The 12.9% increase in fiscal <strong>2011</strong> from fiscal 2010<br />
was due to a $2.5 million increase in sales commissions resulting<br />
from sales growth, and a $2.2 million increase in conference and<br />
trade show expenses resulting from more normalized marketing<br />
expenditures following the economic recession. The 1.5% increase<br />
in fiscal 2010 from fiscal 2009 was due to a $2.2 million increase in<br />
compensation and commission expense as a result of increased<br />
staffing levels and higher bookings, travel costs of $337,000 and<br />
depreciation expense of $239,000, which were partially offset by a<br />
reduction in conference and marketing expenditures of $2.2 million<br />
in response to the economic recession. Stock-based compensation<br />
expense included in sales and marketing was $468,000, $343,000,<br />
and $376,000 for fiscal <strong>2011</strong>, 2010, and 2009, respectively.<br />
GeneRal and adMInIsTRaTIve. General and administrative<br />
expense was $12.9 million, $11.0 million, and $11.9 million, in fiscal<br />
<strong>2011</strong>, 2010, and 2009, respectively. The 17.6% increase in fiscal<br />
<strong>2011</strong> from fiscal 2010 was largely due to a $1.3 million increase in
performance-related variable executive compensation expense, a<br />
$288,000 increase in accounting and tax services, and a $274,000<br />
increase in bad debt expense. The increase in accounting and tax<br />
services included costs associated with outside tax advisors working<br />
to address the audit of our fiscal 2007 federal tax returns, which was<br />
completed by the Internal Revenue Service, or IRS, in July 2010. The<br />
7.1% decrease in fiscal 2010 from fiscal 2009 was largely due to a<br />
decrease in compensation expense and bad debt expense. Stockbased<br />
compensation expense included in general and administrative<br />
was $495,000, $440,000, and $433,000 for fiscal <strong>2011</strong>, 2010, and<br />
2009, respectively.<br />
InTeResT and oTheR (exPense) IncoMe, neT. Interest and other<br />
(expense) income, net was an expense of $151,000 and an expense<br />
of $70,000 for fiscal <strong>2011</strong> and fiscal 2010 respectively. Interest and<br />
other (expense) income, net was income of $1.2 million in fiscal<br />
2009. The 115.7% increase in expense in fiscal <strong>2011</strong> from fiscal 2010<br />
was primarily the result of realized foreign currency losses, which<br />
were partially offset by an increase in interest income. The change<br />
to other expense in fiscal 2010 from other income in fiscal 2009 was<br />
primarily the result of a decrease in the interest rates earned on our<br />
investment holdings.<br />
PRovIsIon foR IncoMe Taxes. Our effective tax rate was 33.5%,<br />
27.5%, and 38.2%, for fiscal <strong>2011</strong>, 2010, and 2009, respectively. For<br />
fiscal <strong>2011</strong>, the effective tax rate differed from the statutory tax rate<br />
principally due to state income taxes, the difference between the<br />
U.S. and foreign tax rates, research and development credits, the domestic<br />
production activities deduction, and compensation expense<br />
booked under our ESPP which is not deductible for tax purposes.<br />
The increase in our effective tax rate in fiscal <strong>2011</strong> from fiscal 2010<br />
was primarily due to a decrease in tax credits as a percentage of<br />
pre-tax net income. For fiscal 2010, the effective tax rate differed<br />
from the statutory tax rate principally due to state income taxes, the<br />
difference between the United States and foreign tax rates, research<br />
and development credits and the domestic production activities<br />
deduction. The decrease in our effective tax rate in fiscal 2010 from<br />
fiscal 2009 was primarily due to an increase in tax credits and a decrease<br />
in foreign tax expense. The effective tax rate differs from the<br />
statutory tax rate and varies from period to period due principally<br />
to the amount of income before taxes from various tax jurisdictions,<br />
foreign tax expense, and the amount of tax credits available to us<br />
in each period from incremental research expenditures. Future<br />
provisions for taxes will depend, among other things, on the mix<br />
and amount of worldwide income, the tax rates in effect for various<br />
tax jurisdictions and the amount of research and development tax<br />
credits, foreign tax credits and other items for which we are eligible.<br />
liquidity and capital Resources<br />
As of March 31, <strong>2011</strong> and 2010, we had cash, cash equivalents and<br />
short-term marketable securities totaling $114.7 million and $104.7<br />
OPNET Technologies, Inc. <strong>2011</strong> <strong>Annual</strong> <strong>Report</strong><br />
22<br />
million, respectively.<br />
Cash provided by operating activities was $26.7 million, $21.8 million,<br />
and $12.1 million for fiscal <strong>2011</strong>, 2010, and 2009, respectively.<br />
Cash provided by operating activities is primarily derived from net<br />
income, as adjusted for non-cash items such as depreciation and<br />
amortization expense, tax benefits from the exercise of employee<br />
stock options, and changes in operating assets and liabilities. The<br />
increase in cash provided by operating activities in fiscal <strong>2011</strong> from<br />
fiscal 2010 was primarily attributable to increases in net income,<br />
deferred revenue and accrued liabilities. The increase in cash provided<br />
by operating activities in fiscal 2010 from fiscal 2009 was primarily<br />
attributable to increases in deferred revenue and net income<br />
in fiscal 2010, as compared to fiscal 2009, which were slightly offset<br />
by a decrease in accrued liabilities.<br />
Net cash used in investing activities was $37.1 million and $2.6 million<br />
in fiscal <strong>2011</strong> and fiscal 2010, respectively. Net cash provided<br />
by investing activities was $8.3 million in fiscal 2009, respectively.<br />
Investing activities include the purchase, sale or maturity of marketable<br />
securities, acquisition of property and equipment, and net<br />
expenditures for business combinations and technology acquisitions.<br />
For fiscal <strong>2011</strong>, we used funds of $50.6 million to purchase<br />
short-term marketable securities, funds of $3.4 million to purchase<br />
property and equipment, and funds of $2.2 million to acquire<br />
substantially all the assets associated with the DSAuditor product<br />
line from Embarcadero Technologies, Inc., a privately held software<br />
company headquartered in San Francisco, California. For fiscal 2010,<br />
we used funds of $3.1 million to purchase property and equipment,<br />
and funds of $433,000 to acquire technology. We received proceeds<br />
of $1.0 million from the maturity of investments. For fiscal 2009, we<br />
used funds of $999,000 to purchase short-term marketable securities,<br />
and funds of $5.5 million to purchase property and equipment.<br />
We received proceeds of $14.8 million from the sale or maturity of<br />
short-term and long-term marketable securities for fiscal 2009.<br />
Cash used in financing activities was $11.3 million and $5.7 million<br />
in fiscal <strong>2011</strong> and fiscal 2010, respectively. Cash provided<br />
by financing activities was $861,000 in fiscal 2009. We used $25.0<br />
million during fiscal <strong>2011</strong> to pay a quarterly cash dividend of $0.10<br />
per share to stockholders of record on June 15, 2010, September<br />
14, 2010, December 7, 2010, and March 16, <strong>2011</strong>, and a one-time<br />
special dividend of $0.75 per share to stockholders of record on<br />
November 14, 2010. We used $7.5 million during fiscal 2010 to<br />
pay a quarterly cash dividend of $0.09 per share to stockholders of<br />
record on June 15, 2009, September 15, 2009, December 15, 2009,<br />
and March 15, 2010. We used cash of $3.6 million, $2.3 million, and<br />
$955,000 to acquire 223,399, 186,550, and 75,724 shares of our<br />
common stock pursuant to our stock repurchase program during<br />
fiscal <strong>2011</strong>, fiscal 2010, and fiscal 2009, respectively. During fiscal<br />
<strong>2011</strong>, fiscal 2010, and fiscal 2009, 27,261, 26,352 and 15,724 shares,<br />
respectively, were withheld from employees to satisfy the minimum
statutory tax withholding obligations with respect to the income<br />
recognized by these employees upon the vesting of their restricted<br />
stock shares during the period. Cash provided by financing activities<br />
reflects the proceeds received from the exercise of stock options and<br />
the sale of common stock under our employee stock purchase plan.<br />
During fiscal <strong>2011</strong>, 2010, and 2009, we received proceeds of approximately<br />
$14.2 million, $2.7 million, and $644,000, respectively, and issued<br />
1,250,735, 277,110, and 92,648 shares of common stock, pursuant<br />
to employee and director exercises of stock options. During fiscal <strong>2011</strong>,<br />
2010, and 2009, we received proceeds of approximately $1.5 million,<br />
$1.3 million and $1.1 million, respectively, and issued 132,933, 170,271,<br />
and 150,712 shares of common stock, respectively, pursuant to the<br />
issuance of common stock under our employee stock purchase plan.<br />
Excess tax benefits from the exercise of stock options are presented as<br />
a cash flow from financing activities. For fiscal <strong>2011</strong>, 2010, and 2009,<br />
excess tax benefits from the exercise of stock options were $1.5 million,<br />
OPNET Technologies, Inc. <strong>2011</strong> <strong>Annual</strong> <strong>Report</strong><br />
23<br />
$51,000, and $49,000, respectively.<br />
We have commitments under contractual arrangements to make<br />
future payments for goods and services. These contractual arrangements<br />
secure the rights to various assets and services to be used<br />
in future periods in the normal course of business. For example,<br />
we are contractually committed to make minimum lease payments<br />
for the use of property under operating lease agreements.<br />
In accordance with current accounting rules, the future rights and<br />
related obligations pertaining to such contractual arrangements<br />
are not reported as assets or liabilities on our consolidated balance<br />
sheets. Our liability for unrecognized tax benefits under ASC 740<br />
is reported on our consolidated balance sheets. We expect to fund<br />
these contractual arrangements with our cash, cash equivalents and<br />
marketable securities as well as cash generated from operations in<br />
the normal course of business.<br />
The following table summarizes our contractual operating lease arrangements and our liability for unrecognized tax benefits at March 31,<br />
<strong>2011</strong>, and the timing and effect that such commitments are expected to have on our liquidity and cash flow in future periods.<br />
Contractual Obligations<br />
Payments Due by Period<br />
Fiscal 2013 – Fiscal 2015 –<br />
and Unrecognized Tax Benefits<br />
(in thousands)<br />
Total Fiscal 2012 Fiscal 2014 Fiscal 2016 After Fiscal 2016<br />
Facilities Operating Lease Obligations $ 47,387 $ 5,050 $ 10,065 $ 9,628 $ 22,644<br />
Other Operating Lease Obligations 60 32 15 13 —<br />
Unrecognized Tax Benefits 691 30 437 224 —<br />
Total $ 48,138 $ 5,112 $ 10,517 $ 9,865 $ 22,644<br />
See Notes 10 and 11 to our consolidated financial statements for<br />
additional information related to our operating leases. As of March<br />
31, <strong>2011</strong>, we had no capital lease obligations.<br />
Effective June 10, 2002, we entered into a credit facility with a<br />
commercial bank. The credit facility permitted the use of funds for<br />
general corporate purposes and the issuance of letters of credit up<br />
to a maximum of $10.0 million in the aggregate. As of March 31,<br />
<strong>2011</strong>, the lender under our credit facility had issued letters of credit<br />
in favor of the beneficiaries under a number of our operating leases<br />
and a guarantee to satisfactorily complete a long-term professional<br />
services contract in the aggregate amount of $3.5 million. The longterm<br />
professional services contract was completed in fiscal 2012.<br />
Upon a default, as defined in the respective office lease agreement,<br />
the applicable landlord has the right to draw upon its letter of credit<br />
in whole or in part. Interest under this facility, including interest on<br />
any amounts drawn under the letters of credit, is payable monthly<br />
at an annual rate of 1.25%. The credit facility is collateralized by our<br />
accounts receivable.<br />
We expect working capital needs to increase in the foreseeable<br />
future in order for us to execute our business plan and growth strategies.<br />
We anticipate that operating activities, as well as expected<br />
capital expenditures incurred in the normal course of business, will<br />
constitute a material use of our cash resources. In addition, we may<br />
utilize cash resources to fund acquisitions or investments in complementary<br />
businesses, technologies or products as well as repurchase<br />
our common stock in accordance with our stock repurchase program<br />
authorized by our Board in January 2005, and the payment of<br />
dividends to our stockholders.<br />
We believe that our current cash and cash equivalents, marketable<br />
securities, and cash generated from operations will be sufficient to<br />
meet our anticipated cash requirements for working capital, capital<br />
expenditures, and dividends at least through fiscal 2012.<br />
Off-Balance Sheet arrangements<br />
We do not have any off-balance sheet arrangements with unconsolidated<br />
entities or related parties and, accordingly, there are no<br />
off-balance sheet risks to our liquidity and capital resources from<br />
unconsolidated entities.
Recently issued accounting Pronouncements<br />
In October 2009, the Financial Accounting Standards Board, or FASB,<br />
issued Accounting Standards Update, or ASU 2009-14, “Certain<br />
Revenue Arrangement That Include Software Elements,” (included<br />
in Accounting Standards Codification, or ASC, 985 “Software”) and<br />
Accounting Standards Update, or ASU, 2009-13, “Multiple Deliverable<br />
Revenue Arrangements,” which amends EITF Issue No. 08-1,<br />
“Revenue Arrangements With Multiple Deliverables” (as codified in<br />
ASC 605 “Revenue Recognition”). ASU 2009-14 amends the scoping<br />
guidance for software arrangements to exclude tangible products<br />
that contain software elements and nonsoftware elements that<br />
function together to interdependently deliver the product’s essential<br />
functionality. ASU 2009-13 amends the current guidance on<br />
arrangements with multiple elements to (1) eliminate the separation<br />
criterion that requires entities to establish objective and reliable<br />
evidence of fair value for undelivered elements, (2) establish a selling<br />
price hierarchy to help entities allocate arrangement consideration<br />
to the separate units of account, (3) require the relative selling<br />
price allocation method for all arrangements (i.e., eliminate the<br />
residual method), and (4) significantly expand required disclosures.<br />
ASU 2009-14 and ASU 2009-13 will be effective for the first annual<br />
reporting period beginning on or after June 15, 2010, which the<br />
Company adopted on April 1, <strong>2011</strong>. Early adoption is permitted. We<br />
OPNET Technologies, Inc. <strong>2011</strong> <strong>Annual</strong> <strong>Report</strong><br />
24<br />
have determined that ASU 2009-14 and ASU 2009-13 will not have a<br />
material impact on our results of operations or financial condition.<br />
In December 2010, FASB issued ASU 2010-29, “Disclosure of Supplementary<br />
Pro Forma Information for Business Combinations (as<br />
codified in ASC 805 “Business Combinations”). The objective of ASU<br />
2010-29 is to address diversity in practice about the interpretation<br />
of the pro forma revenue and earnings disclosure requirements for<br />
business combinations. The amendments in this update specify<br />
that if a public entity presents comparative financial statements, the<br />
entity should disclose revenue and earnings of the combined entity<br />
as though the business combination that occurred during the year<br />
had occurred as of the beginning of the comparable prior annual<br />
reporting period only. The amendments also expand the supplemental<br />
pro forma disclosures under Topic 805 “Business Combinations”<br />
to include a description of the nature and amount of material,<br />
nonrecurring pro forma adjustments directly attributable to the<br />
business combination included in the reported pro forma revenue<br />
and earnings. ASU 2010-29 will be effective prospectively for business<br />
combinations for which the acquisition date is on or after the<br />
beginning of the first annual reporting period after December 15,<br />
2010. Early adoption is permitted. We will be impacted by ASU<br />
2010-29 if we make an acquisition that is accounted for as a business<br />
combination.
OPNET Technologies, Inc. <strong>2011</strong> <strong>Annual</strong> <strong>Report</strong><br />
QUantitatiVe anD QUalitatiVe DiSclOSUReS aBOUt maRKet RiSK<br />
We consider all highly liquid investments purchased with an original maturity of three months or less to be cash equivalents, and those with<br />
maturities greater than three months are considered to be marketable securities. Our cash equivalents and short-term marketable securities<br />
consist primarily of United States backed money market funds, United States Treasury bills, and United States Treasury notes with original<br />
maturities greater than three months and less than one year. We currently do not hedge interest rate exposure, but do not believe that an<br />
increase in interest rates would have a material effect on the value of our cash equivalents or marketable securities.<br />
At March 31, <strong>2011</strong>, we had $114.7 million in cash, cash equivalents, and marketable securities. As of March 31, 2010, we had $104.7 million<br />
in cash and cash equivalents. We did not hold any short-term marketable securities at March 31, 2010. Based on our cash, cash equivalents,<br />
and marketable securities as of March 31, <strong>2011</strong>, a one percentage point increase or decrease in interest rates would increase or decrease our<br />
annual interest income and cash flows by approximately $1.1 million.<br />
At March 31, <strong>2011</strong>, $49.0 million of our $83.3 million in cash and cash equivalents was held in money market funds. The money market funds<br />
are predominately backed by United States government securities. The per-share net asset value of our money market funds has remained<br />
at a constant amount of $1.00 per share. Also, as of March 31, <strong>2011</strong>, there were no withdrawal limits on redemptions for any of the money<br />
market funds that we hold.<br />
Our consolidated financial statements are denominated in United States dollars and, accordingly, changes in the exchange rate between<br />
foreign currencies and the United States dollar will affect the translation of our subsidiaries’ financial results into United States dollars for purposes<br />
of reporting our consolidated financial results. The accumulated currency translation adjustment, recorded as a separate component<br />
of stockholder’s equity, was a loss of $649,000 and a loss of $999,000 at March 31, <strong>2011</strong> and 2010, respectively. A majority of our revenue<br />
transactions outside the United States are denominated in local currencies and the majority of operating expenses associated with our foreign<br />
subsidiaries are denominated in local currencies; therefore, our results of operations and financial condition are subject to fluctuations<br />
due to changes in foreign currency exchange rates, particularly changes in the British pound and the European Union euro. We currently do<br />
not hedge foreign exchange rate risk. Approximately 25.9%, 22.5%, and 21.1% of our total revenue for fiscal <strong>2011</strong>, fiscal 2010, and fiscal 2009,<br />
respectively, was generated from outside of the United States. Due to the limited nature of our foreign operations, we do not believe that a<br />
10% change in exchange rates would have a material effect on our business, financial condition, or results of operations. Based on our revenue<br />
and operating expenses denominated in foreign currencies during fiscal <strong>2011</strong>, fiscal 2010, and fiscal 2009, a 10% increase or decrease in<br />
exchange rates would increase or decrease our consolidated net income by approximately $43,000, $56,000, and $107,000, respectively.<br />
25
OPNET Technologies, Inc. <strong>2011</strong> <strong>Annual</strong> <strong>Report</strong><br />
manaGement’S RePORt On inteRnal cOntROl OVeR Financial RePORtinG<br />
Management of OPNET Technologies, Inc. and its subsidiaries (the “Company”) is responsible for establishing and maintaining adequate internal<br />
control over financial reporting. Internal control over financial reporting is defined in Rule 13a-15(f) or 15d-15(f) promulgated under<br />
the Securities Exchange Act of 1934 as a process designed by, or under the supervision of, the company’s principal executive and principal<br />
financial officers and effected by the Company’s Board of Directors, management and other personnel, to provide reasonable assurance<br />
regarding the reliability of financial reporting and the preparation of financial statements for external purposes in accordance with generally<br />
accepted accounting principles and includes those policies and procedures that:<br />
(i) pertain to the maintenance of records that, in reasonable detail, accurately and fairly reflect the transactions and dispositions of the<br />
assets of the company;<br />
(ii) provide reasonable assurance that transactions are recorded as necessary to permit preparation of financial statements in accordance<br />
with generally accepted accounting principles, and that receipts and expenditures of the Company are being made only in accordance<br />
with authorization of management and directors of the Company; and<br />
(iii) provide reasonable assurance regarding prevention or timely detection of unauthorized acquisition, use or disposition of our assets<br />
that could have a material effect on the financial statements.<br />
Because of its inherent limitations, internal control over financial reporting may not prevent or detect misstatements. Also, projections of<br />
any evaluation of effectiveness to future periods are subject to the risk that controls may become inadequate because of changes in conditions,<br />
or that the degree of compliance with the policies or procedures may deteriorate.<br />
Our management assessed the effectiveness of our internal control over financial reporting as of March 31, <strong>2011</strong>. In making this assessment,<br />
our management used the criteria set forth by the Committee of Sponsoring Organizations of the Treadway Commission (COSO) in Internal<br />
Control-Integrated Framework. Based on our assessment and those criteria, management concluded that the Company’s internal control<br />
over financial reporting was effective as of March 31, <strong>2011</strong>.<br />
OPNET Technologies, Inc.<br />
June 3, <strong>2011</strong><br />
26
OPNET Technologies, Inc. <strong>2011</strong> <strong>Annual</strong> <strong>Report</strong><br />
RePORt OF inDePenDent ReGiSteReD PUBlic accOUntinG FiRm<br />
To the Audit Committee and Stockholders of OPNET Technologies, Inc.<br />
Bethesda, Maryland<br />
We have audited the internal control over financial reporting of OPNET Technologies, Inc., and its subsidiaries (the “Company”) as of March<br />
31, <strong>2011</strong>, based on the criteria established in Internal Control — Integrated Framework issued by the Committee of Sponsoring Organizations<br />
of the Treadway Commission. The Company’s management is responsible for maintaining effective internal control over financial<br />
reporting and for its assessment of the effectiveness of internal control over financial reporting, included in the accompanying Management’s<br />
<strong>Report</strong> on Internal Control Over Financial <strong>Report</strong>ing. Our responsibility is to express an opinion on the Company’s internal control<br />
over financial reporting based on our audit.<br />
We conducted our audit in accordance with the standards of the Public Company Accounting Oversight Board (United States). Those<br />
standards require that we plan and perform the audit to obtain reasonable assurance about whether effective internal control over financial<br />
reporting was maintained in all material respects. Our audit included obtaining an understanding of internal control over financial reporting,<br />
assessing the risk that a material weakness exists, testing and evaluating the design and operating effectiveness of internal control<br />
based on the assessed risk, and performing such other procedures as we considered necessary in the circumstances. We believe that our<br />
audit provides a reasonable basis for our opinion.<br />
A company’s internal control over financial reporting is a process designed by, or under the supervision of, the company’s principal executive<br />
and principal financial officers, or persons performing similar functions, and effected by the company’s board of directors, management,<br />
and other personnel to provide reasonable assurance regarding the reliability of financial reporting and the preparation of financial<br />
statements for external purposes in accordance with generally accepted accounting principles. A company’s internal control over financial<br />
reporting includes those policies and procedures that (1) pertain to the maintenance of records that, in reasonable detail, accurately and<br />
fairly reflect the transactions and dispositions of the assets of the company; (2) provide reasonable assurance that transactions are recorded<br />
as necessary to permit preparation of financial statements in accordance with generally accepted accounting principles, and that receipts<br />
and expenditures of the company are being made only in accordance with authorizations of management and directors of the company;<br />
and (3) provide reasonable assurance regarding prevention or timely detection of unauthorized acquisition, use, or disposition of the company’s<br />
assets that could have a material effect on the financial statements.<br />
Because of the inherent limitations of internal control over financial reporting, including the possibility of collusion or improper management<br />
override of controls, material misstatements due to error or fraud may not be prevented or detected on a timely basis. Also, projections<br />
of any evaluation of the effectiveness of the internal control over financial reporting to future periods are subject to the risk that the<br />
controls may become inadequate because of changes in conditions, or that the degree of compliance with the policies or procedures may<br />
deteriorate.<br />
In our opinion, the Company maintained, in all material respects, effective internal control over financial reporting as of March 31, <strong>2011</strong>,<br />
based on the criteria established in Internal Control — Integrated Framework issued by the Committee of Sponsoring Organizations of the<br />
Treadway Commission.<br />
We have also audited, in accordance with the standards of the Public Company Accounting Oversight Board (United States), the consolidated<br />
financial statements as of and for the year ended March 31, <strong>2011</strong>, of the Company and our report dated June 3, <strong>2011</strong>, expressed an<br />
unqualified opinion on those consolidated financial statements.<br />
DELOITTE & TOUCHE LLP<br />
McLean, Virginia<br />
June 3, <strong>2011</strong><br />
27
OPNET Technologies, Inc. <strong>2011</strong> <strong>Annual</strong> <strong>Report</strong><br />
RePORt OF inDePenDent ReGiSteReD PUBlic accOUntinG FiRm<br />
To the Audit Committee and Stockholders of OPNET Technologies, Inc.<br />
Bethesda, Maryland<br />
We have audited the accompanying consolidated balance sheets of OPNET Technologies, Inc., and its subsidiaries (the “Company”) as of<br />
March 31, <strong>2011</strong> and 2010, and the related consolidated statements of operations, changes in stockholders’ equity, and cash flows for each of<br />
the three years in the period ended March 31, <strong>2011</strong>. These consolidated financial statements are the responsibility of the Company’s management.<br />
Our responsibility is to express an opinion on these consolidate financial statements based on our audits.<br />
We conducted our audits in accordance with the standards of the Public Company Accounting Oversight Board (United States). Those<br />
standards require that we plan and perform the audit to obtain reasonable assurance about whether the financial statements are free of<br />
material misstatement. An audit includes examining, on a test basis, evidence supporting the amounts and disclosures in the financial statements.<br />
An audit also includes assessing the accounting principles used and significant estimates made by management, as well as evaluating<br />
the overall financial statement presentation. We believe that our audits provide a reasonable basis for our opinion.<br />
In our opinion, such consolidated financial statements present fairly, in all material respects, the financial position of OPNET Technologies,<br />
Inc. and its subsidiaries as of March 31, <strong>2011</strong> and 2010, and the results of its operations and its cash flows for each of the three years in the<br />
period ended March 31, <strong>2011</strong>, in conformity with accounting principles generally accepted in the United States of America.<br />
We have also audited, in accordance with the standards of the Public Company Accounting Oversight Board (United States), the Company’s<br />
internal control over financial reporting as of March 31, <strong>2011</strong>, based on the criteria established in Internal Control — Integrated Framework<br />
issued by the Committee of Sponsoring Organizations of the Treadway Commission and our report dated June 3, <strong>2011</strong>, expressed an unqualified<br />
opinion on the effectiveness of the Company’s internal control over financial reporting.<br />
DELOITTE & TOUCHE LLP<br />
McLean, Virginia<br />
June 3, <strong>2011</strong><br />
28
cOnSOliDateD Balance SHeetS<br />
(in thousands, except share data)<br />
OPNET Technologies, Inc. <strong>2011</strong> <strong>Annual</strong> <strong>Report</strong><br />
29<br />
March 31,<br />
asseTs <strong>2011</strong> 2010<br />
current assets:<br />
Cash and cash equivalents $ 83,296 $ 104,681<br />
Marketable securities 31,432 —<br />
Accounts receivable, net of $346 and $336 in allowance for doubtful accounts at<br />
March 31, <strong>2011</strong> and 2010, respectively 32,597 28,015<br />
Unbilled accounts receivable 1,915 4,765<br />
Inventory 666 872<br />
Prepaid expenses and other current assets 4,289 2,816<br />
Total current assets 154,195 141,149<br />
Property and equipment, net 12,701 13,245<br />
Intangible assets, net 4,507 5,109<br />
Goodwill 15,406 14,639<br />
Deferred income taxes and other assets 5,014 4,210<br />
Total assets $191,823 $ 178,352<br />
liabiliTies anD sToCKholDers’ equiTy<br />
current liabilities:<br />
Accounts payable $ 1,247 $ 1,405<br />
Accrued liabilities 14,698 10,932<br />
Deferred and accrued income taxes 186 498<br />
Deferred rent 182 432<br />
Deferred revenue 42,282 38,425<br />
Total current liabilities 58,595 51,692<br />
Accrued liabilities 107 145<br />
Deferred rent 2,422 2,138<br />
Deferred revenue 5,215 4,946<br />
Other income tax 661 755<br />
Total liabilities 67,000 59,676<br />
commitments and contingencies (note 10)<br />
Stockholders’ equity:<br />
Common stock – par value $0.001; 100,000,000 shares authorized; 29,883,409 and<br />
28,386,958 shares issued at March 31, <strong>2011</strong> and 2010, respectively; 22,228,504 and<br />
20,955,452 shares outstanding at March 31, <strong>2011</strong> and 2010, respectively 30 28<br />
Additional paid-in capital 121,230 99,229<br />
Retained earnings 25,348 37,920<br />
Accumulated other comprehensive loss (649) (999)<br />
Treasury stock – 7,654,905 and 7,431,506 shares at March 31, <strong>2011</strong> and 2010, respectively, at cost (21,136) (17,502)<br />
Total stockholders’ equity 124,823 118,676<br />
Total liabilities and stockholders’ equity $ 191,823 $ 178,352<br />
See accompanying notes to consolidated financial statements.
cOnSOliDateD StatementS OF OPeRatiOnS<br />
(in thousands, except per share data)<br />
OPNET Technologies, Inc. <strong>2011</strong> <strong>Annual</strong> <strong>Report</strong><br />
30<br />
Year Ended March 31,<br />
revenue <strong>2011</strong> 2010 2009<br />
Product $ 72,392 $ 52,252 $ 51,211<br />
Product updates, technical support and services 53,392 47,264 43,067<br />
Professional services 22,202 26,831 28,601<br />
Total revenue 147,986 126,347 122,879<br />
CosT of revenue<br />
Product 9,293 5,983 3,536<br />
Product updates, technical support and services 5,260 4,859 4,665<br />
Professional services 16,183 19,328 20,911<br />
Amortization of acquired technology 2,050 1,835 2,172<br />
Total cost of revenue 32,786 32,005 31,284<br />
Gross profit 115,200 94,342 91,595<br />
operaTing expenses<br />
Research and development 34,718 32,043 30,791<br />
Sales and marketing 48,733 43,181 42,533<br />
General and administrative 12,947 11,011 11,857<br />
Total operating expenses 96,398 86,235 85,181<br />
income from operations 18,802 8,107 6,414<br />
Interest and other (expense) income, net (151) (70) 1,246<br />
Income before provision for income taxes 18,651 8,037 7,660<br />
Provision for income taxes 6,250 2,214 2,928<br />
Net income $ 12,401 $ 5,823 $ 4,732<br />
Basic net income per common share $ 0.57 $ 0.28 $ 0.23<br />
Diluted net income per common share $ 0.55 $ 0.28 $ 0.23<br />
Basic weighted average common shares outstanding 21,429 20,529 20,296<br />
Diluted weighted average common shares outstanding 22,130 20,790 20,533<br />
See accompanying notes to consolidated financial statements.
OPNET Technologies, Inc. <strong>2011</strong> <strong>Annual</strong> <strong>Report</strong><br />
cOnSOliDateD StatementS OF cHanGeS in StOcKHOlDeRS’ eQUitY<br />
(in thousands, except per share data)<br />
accumulated<br />
additional Other total<br />
Paid in Retained comprehensive Stockholders’<br />
common Stock capital treasury Stock earnings income (loss) equity<br />
Shares Shares<br />
issued Outstanding amount Shares amount<br />
Balance, april 1, 2008 27,577 20,407 $28 $89,878 7,169 $ (14,259) $34,838 $160 $110,645<br />
Net income 4,732 4,732<br />
Foreign currency translation (1,712) (1,712)<br />
Reversal of unrealized loss on marketable securities, net of tax 381 381<br />
Total comprehensive income 3,401<br />
Exercise of options 93 93 644 644<br />
Employee stock purchase plan 151 151 1,123 1,123<br />
Tax benefit from exercise of stock<br />
options and lapse of restricted stock 114 114<br />
Restricted stock issuance, net of forfeitures 83 83 —<br />
Purchase of treasury shares (76) 76 (955) (955)<br />
Stock based compensation expense 1,533 1,533<br />
Balance, March 31, 2009 27,904 20,658 28 93,292 7,245 (15,214) 39,570 (1,171) 116,505<br />
Net income 5,823 5,823<br />
Foreign currency translation 172 172<br />
Total comprehensive income 5,995<br />
Exercise of options 277 277 2,720 2,720<br />
Employee stock purchase plan<br />
Tax benefit from exercise of stock<br />
170 170 1,307 1,307<br />
options and lapse of restricted stock 351 351<br />
Restricted stock issuance, net of forfeitures 36 36 —<br />
Purchase of treasury shares (186) 186 (2,288) (2,288)<br />
Stock based compensation expense 1,559 1,559<br />
Dividends declared ($0.36 per share) (7,473) (7,473)<br />
Balance, March 31, 2010 28,387 20,955 28 99,229 7,431 (17,502) 37,920 (999) 118,676<br />
Net income 12,401 12,401<br />
Foreign currency translation 346 346<br />
Unrealized gain on marketable securities 4 4<br />
Total comprehensive income 12,751<br />
Exercise of options 1,251 1,251 2 14,240 14,242<br />
Employee stock purchase plan<br />
Tax benefit from exercise of stock<br />
133 133 1,547 1,547<br />
options and lapse of restricted stock 4,225 4,225<br />
Restricted stock issuance, net of forfeitures 113 113 —<br />
Purchase of treasury shares (223) 223 (3,634) (3,634)<br />
Stock based compensation expense 1,989 1,989<br />
Dividends declared ($1.15 per share)(a) (24,974) (24,974)<br />
Other (1) 1 1 1<br />
BalaNcE, MaRch 31, <strong>2011</strong> 29,883 22,229 $30 $121,230 7,655 $(21,136) $25,348 $(649) $124,823<br />
(a) Includes special dividend of $0.75 per share in fiscal <strong>2011</strong>.<br />
See accompanying notes to consolidated financial statements.<br />
31
cOnSOliDateD StatementS OF caSH FlOWS<br />
(in thousands)<br />
Cash flows from operating activities:<br />
OPNET Technologies, Inc. <strong>2011</strong> <strong>Annual</strong> <strong>Report</strong><br />
32<br />
Year Ended March 31,<br />
<strong>2011</strong> 2010 2009<br />
Net income $ 12,401 $ 5,823 $ 4,732<br />
Adjustments to reconcile net income to net cash provided by operating activities:<br />
Depreciation and amortization 5,793 5,340 5,528<br />
Loss on disposition of fixed assets 51 45 74<br />
Provision for losses on accounts receivable 571 297 646<br />
Deferred income taxes (997) (328) (431)<br />
Non-cash stock-based compensation expense 1,989 1,559 1,533<br />
Non-cash accretion of market discount on marketable securities 45 (1) —<br />
Excess tax benefit from exercise of stock options (1,471) (51) (49)<br />
Changes in assets and liabilities, net of assets acquired:<br />
Accounts receivable (2,332) (3,518) (3,926)<br />
Inventory 718 197 569<br />
Prepaid expenses and other current assets (348) (364) (70)<br />
Other assets (714) (40) (434)<br />
Accounts payable (159) 874 (10)<br />
Accrued liabilities 3,473 158 1,682<br />
Accrued income taxes 3,575 1,913 (130)<br />
Deferred rent 34 (365) (248)<br />
Deferred revenue 4,046 10,238 2,638<br />
Net cash provided by operating activities 26,675 21,777 12,104<br />
Cash flows from investing activities:<br />
Acquisition of business (2,225) — —<br />
Acquired technology — (433) —<br />
Purchase of property and equipment (3,407) (3,148) (5,466)<br />
Purchase of investments (50,554) — (999)<br />
Proceeds from sale/maturity of investments 19,083 1,000 14,800<br />
Net cash (used in) provided by investing activities (37,103) (2,581) 8,335<br />
Cash flows from financing activities:<br />
Acquisition of treasury stock (3,634) (2,288) (955)<br />
Excess tax benefit from exercise of stock options 1,471 51 49<br />
Proceeds from exercise of stock options 14,241 2,720 644<br />
Issuance of common stock under employee stock purchase plan 1,547 1,307 1,123<br />
Payment of dividend to stockholders (24,974) (7,473) —<br />
Net cash (used in) provided by financing activities (11,349) (5,683) 861<br />
Effect of exchange rate changes on cash and cash equivalents 392 178 (1,720)<br />
Net (decrease) increase in cash and cash equivalents (21,385) 13,691 19,580<br />
Cash and cash equivalents, beginning of year 104,681 90,990 71,410<br />
Cash and cash equivalents, end of year $ 83,296 $ 104,681 $ 90,990<br />
See accompanying notes to consolidated financial statements
1. organizaTion anD signifiCanT aCCounTing poliCies<br />
Organization. OPNET Technologies, Inc. and its subsidiaries, (here-<br />
after, the Company or OPNET), provides application and network<br />
performance management solutions. The Company’s software<br />
products address application performance management, network<br />
planning, engineering and operations, and network research and<br />
development. The Company sells products to corporate enterprises,<br />
government and defense agencies, network service providers, and<br />
network equipment manufacturers. The Company markets software<br />
products and related services in North America primarily through a<br />
direct sales force and, to a lesser extent, several resellers and original<br />
equipment manufacturers. Internationally, the Company conducts<br />
research and development through a wholly-controlled subsidiary<br />
in Ghent, Belgium and markets software products and related<br />
services through wholly-owned subsidiaries in Paris, France; Mainz,<br />
Germany; Slough, United Kingdom; and Singapore; a sales office<br />
in Beijing, China; third-party distributors; and value-added resellers.<br />
The Company is headquartered in Bethesda, Maryland and has<br />
domestic offices in Cary, North Carolina; Dallas, Texas; Santa Clara,<br />
California; Nashua, New Hampshire; and Colorado Spring, Colorado.<br />
Principles of consolidation. The consolidated financial statements<br />
include the results of OPNET Technologies, Inc., its wholly-owned<br />
subsidiaries: OPNET Technologies Societe par Actions Simplifiee;<br />
OPNET Technologies Limited; OPNET Analysis, Inc.; OPNET Technologies,<br />
GmbH; and OPNET Technologies Asia, Pte. Ltd., and its whollycontrolled<br />
subsidiary OPNET Technologies b.v.b.a. All intercompany<br />
accounts and transactions have been eliminated in consolidation.<br />
Use of Estimates. The preparation of financial statements in<br />
conformity with generally accepted accounting principles in the<br />
United States of America, or GAAP, requires management to make<br />
estimates, judgments and assumptions. These estimates, judgments,<br />
and assumptions affect the reported amounts of assets and<br />
OPNET Technologies, Inc. <strong>2011</strong> <strong>Annual</strong> <strong>Report</strong><br />
33<br />
liabilities and the disclosure of contingent assets and liabilities at<br />
the date of the consolidated financial statements and the reported<br />
amounts of revenue and expenses during the reporting period.<br />
Actual results may differ from these estimates. Significant items<br />
subject to such estimates, judgments, and assumptions include revenue<br />
recognition, the carrying amount and useful lives of long-lived<br />
assets, valuation allowances for accounts receivable and deferred<br />
tax assets, research and development tax credits, determination of<br />
uncertain tax position benefits under ASC 740 Income Taxes, or ASC<br />
740, software development costs, valuation of acquired intangible<br />
assets, valuation of stock based compensation, and loss contingencies,<br />
such as litigation, claims and assessments.<br />
cash and cash Equivalents. Cash and cash equivalents consist of<br />
deposits in banks and all highly liquid investments with maturities<br />
of three months or less when purchased.<br />
Marketable Securities. The Company has determined that its investments<br />
in marketable securities are to be classified as availablefor-sale.<br />
Available-for-sale securities are carried at fair value, with<br />
the unrealized gains and losses reported in stockholders’ equity in<br />
the accompanying consolidated balance sheets under the caption<br />
“Accumulated other comprehensive loss.” The amortized cost of<br />
debt securities is adjusted for amortization of premiums and accretion<br />
of discounts to maturity. Such amortization is included in the<br />
“Interest and other (expense) income, net” line item on the accompanying<br />
consolidated statements of operations. Realized gains and<br />
losses on available-for-sale securities are included in the “Interest<br />
and other (expense) income, net” line item on the consolidated<br />
statements of operations. The cost of securities sold is based on the<br />
specific identification method. Interest and dividends on securities<br />
classified as available-for-sale are included in the “Interest and other<br />
(expense) income, net” line item on the accompanying consolidated<br />
statements of operations.<br />
Supplemental cash Flow information.<br />
<strong>2011</strong><br />
Year ended March 31,<br />
2010 2009<br />
cash paid during the fiscal year for: (in thousands)<br />
Income taxes<br />
Non-cash financing and investing activities:<br />
$ 3,558 $ 527 $ 3,239<br />
Unrealized gain (loss) on marketable securities $ 4 $ — $ 381<br />
Restricted stock issued $ 2,413 $ 622 $ 860<br />
Accrued liability for the purchase of property and equipment $ 149 $ 11 $ 72<br />
Tenant improvement allowance received from landlord $ — $ — $ 1,095
advertising Expense. Advertising costs are expensed when<br />
incurred. Advertising expense for fiscal <strong>2011</strong>, 2010, and 2009 was<br />
$556,000, $497,000, and $389,000, respectively.<br />
concentration of credit Risk. Financial instruments that potentially<br />
subject the Company to a concentration of credit risk consist<br />
principally of cash, cash equivalents, marketable securities and<br />
accounts receivable. The Company generally does not require collateral<br />
on accounts receivable, as the majority of its customers are<br />
large, well-established companies or government entities.<br />
The Company maintains its cash balances at several financial institutions.<br />
The Federal Deposit Insurance Corporation fully insures the<br />
non-interest bearing bank accounts and interest bearing accounts<br />
up to $250,000. Although the Company’s interest bearing balances<br />
exceed $250,000, the Company has not experienced any losses in<br />
such accounts and believes it is not exposed to any significant credit<br />
risk related to cash.<br />
The Company’s cash equivalents and short-term marketable securities<br />
consist primarily of United States backed money market funds<br />
and securities with short-term maturities. The per-share net asset<br />
value of the Company’s money market funds has remained at a constant<br />
amount of $1.00 per share. Also, as of March 31, <strong>2011</strong>, there<br />
were no withdrawal limits on redemptions for any of the money<br />
market funds that the Company held. Accordingly, the Company<br />
has no quantitative information concerning the market risks and<br />
believes that the risk is minimal.<br />
Fair Value of Financial instruments. The fair value of the Company’s<br />
accounts receivable, accounts payable, and accrued expenses<br />
approximates their respective carrying amounts.<br />
The Company measures its cash equivalents and marketable securities<br />
using the fair value measurement principles of ASC 820 Fair<br />
Value Measurements and Disclosures, or ASC 820, which requires<br />
that fair value be based on the assumptions that market participants<br />
would use when pricing an asset or liability.<br />
ASC 820 requires disclosures regarding the manner in which fair<br />
value is determined for assets and liabilities and establishes a threetiered<br />
fair value hierarchy into which these assets and liabilities<br />
must be grouped, based upon significant levels of inputs as follows:<br />
• Level 1 – Quoted prices (unadjusted) in active markets for identical<br />
assets or liabilities.<br />
• Level 2 – Observable inputs, other than Level 1 prices, such as<br />
quoted prices in active markets for similar assets and<br />
liabilities in markets that are not active, or other inputs that are<br />
observable or can be corroborated by observable inputs.<br />
• Level 3 – Unobservable inputs that are supported by little or<br />
no market activity and that are significant to the fair value of<br />
the assets or liabilities. This includes certain pricing models,<br />
OPNET Technologies, Inc. <strong>2011</strong> <strong>Annual</strong> <strong>Report</strong><br />
34<br />
discounted cash flow methodologies and similar techniques<br />
that use significant unobservable inputs.<br />
The lowest level of significant input determines the placement of<br />
the entire fair value measurement in the hierarchy.<br />
Software Development costs. Development costs incurred in the<br />
research and development of new software products and enhancements<br />
to existing software products are expensed as incurred<br />
until technological feasibility has been e stablished. The Company<br />
considers technological feasibility to be established when all planning,<br />
designing, coding, and testing has been completed according<br />
to design specifications. After technological feasibility has been<br />
established, any additional costs are capitalized in accordance with<br />
ASC 985 Software, or ASC 985. Through March 31, <strong>2011</strong>, software<br />
development has been substantially completed concurrently with<br />
the establishment of technological feasibility and, accordingly, no<br />
costs have been capitalized to date.<br />
Property and Equipment. Property and equipment are stated at<br />
cost. Depreciation on property and equipment is computed using<br />
the straight-line method over the estimated useful lives of the assets,<br />
of five to seven years. Leasehold improvements are depreciated<br />
over the shorter of the estimated useful life of the assets, the noncancelable<br />
term of the related lease, or the non-cancelable lease<br />
term plus all periods for which executive management believes that<br />
the failure to renew the lease imposes a penalty in an amount such<br />
that the renewal appears, at the inception of the lease, to be reasonably<br />
assured. Repairs and maintenance are expensed as incurred.<br />
intangible assets. The Company accounts for its goodwill and<br />
intangible assets in accordance with ASC 805 Business Combinations,<br />
or ASC 805, and ASC 350 Intangibles – Goodwill and Other,<br />
or ASC 350. The acquired and purchased technology are stated<br />
at the lower of unamortized cost or net realizable value and are<br />
amortized on a straight-line basis over their expected useful lives<br />
of three to five years. The Company’s customer relationship and<br />
workforce intangible assets are amortized on an accelerated basis<br />
over their expected useful lives of four and one-half years and five<br />
years, respectively. The Company uses the projected discounted<br />
cash flow method in valuing its acquired technology and purchased<br />
customer relationships using certain assumptions including<br />
revenue growth, cost levels, present value discount rate, and<br />
working capital requirements. The Company uses the lower of the<br />
amount of cash paid or the present value of projected discounted<br />
cash flows to value purchased technology. The workforce asset was<br />
valued on a replacement cost basis. While the Company believes<br />
the assumptions used to value its acquired technology related to<br />
acquisitions are reasonable, actual results will likely differ from those<br />
assumptions. Future cash flows are subject to change for a variety<br />
of internal and external factors. The Company periodically reviews<br />
the value of acquired technology and purchased intangible assets
for reasonableness in accordance with ASC 360 Property, Plant and<br />
Equipment, or ASC 360. If changes in the Company’s assumptions<br />
at the time of future periodic reviews indicate that the carrying<br />
value of its acquired technology and purchased intangible assets<br />
exceeds their fair value and it determines that carrying amounts can<br />
not be recovered, it would result in impairment losses. As of March<br />
31, <strong>2011</strong> and 2010, intangible assets totaled $4.5 million and $5.1<br />
million, net of accumulated amortization of $11.9 million and $9.7<br />
million, respectively. There has been no impairment as of March 31,<br />
<strong>2011</strong> or 2010.<br />
Goodwill. In accordance with ASC 350, goodwill is not amortized<br />
but is tested for impairment annually during the Company’s fourth<br />
quarter and whenever events and circumstances occur indicating<br />
that the asset might be impaired. The Company performed its annual<br />
impairment test of goodwill as of March 31, <strong>2011</strong> and 2010 and<br />
concluded that the fair value exceeded the carrying value; therefore,<br />
it did not record any impairment. The Company has not recorded a<br />
goodwill impairment since it first recorded goodwill in fiscal 2001.<br />
Valuation of long-lived assets. In accordance with ASC 360,<br />
the Company reviews its long-lived assets, including property and<br />
equipment, for impairment whenever events or changes in circumstances<br />
indicate that the carrying amounts of the assets may not be<br />
fully recoverable. If the total of the expected undiscounted future net<br />
cash flows is less than the carrying amount of the asset, a loss is recognized<br />
for the difference between the fair value and carrying amount of<br />
the asset. There has been no impairment as of March 31, <strong>2011</strong> or 2010.<br />
Revenue Recognition. The Company derives revenue from three<br />
primary sources: (1) product, (2) product updates, technical support<br />
and services, which include product updates, training services on a<br />
when-and-if-available basis, and technical support, and (3) professional<br />
services, which include consulting and custom training<br />
services for customers without a current maintenance agreement.<br />
The Company recognizes revenue based on the provisions of ASC<br />
605-985 Software Revenue Recognition, or ASC 605-985.<br />
proDuCT revenue<br />
Product revenue represents all fees earned from granting customers<br />
perpetual and term licenses to use the Company’s software as<br />
well as the hardware that it uses to deliver its AppResponse Xpert<br />
software products. It excludes revenue derived from product<br />
updates, which are included in product updates, technical support<br />
and services revenue. For the years ended March 31, <strong>2011</strong>, 2010,<br />
and 2009, perpetual licenses represented approximately 91%,<br />
92%, and 93% of product revenue, respectively. Product revenue<br />
is recognized when the following four criteria are met: (i) persuasive<br />
evidence of an arrangement exists, (ii) delivery of the software<br />
has occurred, (iii) the product fee is fixed or determinable, and (iv)<br />
collectibility is probable. The Company defines each of these four<br />
criteria as follows:<br />
OPNET Technologies, Inc. <strong>2011</strong> <strong>Annual</strong> <strong>Report</strong><br />
35<br />
• Persuasive evidence of an arrangement exists. For license<br />
arrangements with end-users, it is the Company’s customary<br />
practice to have a written software license agreement, which is<br />
signed by both the end user and the Company, and a purchase<br />
order or equivalent. A written contract can be executed based<br />
on the customer-specific format or on the standard “shrink wrap”<br />
software master license agreement. For those end users who<br />
have previously negotiated a software license agreement with<br />
the Company, the initial software license agreement is used as<br />
evidence of a written contract. Sales to distributors, resellers,<br />
and value-added resellers, which the Company collectively refers<br />
to as resellers, are evidenced by a master reseller agreement<br />
governing the relationship, which is signed by both the reseller<br />
and the Company, together with a purchase order on a transaction-by-transaction<br />
basis. To further evidence an arrangement,<br />
the Company’s master reseller agreement requires that the<br />
reseller provide the Company copies of the end user’s executed<br />
software master license agreements.<br />
• Delivery has occurred. Physical delivery of the Company’s<br />
software products to end users or resellers, which are collectively<br />
referred to as customers, is generally considered to have<br />
occurred upon the transfer of media containing the Company’s<br />
software products to a common carrier (usually FOB shipping<br />
point based on standard agreement terms). Software licenses<br />
may also be delivered electronically to end users. Electronic<br />
delivery is deemed to occur after end users have been provided<br />
with access codes that allow them to take immediate possession<br />
of the software. If a software arrangement includes undelivered<br />
software products or services that are essential to the functionality<br />
of delivered software products, delivery is not considered<br />
to have occurred until these software products or services are<br />
delivered.<br />
• The fee is fixed or determinable. It is the Company’s policy to<br />
not provide customers the right to any adjustments or refund<br />
of any portion of their license fees paid, acceptance provisions,<br />
cancellation privileges, or rights of return. The Company’s<br />
normal payment terms for its software products and services<br />
currently range from net 30 days to net 90 days and primarily<br />
vary based on the country in which an agreement is executed.<br />
Payments that extend beyond the Company’s normal payment<br />
terms from the contract date but that are due within six months<br />
are generally deemed to be fixed or determinable based on its<br />
successful collection history on such arrangements, and thereby<br />
satisfy the required criteria for revenue recognition. Arrangements<br />
with payment terms extending beyond six months are<br />
considered not to be fixed or determinable, and revenue from<br />
such arrangements is recognized as payments become due and<br />
payable.
• collectibility is probable. Collectibility is assessed on a<br />
customer-by-customer basis. The Company typically sells to customers<br />
for whom there is a history of successful collection. New<br />
customers are subject to a credit review process that evaluates<br />
the customer’s ability to pay. If the Company determines from<br />
the outset of an arrangement that collectibility is not probable,<br />
revenue is recognized as cash is collected.<br />
In instances when any of the four criteria are not met, the Company<br />
defers recognition of product revenue until the criteria are met.<br />
When the sale of the software product requires the Company to<br />
make significant enhancements, customization or modifications to<br />
the software that are essential to its functionality, product revenue<br />
and consulting fees are recognized using contract accounting under<br />
ASC 605-35 Revenue Recognition – Construction-Type and Production,<br />
or ASC 605-35. The Company estimates the percentage-ofcompletion,<br />
under ASC 605-35, based on its estimate of total hours<br />
to complete the project as a percentage of total hours incurred and<br />
the estimated hours to complete.<br />
The process of estimation inherent in the application of the<br />
percentage-of-completion method of accounting for revenue is<br />
subject to judgments and uncertainties and may affect the amounts<br />
of product revenue and professional services revenue under certain<br />
contracts and related expenses reported in the Company’s consolidated<br />
financial statements. A number of internal and external<br />
factors can affect the Company’s estimates to complete client<br />
engagements, including skill level and experience of project managers,<br />
staff assigned to engagements, and continuity and attrition<br />
level of professional services staff. Changes in the estimated stage<br />
of completion of a particular project could create variability in the<br />
Company’s revenue and results of operations if the Company is<br />
required to increase or decrease previously recognized revenue<br />
related to a particular project or if the Company expects to incur a<br />
loss on the project.<br />
All fees billed to clients for shipping and handling are classified as<br />
product revenue. All costs associated with shipping and handling<br />
are classified as cost of product revenue.<br />
proDuCT upDaTe, TeChniCal supporT, anD serviCes revenue<br />
Product updates, technical support and services revenue represents<br />
fees associated with the sale of product updates, training, and technical<br />
support, all provided on a when-and-if-available basis (except<br />
for technical support) under the Company’s maintenance agreement.<br />
Payments for product updates, technical support and services<br />
on initial order or on renewal are generally made in advance and are<br />
nonrefundable. Product updates consist of the right to unspecified<br />
software updates on a when-and-if-available basis and are typically<br />
entered into in connection with the initial software product<br />
purchase. Product updates, technical support and services may<br />
be renewed upon expiration of the term. Customers can purchase<br />
OPNET Technologies, Inc. <strong>2011</strong> <strong>Annual</strong> <strong>Report</strong><br />
36<br />
product updates separately from technical support and services.<br />
Revenue from product updates, technical support and services is<br />
deferred and recognized as revenue on a straight-line basis over the<br />
term of the maintenance agreement.<br />
Revenue under multiple-element arrangements, which typically<br />
include product, consulting services, training and maintenance<br />
agreements sold together, are allocated to each element in the arrangement<br />
primarily using the residual method based upon the fair<br />
value of the undelivered elements, which is specific to the Company<br />
vendor-specific objective evidence of fair value, or VSOE. This<br />
means that the Company defers revenue from the arrangement fee<br />
equivalent to the fair value of the undelivered elements. Discounts,<br />
if any, are applied to the delivered elements, usually product, under<br />
the residual method. For periodic unspecified product updates<br />
and technical support agreements, VSOE is based upon either the<br />
renewal rate specified in each contract or the price charged when<br />
sold separately. For consulting services and training for customers<br />
without a current maintenance agreement, VSOE is based upon the<br />
rates charged for these services when sold separately.<br />
If the Company is unable to establish VSOE for an undelivered<br />
post-contract customer support, or PCS, element, for example, in a<br />
two-year term license where the license term and PCS are coterminous<br />
and no PCS renewal period exists, all revenue is recognized ratably<br />
over the contract period. For income statement classification<br />
purposes, the Company’s allocation methodology is based on VSOE<br />
of fair value for its professional services which is determined by the<br />
price charged when sold separately, and the contractually stated<br />
renewal rates for its PCS, generally 18% to 21% of the license fee<br />
paid, on perpetual licenses. The Company uses the residual method<br />
to allocate any remaining arrangement fee to product revenue.<br />
professional serviCes revenue<br />
Professional services revenue consists of fees from consulting<br />
services and training for customers without a current maintenance<br />
agreement and is recognized as the services are performed. When<br />
the Company enters into consulting service arrangements that<br />
include significant modifications to the software that are essential<br />
to the customer’s use and the arrangement is bundled with software,<br />
revenue under the entire arrangement is recognized under<br />
the percentage-of-completion method. For income statement<br />
classification purposes, the Company has developed a revenue<br />
allocation methodology for these arrangements that is consistent<br />
with the residual method used, and described under ASC 605-985,<br />
when services are not essential to the functionality of the software.<br />
In these circumstances, revenue is allocated to the various elements<br />
of the arrangement based on the Company’s VSOE of fair value and<br />
the residual amount is allocated to product revenue.<br />
The Company sells product, product updates, technical support and<br />
services agreements to distributors at predetermined prices. Sales
to distributors are not contingent upon resale of the software to the<br />
end user. In most cases, the Company provides product updates,<br />
technical support and services agreements directly to distributors<br />
and the distributors provide support to the end customer. Revenue<br />
from sales to distributors is recorded at the amounts charged to the<br />
distributor and in the same manner as product, product updates,<br />
technical support and services sales sold through the Company’s<br />
direct sales force. Amounts received in advance of revenue recognition<br />
are classified as deferred revenue.<br />
Sales taxes and other taxes collected from customers and remitted<br />
to governmental authorities are presented on a net basis, and as<br />
such, are excluded from revenues.<br />
allowance for Doubtful accounts. The Company maintains an<br />
allowance for doubtful accounts receivable for estimated losses<br />
resulting from the inability of its customers to make required<br />
payments and for the limited circumstances when the customer<br />
disputes the amounts due the Company. The Company’s methodology<br />
for determining this allowance requires significant estimates.<br />
In estimating the allowance, the Company considers the age of the<br />
receivable, the creditworthiness of the customer, the economic conditions<br />
of the customer’s industry and general economic conditions.<br />
income Taxes. Income taxes are accounted for in accordance with<br />
ASC 740. The income tax provision includes income taxes currently<br />
payable plus the net change during the year in deferred tax assets<br />
or liabilities. Under ASC 740, deferred tax assets and liabilities reflect<br />
the differences between the carrying value under GAAP and the tax<br />
basis of assets and liabilities using enacted statutory tax rates in effect<br />
for the period in which the differences are expected to reverse.<br />
Judgments and estimates are required in the calculation of the<br />
deferred tax assets, valuation allowance, research and development<br />
tax credits, and foreign tax credits.<br />
ASC 740 prescribes a recognition threshold of more-likely-than-not,<br />
and a measurement attribute for all tax positions taken or expected<br />
to be taken on a tax return, in order for these positions to be recognized<br />
in the financial statements. The Company continually reviews<br />
tax laws, regulations and guidance in order to properly record any<br />
uncertain tax positions.<br />
Foreign currency Transactions. Revenue and expenses denominated<br />
in foreign currencies are translated at the average exchange<br />
rates during the period. Gains or losses on foreign exchange transactions<br />
are reported in the consolidated statements of operations.<br />
Foreign currency Translation. The results of operations for the<br />
Company’s international subsidiaries are translated from the designated<br />
functional currencies into United States dollars using average<br />
exchange rates during each period. Assets and liabilities are translated<br />
using exchange rates at the end of each period. Translation<br />
gains and losses are reported as a component of accumulated other<br />
comprehensive loss in stockholders’ equity.<br />
OPNET Technologies, Inc. <strong>2011</strong> <strong>Annual</strong> <strong>Report</strong><br />
37<br />
comprehensive income. Certain revenues, expenses, gains and<br />
losses are recognized in comprehensive income but excluded from<br />
net income. Comprehensive income includes net income, foreign<br />
currency translation adjustments, and unrealized gains and losses<br />
on marketable securities.<br />
Earnings per Share. The Company accounts for earnings per share,<br />
or EPS, in accordance with ASC 260 Earnings per Share, or ASC 260.<br />
ASC 260 states that unvested share-based payment awards that<br />
contain nonforfeitable rights to dividends or dividend equivalents<br />
(whether paid or unpaid) are participating securities and shall be<br />
included in the computation of EPS pursuant to the two-class method.<br />
FSP EITF 03-6-1, “Determining Whether Instruments Granted in<br />
Share-Based Payment Transactions are Participating Securities” (as<br />
codified in ASC 260) is effective for fiscal years beginning after December<br />
15, 2008. The Company applied the provisions of FSP EITF<br />
03-6-1 in fiscal 2010. The Company’s participating securities include<br />
nonvested restricted stock. FSP EITF 03-6-1 was applied retrospectively<br />
and therefore prior period information was adjusted.<br />
Stock-Based compensation. The Company accounts for stockbased<br />
compensation given to employees in accordance with ASC<br />
718 Compensation – Stock Compensation, or ASC 718. ASC 718<br />
requires all share-based payments and nonvested shares (restricted<br />
stock) issued to employees, including grants of employee stock<br />
options, to be valued at fair value on the date of grant, and to be<br />
expensed over the applicable vesting period.<br />
reCenTly issueD aCCounTing pronounCemenTs<br />
In October 2009, the Financial Accounting Standards Board, or FASB,<br />
issued Accounting Standards Update, or ASU 2009-14, “Certain<br />
Revenue Arrangement That Include Software Elements,” (included<br />
in Accounting Standards Codification, or ASC, 985 “Software”) and<br />
ASU, 2009-13, “Multiple Deliverable Revenue Arrangements,” which<br />
amends EITF Issue No. 08-1, “Revenue Arrangements With Multiple<br />
Deliverables” (as codified in ASC 605 “Revenue Recognition”). ASU<br />
2009-14 amends the scoping guidance for software arrangements<br />
to exclude tangible products that contain software elements and<br />
nonsoftware elements that function together to interdependently<br />
deliver the product’s essential functionality. ASU 2009-13 amends<br />
the current guidance on arrangements with multiple elements to (1)<br />
eliminate the separation criterion that requires entities to establish<br />
objective and reliable evidence of fair value for undelivered elements,<br />
(2) establish a selling price hierarchy to help entities allocate<br />
arrangement consideration to the separate units of account, (3)<br />
require the relative selling price allocation method for all arrangements<br />
(i.e., eliminate the residual method), and (4) significantly<br />
expand required disclosures. ASU 2009-14 and ASU 2009-13 will<br />
be effective for the first annual reporting period beginning on or<br />
after June 15, 2010, which the Company adopted on April 1, <strong>2011</strong>.<br />
Early adoption is permitted. The Company has determined that ASU
2009-14 and ASU 2009-13 will not have a material impact on its<br />
results of operations or financial condition.<br />
In December 2010, FASB issued ASU 2010-29, “Disclosure of Supplementary<br />
Pro Forma Information for Business Combinations (as<br />
codified in ASC 805 “Business Combinations”). The objective of ASU<br />
2010-29 is to address diversity in practice about the interpretation<br />
of the pro forma revenue and earnings disclosure requirements for<br />
business combinations. The amendments in this update specify<br />
that if a public entity presents comparative financial statements, the<br />
entity should disclose revenue and earnings of the combined entity<br />
as though the business combination that occurred during the year<br />
had occurred as of the beginning of the comparable prior annual<br />
reporting period only. The amendments also expand the supplemental<br />
pro forma disclosures under Topic 805 “Business Combinations”<br />
to include a description of the nature and amount of material,<br />
nonrecurring pro forma adjustments directly attributable to the<br />
business combination included in the reported pro forma revenue<br />
and earnings. ASU 2010-29 will be effective prospectively for business<br />
combinations for which the acquisition date is on or after the<br />
beginning of the first annual reporting period after December 15,<br />
2010. Early adoption is permitted. The Company will be impacted<br />
by ASU 2010-29 if it makes an acquisition that is accounted for as a<br />
business combination.<br />
2. sToCK-baseD CompensaTion<br />
In September 2009, the Company’s stockholders approved the<br />
adoption of the 2010 Stock Incentive Plan, or the 2010 Plan, in<br />
response to the pending expiration of the Company’s Amended<br />
and Restated 2000 Stock Incentive Plan, or the 2000 Plan. The 2010<br />
Plan provides for the granting of stock options, restricted stock and<br />
other stock-based awards to employees, officers, directors, consultants<br />
and advisors. Subject to specified adjustments, the number of<br />
shares initially set aside and reserved for issuance under the 2010<br />
Plan is 2,150,000 shares, which approximated the number of shares<br />
available for issuance under the 2000 Plan as of January 1, 2010, the<br />
effective date of the 2010 Plan. The Board approved a resolution to<br />
make no further grants for options or stock awards under the 2000<br />
Plan upon approval of the 2010 Plan.<br />
The number of shares available for issuance under the 2010 Plan<br />
will automatically increase from time to time by a number equal<br />
to (i) in the event any outstanding stock option granted under the<br />
2000 Plan should for any reason expire or otherwise terminate, in<br />
whole or in part, without having been exercised in full, the number<br />
of shares that are not acquired under such stock option and (ii) in<br />
the event stock that has been issued to a participant under the 2000<br />
Plan pursuant to restricted or unrestricted stock awards is subsequently<br />
forfeited or acquired by the Company as a result of a failure<br />
to vest or satisfy any other contingency, the number of such shares.<br />
The maximum aggregate number of additional shares that may<br />
become available for issuance in these situations is 2,000,000 shares,<br />
OPNET Technologies, Inc. <strong>2011</strong> <strong>Annual</strong> <strong>Report</strong><br />
38<br />
subject to specified adjustments.<br />
The number of shares available for issuance under the 2010 Plan<br />
will automatically increase on the first trading day of each calendar<br />
year, beginning with <strong>2011</strong> and continuing through the term of the<br />
2010 Plan, by an amount equal to the lesser of (i) three percent (3%)<br />
of the shares of the Company’s common stock outstanding on the<br />
last trading day of the preceding calendar year, or (ii) an amount<br />
determined by the Board; provided, however, that in no event shall<br />
any such annual increase exceed 1,000,000 shares. This provision,<br />
commonly referred to as an “evergreen” provision, is similar to the<br />
provision in the 2000 Plan.<br />
Options granted pursuant to the 2010 Plan will be exercisable at<br />
such times and subject to such terms and conditions as the Board<br />
may specify in the applicable option agreement, but no option may<br />
be granted for a term in excess of 10 years. The terms and conditions<br />
of any restricted stock awards granted under the 2010 Plan,<br />
including the conditions for repurchase or forfeiture and the issue<br />
price, if any, will be determined by the Board. The Board also has<br />
the right to grant other stock awards pursuant to the 2010 Plan<br />
having such terms and conditions as the Board may determine,<br />
including the grant of fully vested shares, the grant of securities<br />
convertible into shares of the Company’s common stock and the<br />
grant of stock appreciation rights.<br />
ASC 718 requires an entity to recognize an expense within its income<br />
statement for all share-based payment arrangements, which<br />
includes employee stock option plans, restricted stock grants, and<br />
employee stock purchase plans. The Company has elected to use<br />
straight-line amortization of stock-based compensation expense for<br />
the entire award over the service period since the awards have only<br />
service conditions and graded vesting.<br />
Compensation cost for option grants is recognized on a straight-line<br />
basis over the requisite service period for the entire award (from<br />
the date of grant through the period of the last separately vesting<br />
portion of the grant). Compensation cost is recognized within the<br />
income statement in the same expense line as the cash compensation<br />
paid to the respective employees. ASC 718 also requires the<br />
Company to estimate forfeitures in calculating the expense related<br />
to stock-based compensation. The impact on compensation cost<br />
due to changes in the expected forfeiture rate will be recognized in<br />
the period that they become known. The Company has concluded<br />
that its historical forfeiture rate is the best measure to estimate future<br />
forfeitures of granted stock options. The impact on compensation<br />
cost due to changes in the expected forfeiture rate of 10% will<br />
be recognized in the period that they become known. The Company<br />
does not apply a forfeiture rate to the options granted to certain key<br />
executives or directors. The Company has concluded that historically<br />
certain key executives and directors will perform the requisite<br />
service to vest in the award.
Excess tax benefits from the exercise of stock options are presented<br />
as a cash flow from financing activity. For fiscal <strong>2011</strong>, 2010, and<br />
2009, excess tax benefits from the exercise of stock options were<br />
$1.5 million, $51,000, and $49,000, respectively.<br />
A summary of the total stock-based compensation expense for fiscal<br />
<strong>2011</strong>, 2010, and 2009 is as follows:<br />
<strong>2011</strong> 2010 2009<br />
Restricted stock $ 1,316<br />
(in thousands)<br />
$ 941 $ 917<br />
ESPP shares 467 490 444<br />
Stock options 206 128 172<br />
Total stock-based compensation $ 1,989 $ 1,559 $ 1,533<br />
Stock Options<br />
OPNET Technologies, Inc. <strong>2011</strong> <strong>Annual</strong> <strong>Report</strong><br />
39<br />
A summary of the total nonvested stock-based deferred compensation<br />
at March 31, <strong>2011</strong> and 2010 is as follows:<br />
<strong>2011</strong> 2010<br />
(in thousands)<br />
Restricted stock $ 2,336 $ 1,178<br />
Stock options 710 916<br />
ESPP shares<br />
Total nonvested stock-based<br />
197 139<br />
deferred compensation $ 3,243 $ 2,233<br />
The deferred compensation associated with the nonvested restricted<br />
stock, stock options and ESPP shares at March 31, <strong>2011</strong> are<br />
expected to be recognized over a weighted average period of 1<br />
year, 2 years, and 4 months, respectively.<br />
The Company’s stock option grants are accounted for as equity awards. The expense is based on the grant-date fair value of the options<br />
granted, and is recognized over the requisite service period.<br />
A summary of the option transactions for fiscal <strong>2011</strong>, 2010, and 2009 is as follows:<br />
Weighted Weighted<br />
Weighted Average Aggregate Average<br />
Average Remaining Intrinsic Grant Date<br />
Options Exercise Price Contract Life Value Fair Value<br />
<strong>2011</strong> (years) (in thousands)<br />
Outstanding at beginning of period 2,494,082 $ 10.86 — $ 68,797 $ 7.31<br />
Granted — $ — — $ — $ —<br />
Exercised (1,250,735) $ 11.39 — $ 10,443 $ 8.24<br />
Forfeited or expired (111,350) $ 19.50 — $ 2,109 $ 13.30<br />
Outstanding at end of period 1,131,997 $ 9.42 3.39 $ 32,851 $ 5.70<br />
Exercisable at end of period 856,997 $ 9.30 1.77 $ 24,972 $ 6.19<br />
Nonvested at end of period 275,000 $ 9.79 8.44 $ 7,879 $ 4.17<br />
Nonvested expected to be exercised 247,500 $ 9.79 8.45 $ 7,227 $ 4.17<br />
2010<br />
Outstanding at beginning of period 2,556,723 $ 10.89 — $ 13,569 $ 7.62<br />
Granted 275,000 $ 9.79 — $ 1,719 $ 4.17<br />
Exercised (277,110) $ 9.82 — $ 1,112 $ 6.80<br />
Forfeited or expired (60,531) $ 12.11 — $ 248 $ 8.53<br />
Outstanding at end of period 2,494,082 $ 10.86 2.82 $ 13,314 $ 7.31<br />
Exercisable at end of period 2,219,082 $ 10.99 2.00 $ 11,596 $ 7.70<br />
Nonvested at end of period 275,000 $ 9.79 9.44 $ 1,719 $ 4.17<br />
2009<br />
Outstanding at beginning of period 2,720,121 $ 10.79 — $ 1,473 $ 7.56<br />
Granted — $ — — $ — $ —<br />
Exercised (92,648) $ 6.95 — $ 459 $ 4.88<br />
Forfeited or expired (70,750) $ 12.45 — $ 3 $ 8.90<br />
Outstanding at end of period 2,556,723 $ 10.89 2.94 $ 1,283 $ 7.62<br />
Exercisable at end of period 2,556,723 $ 10.89 2.94 $ 1,283 $ 7.62<br />
Nonvested at end of period — $ — — $ — $ —
To estimate the grant-date fair value of its stock options, the<br />
Company uses the Black-Scholes option-pricing model. The Black-<br />
Scholes model estimates the per share fair value of an option on its<br />
date of grant based on the following; the option’s exercise price;<br />
the price of the underlying stock on the date of grant; the estimated<br />
dividend yield; a “risk-free” interest rate; the estimated option term;<br />
and the expected volatility. For the “risk-free” interest rate, the<br />
Company uses a United States Treasury Bond due in the number of<br />
years equal to the option’s expected term. The estimated option<br />
term is calculated based upon the simplified method set out in ASC<br />
718 - Compensation – Stock Compensation. The Company uses the<br />
simplified method to determine the estimated option term because<br />
it lacks sufficient historical share option exercise data. To determine<br />
expected volatility, the Company analyzes the historical volatility of<br />
its stock over the expected term of the option.<br />
The Company granted 275,000 stock options during fiscal 2010.<br />
The Company did not grant any stock options during fiscal <strong>2011</strong> or<br />
fiscal 2009. No stock options vested during fiscal <strong>2011</strong> or 2010. The<br />
weighted average assumptions used to determine the grant-date<br />
fair value for stock options for fiscal 2010 are as follows:<br />
2010<br />
Risk-free interest rate 3.07%<br />
Expected dividend yield 3.68%<br />
Expected life 7 years<br />
Volatility factor 58%<br />
During fiscal <strong>2011</strong>, 2010, and 2009, the Company received proceeds<br />
of approximately $14.2 million, $2.7 million, and $644,000, respectively,<br />
and issued 1,250,735, 277,110, and 92,648 shares of common<br />
stock, respectively, pursuant to employee exercises of stock options.<br />
Restricted Stock<br />
The Company’s restricted stock grants are accounted for as equity<br />
awards. The expense is based on the price of the Company’s common<br />
stock on the date the restricted stock award is granted, and is<br />
recognized on a straight-line basis over the requisite service period.<br />
The Company’s restricted stock agreements do not contain any<br />
post-vesting restrictions.<br />
A summary of the restricted stock grants is as follows:<br />
Restricted<br />
Weighted Average<br />
Grant Date<br />
<strong>2011</strong> Stock Grants Fair Value<br />
Nonvested at beginning of period 183,797 $ 10.87<br />
Granted 114,340 $ 22.97<br />
Vested (105,967) $ 12.05<br />
Forfeited (1,557) $ 13.44<br />
Nonvested at end of period 190,613 $ 17.45<br />
Nonvested expected to vest 174,333 $ 17.42<br />
OPNET Technologies, Inc. <strong>2011</strong> <strong>Annual</strong> <strong>Report</strong><br />
40<br />
Restricted<br />
Weighted Average<br />
Grant Date<br />
2010 Stock Grants Fair Value<br />
Nonvested at beginning of period 235,562 $ 10.66<br />
Granted 55,856 $ 12.01<br />
Vested (87,872) $ 11.31<br />
Forfeited (19,749) $ 9.64<br />
Nonvested at end of period 183,797 $ 10.87<br />
Restricted<br />
Weighted Average<br />
Grant Date<br />
2009 Stock Grants Fair Value<br />
Nonvested at beginning of period 213,177 $ 11.07<br />
Granted 87,070 $ 10.27<br />
Vested (61,370) $ 11.55<br />
Forfeited (3,315) $ 10.85<br />
Nonvested at end of period 235,562 $ 10.66<br />
Employee Stock Purchase Plan<br />
The Company’s 2000 Employee Stock Purchase Plan, or ESPP, provides<br />
all eligible employees to collectively purchase up to a total of<br />
3,070,000 shares of its common stock. On September 14, 2009, the<br />
stockholders voted to increase the number of shares authorized for<br />
issuance under the ESPP from 820,000 shares to 3,070,000 shares,<br />
effective February 1, 2010. An employee may authorize a payroll deduction<br />
up to a maximum of 10% of his or her compensation during<br />
the plan period. The purchase price for each share purchased is the<br />
lesser of 85% of the closing price of the common stock on the first<br />
or last day of the plan period. The plan period for the ESPP ends on<br />
the last day of January and July of each year.<br />
To estimate the fair value of shares issued under its ESPP, the<br />
Company uses the Black-Scholes option-pricing model. The Black-<br />
Scholes model estimates the per share fair value of an ESPP share<br />
at the beginning of the plan period based on the following: the<br />
price of the underlying stock on the first day of the plan period; the<br />
estimated dividend yield; a “risk-free” interest rate; the term of the<br />
plan period (six months); and the expected volatility. For the “riskfree”<br />
interest rate, the Company uses a United States Treasury Bond<br />
due in six months. To determine expected volatility, the Company<br />
analyzes the historical volatility of its stock over the 6 months prior<br />
to the first day of the plan period.<br />
A total of 132,933, 170,271, and 150,712 shares of the Company’s<br />
common stock were issued under the ESPP in fiscal <strong>2011</strong>, 2010, and<br />
2009, respectively. The issuance of the common stock resulted in<br />
proceeds to the Company of $1.5 million, $1.3 million, and $1.1 million,<br />
respectively.<br />
The weighted average assumptions to determine the value for ESPP<br />
shares for fiscal <strong>2011</strong>, 2010, and 2009 are as follows:
OPNET Technologies, Inc. <strong>2011</strong> <strong>Annual</strong> <strong>Report</strong><br />
Plan Period Plan Period Plan Period Plan Period Plan Period Plan Period<br />
Starting Starting Starting Starting Starting Starting<br />
February <strong>2011</strong> August 2010 February 2010 August 2009 February 2009 August 2008<br />
Risk-free interest rate 0.18% 0.20% 0.17% 0.28 % 0.39% 1.88%<br />
Expected dividend yield 1.35% 2.60% 2.95% 3.70% 0.00% 0.00%<br />
Expected life 0.5 years 0.5 years 0.5 years 0.5 years 0.5 years 0.5 years<br />
Volatility factor 51% 40% 41% 70 % 88% 42%<br />
3. aCquisiTion of DsauDiTor from embarCaDero TeChnologies, inC.<br />
On August 25, 2010, the Company acquired substantially all the assets<br />
associated with the DSAuditor product line from Embarcadero<br />
Technologies, Inc., or Embarcadero, a privately held software company<br />
headquartered in San Francisco, California. The Company paid<br />
approximately $2.3 million cash to Embarcadero to acquire such<br />
assets. An initial payment of $25,000 was made in September 2009,<br />
and the remaining purchase price of $2.25 million was made in<br />
August 2010. DSAuditor is a software product that provides visibility<br />
into database activity and performance. The acquisition contributed<br />
key capabilities to the Company’s product portfolio for application<br />
performance management.<br />
41<br />
The DSAuditor product line acquisition was accounted for as a<br />
business combination in accordance with the guidance outlined in<br />
ASC Topic 805. The operating results associated with the DSAuditor<br />
product line from August 25, 2010 and the transaction-related<br />
professional services costs have been included in the Company’s<br />
condensed consolidated statements of operations for the year<br />
ended March 31, <strong>2011</strong>. The acquisition date fair value of the total<br />
consideration transferred was approximately $2.3 million.<br />
The following table summarizes the estimated fair values of the<br />
DSAuditor product line acquired and liabilities assumed on the<br />
acquisition date:<br />
At August 25, 2010<br />
(in thousands)<br />
Amortization Method Useful Life<br />
Property and equipment, net $14 Straight-line 1 month – 3 years<br />
Deferred revenue<br />
identifiable intangible assets:<br />
(79)<br />
Developed technology – DS Auditor 1,458 Straight-line 5 years<br />
Trade names and trademark 47 Straight-line 5 years<br />
Customer relationships 27 Straight-line 5 years<br />
Non-compete agreements 16 Straight-line 1 year<br />
Total identifiable assets 1,483<br />
Goodwill 767<br />
Net assets acquired $ 2,250<br />
intangible assets<br />
Intangible assets consist primarily of the developed technology<br />
associated with the DSAuditor product acquired. The Company<br />
determined that estimated acquisition date fair value of the DSAuditor<br />
developed technology was approximately $1.5 million. The Company<br />
utilized an income approach known as the Relief-From-Royalty<br />
Method to value the acquired developed technology assets.<br />
Goodwill<br />
The excess of the consideration transferred over the fair values assigned<br />
to the assets acquired and liabilities assumed was $767,000,<br />
which represents the goodwill resulting from the acquisition. The<br />
Company will test goodwill for impairment on an annual basis, or<br />
sooner if deemed necessary. As of March 31, <strong>2011</strong>, there were no<br />
changes in the recognized amount of goodwill resulting from the<br />
acquisition of the DSAuditor product line.<br />
4. marKeTable seCuriTies<br />
At March 31, <strong>2011</strong>, marketable securities consisted of United States<br />
Treasury bills and United States Treasury notes with original maturities<br />
greater than three months and less than one year. The Company<br />
did not hold any marketable securities at March 31, 2010.<br />
The following table summarizes the Company’s marketable securities<br />
at March 31, <strong>2011</strong>:<br />
March 31, <strong>2011</strong><br />
Amortized Gross Unrealized Market<br />
Cost Gains<br />
(in thousands)<br />
Value<br />
United States<br />
government obligations $ 31,428 $ 4 $ 31,432<br />
Total $ 31,428 $ 4 $ 31,432
5. fair value<br />
OPNET Technologies, Inc. <strong>2011</strong> <strong>Annual</strong> <strong>Report</strong><br />
The following table details the fair value measurements within the three levels of fair value hierarchy of the Company’s financial assets,<br />
consisting of cash, cash equivalents, and marketable securities at March 31, <strong>2011</strong> and 2010:<br />
Fair Value Measurement at March 31, <strong>2011</strong> Using Total Fair Value Level 1 Level 2 Level 3<br />
(in thousands)<br />
Cash $ 30,821 $ 30,821 $ — $ —<br />
Money market funds<br />
United States government obligations<br />
48,976 48,976 — —<br />
included in cash & cash equivalents<br />
United States government obligations<br />
3,499 3,499 — —<br />
included in marketable securities 31,432 31,432 — —<br />
Total $ 114,728 $ 114,728 $ — $ —<br />
Fair Value Measurement at March 31, 2010 Using Total Fair Value Level 1 Level 2 Level 3<br />
(in thousands)<br />
Cash $ 21,545 $ 21,545 $ — $ —<br />
Money market funds 83,136 83,136 — —<br />
Total $ 104,681 $ 104,681 $ — $ —<br />
At March 31, <strong>2011</strong> and 2010, the Company valued money market funds and United States government obligations using a Level 1 valuation<br />
because market prices in active markets for identical assets were readily available. The per-share net asset value of the Company’s money<br />
market funds has remained at a constant amount of $1.00 per share. Also, as of March 31, <strong>2011</strong> and 2010, there were no withdrawal limits<br />
on redemptions for any of the money market funds that the Company holds. The Company did not value any financial assets using Level 2<br />
or Level 3 valuations at March 31, <strong>2011</strong> or 2010.<br />
6. inTangible asseTs anD gooDwill<br />
Intangible assets consisted of the following:<br />
March 31, <strong>2011</strong><br />
(in thousands)<br />
Carrying Accumulated Net<br />
Value Amortization Value<br />
intangible asset<br />
Acquired and purchased technology $ 14,823 $ 10,556 $ 4,267<br />
Customer relationships 724 635 89<br />
Acquired workforce asset 838 687 151<br />
Total $ 16,385 $ 11,878 $ 4,507<br />
March 31, 2010<br />
(in thousands)<br />
Carrying Accumulated Net<br />
Value Amortization Value<br />
intangible asset<br />
Acquired and purchased technology $13,275 $ 8,596 $ 4,679<br />
Customer relationships 724 545 179<br />
Acquired workforce asset 837 586 251<br />
Total $ 14,836 $ 9,727 $ 5,109<br />
Acquired and purchased intangible assets resulted in amortization<br />
expense for fiscal <strong>2011</strong>, 2010 and 2009 of $2.2 million, $2.0<br />
million, and $2.4 million, respectively. Amortization expense from<br />
42<br />
acquired and purchased technology and customer relationships is<br />
included in cost of revenue in the consolidated statements of operations.<br />
Amortization expense from the acquired workforce asset is<br />
included in research and development expenses in the consolidated<br />
statements of operations. The Company amortizes acquired and<br />
purchased technology on a straight-line basis over their expected<br />
useful lives of three to five years. The customer relationships and<br />
workforce assets that the Company purchased from Network Physics<br />
are amortized on an accelerated basis over their expected useful<br />
lives of four and one-half years and five years, respectively. The<br />
Company currently expects future amortization expense attributable<br />
to these intangible assets of $2.2 million in fiscal 2012, $1.3<br />
million in fiscal 2013, $487,000 in fiscal 2014, $351,000 in fiscal 2015,<br />
and $102,000 in fiscal 2016.<br />
Goodwill is primarily derived from the Company’s acquisitions of DS<br />
Auditor in August 2010, Altaworks in October 2004, WDM NetDesign<br />
in January 2002, and NetMaker in March 2001. The Company<br />
has made no impairment adjustment to goodwill since recording<br />
goodwill in fiscal 2001.
7. properTy anD equipmenT<br />
Property and equipment consisted of the following at March 31,<br />
<strong>2011</strong> and 2010:<br />
<strong>2011</strong> 2010<br />
(in thousands)<br />
Computer equipment $ 13,499 $ 11,389<br />
Leasehold improvements 10,150 10,038<br />
Construction in progress 71 —<br />
Purchased software 4,428 4,331<br />
Office furniture and equipment 1,776 1,770<br />
Total 29,924 27,528<br />
Less: accumulated depreciation (17,223) (14,283)<br />
Property and equipment, net $ 12,701 $ 13,245<br />
Depreciation expense for fiscal <strong>2011</strong>, 2010, and 2009 was $3.6 million,<br />
$3.4 million, and $3.1 million, respectively.<br />
8. aCCrueD liabiliTies<br />
Accrued liabilities consisted of the following at March 31, <strong>2011</strong> and<br />
2010:<br />
<strong>2011</strong><br />
(in thousands)<br />
2010<br />
Accrued compensation and bonuses $ 9,361 $ 6,867<br />
Accrued sales tax/VAT 1,222 500<br />
Accrued inventory 990 815<br />
Other 3,125 2,750<br />
Total $ 14,698 $ 10,932<br />
9. inCome Taxes<br />
The components of the provision for income taxes for the years<br />
ended March 31, <strong>2011</strong>, 2010, and 2009, were as follows:<br />
<strong>2011</strong> 2010 2009<br />
(in thousands)<br />
current provision:<br />
Federal $ 5,390 $ 1,832 $ 2,164<br />
State 1,501 544 744<br />
Foreign 356 166 451<br />
Total current provision 7,247 2,542 3,359<br />
Deferred benefit:<br />
Federal (804) (339) (320)<br />
State (179) (58) (88)<br />
Foreign (14) 69 (23)<br />
Total deferred benefit (997) (328) (431)<br />
Total provision for income taxes $ 6,250 $ 2,214 $ 2,928<br />
OPNET Technologies, Inc. <strong>2011</strong> <strong>Annual</strong> <strong>Report</strong><br />
43<br />
At March 31, <strong>2011</strong> and 2010, the components of the Company’s<br />
deferred tax assets and deferred tax liabilities were as follows:<br />
<strong>2011</strong> 2010<br />
(in thousands)<br />
Deferred tax assets:<br />
Accrued expenses $ 1,587 $ 1,623<br />
Deferred revenue 1,232 1,183<br />
In-process research and development 99 119<br />
Deferred rent<br />
Research and development<br />
991 978<br />
tax credit carryforward<br />
Accelerated book amortization<br />
1,252 1,224<br />
of acquired technology 2,496 1,901<br />
Bad debt reserve 133 129<br />
Federal net operating loss carryforward 12,833 12,887<br />
Foreign net operating loss carryforward — 7<br />
Deferred stock based compensation 784 831<br />
Other temporary differences 22 25<br />
Gross deferred tax assets 21,429 20,907<br />
Less: valuation allowance (13,289) (13,289)<br />
Total deferred tax asset 8,140 7,618<br />
Deferred tax liabilities:<br />
Tax amortization of goodwill (2,815) (2,522)<br />
Accelerated depreciation<br />
Tax accounting for unbilled<br />
(450) (335)<br />
accounts receivable (131) (1,053)<br />
Total deferred tax liabilities (3,396) (3,910)<br />
Net deferred tax asset $ 4,744 $ 3,708<br />
ASC 740 requires that the Company assess the realizability of deferred<br />
tax assets at the end of each reporting period. These assessments<br />
generally consider several factors including the reversal of<br />
existing deferred tax asset and liability temporary differences, projected<br />
future taxable income, tax planning strategies, and historical<br />
and future book income adjusted for permanent book to tax differences.<br />
As stated below, the Company has established a valuation<br />
allowance related to a portion of the deferred tax asset associated<br />
with the Altaworks transaction due to limitations under Section 382<br />
of the Internal Revenue Code. The Company believes that it is more<br />
likely than not that the remaining net deferred tax asset of $4.7 million<br />
will be realized, based upon its history of profitability, estimates<br />
of future taxable income, and the period over which the tax benefits<br />
can be realized.<br />
The provision for income taxes for fiscal <strong>2011</strong>, 2010, and 2009<br />
differs from the amount computed by applying the statutory United<br />
States Federal income tax rate to income before taxes as a result of<br />
the following:
OPNET Technologies, Inc. <strong>2011</strong> <strong>Annual</strong> <strong>Report</strong><br />
<strong>2011</strong> 2010 2009<br />
Statutory United States Federal rate 34.0% 34.0% 34.0%<br />
Increase (decrease) in taxes resulting from:<br />
State income taxes<br />
—net of Federal benefit 4.5 4.8 4.7<br />
Nondeductible meals and entertainment 0.4 0.7 0.6<br />
Nondeductible fines and penalties 0.1 0.4 —<br />
Nondeductible expenses - other — — 0.1<br />
Nondeductible stock compensation 0.4 2.1 2.0<br />
Section 199 deduction (1.9) (2.2) (2.4)<br />
Tax credits<br />
Provision to return true-ups<br />
(5.4) (10.7) (7.1)<br />
(permanent items) 0.6 (1.5) 3.5<br />
Foreign tax expense 0.9 0.8 2.4<br />
Changes in carrying rate of deferreds — 0.2 —<br />
Other 0.7 0.1 1.2<br />
Uncertain tax positions (0.1) (0.3) (0.4)<br />
Foreign tax rate differential (0.7) (0.9) (0.4)<br />
Effective tax rate 33.5% 27.5% 38.2%<br />
The increase in the Company’s effective tax rate in fiscal <strong>2011</strong><br />
from fiscal 2010 was primarily due to a decrease in tax credits as a<br />
percentage of pre-tax net income. The decrease in the Company’s<br />
effective tax rate in fiscal 2010 from fiscal 2009 was primarily due to<br />
an increase in tax credits and a decrease in foreign tax expense.<br />
As part of the Altaworks Corporation acquisition, the Company<br />
received a federal net operating loss carryforward of approximately<br />
$38.8 million and a research and development credit carryforward<br />
of approximately $1.2 million. The related deferred tax assets at<br />
March 31, <strong>2011</strong> total $14.0 million and will expire between 2019<br />
and 2024. These tax assets are subject to an annual limitation under<br />
Section 382 of the Internal Revenue Code. Because of the limitation<br />
imposed, management believes it is more likely than not that a<br />
portion of the assets will not be realized and has placed a valuation<br />
allowance of $13.3 million against that portion.<br />
At March 31, <strong>2011</strong>, the Company had cumulative undistributed<br />
earnings of foreign subsidiaries, for which no United States income<br />
or foreign withholding taxes have been recorded, of approximately<br />
$4.1 million, which have been reinvested indefinitely. Determination<br />
of the amount of unrecognized deferred tax liability with<br />
respect to such earnings is not practicable. The additional taxes on<br />
the earnings of foreign subsidiaries, if remitted, would be partially<br />
offset by United States tax credits for foreign taxes already paid.<br />
ASC 740 prescribes a recognition threshold of more-likely-than-not,<br />
and a measurement attribute for all tax positions taken or expected<br />
to be taken on a tax return, in order for these positions to be recognized<br />
in the financial statements. The Company continually reviews<br />
tax laws, regulations and guidance in order to properly record any<br />
uncertain tax positions. At March 31, <strong>2011</strong>, the gross unrecognized<br />
44<br />
benefit related to uncertain tax positions was $691,000, $669,000<br />
of which would favorably affect the effective income tax rate in<br />
future periods. The total amount of gross unrecognized tax benefits<br />
related to uncertain tax benefits as of April 1, 2010 was $786,000. Of<br />
this total, $761,000 represents the amount of unrecognized tax benefits<br />
(net of federal benefit on state issues) that, if recognized, would<br />
favorably affect the effective income tax rate in any future periods.<br />
A reconciliation of the beginning and ending amount of unrecognized<br />
tax benefits for fiscal <strong>2011</strong>, 2010, and 2009 follows:<br />
<strong>2011</strong> 2010 2009<br />
(in thousands)<br />
Beginning balance $ 786 $ 804 $ 838<br />
Gross decreases<br />
– prior period tax positions — 45 —<br />
Gross increases<br />
– current period tax positions 154 150 139<br />
Gross increases<br />
– prior period tax positions 60 — —<br />
Settlements (106) (19) —<br />
Lapse of statute of limitations (203) (197) (159)<br />
Foreign currency<br />
translation adjustment — 3 (14)<br />
Ending balance $ 691 $ 786 $ 804<br />
The following table summarizes the tax years that are either cur-<br />
rently under audit or remain open under the statute of limitations<br />
and are subject to examination by the tax authorities in the most<br />
significant jurisdictions that the Company operates:<br />
Australia FY08 – FY09<br />
Belgium FY08 – FY10<br />
France FY07 – FY10<br />
Germany FY05 – FY09<br />
Singapore FY08 – FY10<br />
United Kingdom FY10<br />
United States FY08 – FY10<br />
Maryland FY07 – FY10<br />
The Company’s continuing practice is to recognize interest, if any,<br />
related to income tax matters in interest expense in its consolidated<br />
statements of operations and penalties as part of general and<br />
administrative expense in its consolidated statements of operations.<br />
During fiscal <strong>2011</strong>, the Company recognized $9,000 in potential<br />
interest expense associated with uncertain tax positions. During<br />
fiscal 2010, the Company recognized $6,000 in potential interest<br />
expense associated with uncertain tax positions and reversed<br />
$13,000 associated with potential claims barred by the statute of<br />
limitations. During fiscal 2009, the Company recognized $4,000 in<br />
potential interest expense associated with uncertain tax positions
and reversed $17,000 associated with potential claims barred by the<br />
statute of limitations. The total accrued interest and accrued penalties<br />
related to uncertain tax positions at March 31, <strong>2011</strong> was $17,000<br />
and $107,000, respectively.<br />
The Company believes it is reasonably possible that changes in<br />
the liability for uncertain tax positions will occur in the next twelve<br />
months as a result of final decisions related to the voluntary payments<br />
of its state and local income taxes. In the aggregate, the Company<br />
believes the liability for uncertain tax positions could decrease<br />
by $30,000 in the next twelve months.<br />
The Company is currently under an income tax audit in Germany for<br />
fiscal 2005 through 2007.<br />
10. CommiTmenTs anD ConTingenCies<br />
The Company’s corporate office and principal facilities are located<br />
in Bethesda, Maryland and consist of approximately 82,000 square<br />
feet of office space held under two leases. The office space consists<br />
of approximately 60,000 square feet and has been renewed through<br />
January 31, 2021, exclusive of renewal options. The lease provides<br />
for one renewal option (at the option of the landlord) for not less<br />
than three and one half years and not more than ten years. The<br />
lease also provides for a short-term extension at January 31, 2021<br />
(at the option of the tenant) of three months. The monthly rent<br />
for the first lease year is $201,000, and is subject to escalation of<br />
3.75% each year. The lease also requires the Company to maintain<br />
a security deposit of approximately $471,000 in the form of a bank<br />
letter of credit.<br />
In addition, the Company leases additional office space under<br />
non-cancelable operating leases. The leases for office space contain<br />
escalation clauses that provide for increased rentals based primarily<br />
on increases in real estate taxes, operating expenses, or the<br />
consumer price index. Total rent expense under all leases for fiscal<br />
<strong>2011</strong>, 2010, and 2009 was $5.2 million, $5.1 million, and $5.0 million,<br />
respectively. At March 31, <strong>2011</strong>, future minimum lease payments required<br />
under non-cancelable leases were as follows (in thousands):<br />
Year ending March 31,<br />
2012 $ 5,050<br />
2013 5,234<br />
2014 4,831<br />
2015 4,838<br />
2016 4,790<br />
Thereafter 22,644<br />
Total minimum lease payments $ 47,387<br />
The Company accounts for guarantees in accordance with ASC 460<br />
Guarantees, or ASC 460. ASC 460 elaborates on the disclosures required<br />
in financial statements concerning obligations under certain<br />
guarantees. It also clarifies the requirements related to the recognition<br />
of liabilities by a guarantor at the inception of certain guaran-<br />
OPNET Technologies, Inc. <strong>2011</strong> <strong>Annual</strong> <strong>Report</strong><br />
45<br />
tees. The provisions related to recognizing a liability at inception of<br />
the guarantee do not apply to product warranties or indemnification<br />
provisions in the Company’s software license agreements.<br />
Under the terms of substantially all of the Company’s license agreements,<br />
it has agreed to defend and pay any final judgment against<br />
its customers arising from claims against such customers that the<br />
Company’s software products infringe the intellectual property<br />
rights of a third party. To date: i) the Company has not received<br />
any notice that any customer is subject to an infringement claim<br />
arising from the use of its software products, ii) the Company has<br />
not received any request to defend any customers from infringement<br />
claims arising from the use of its software products, and iii)<br />
the Company has not paid any final judgment on behalf of any<br />
customer related to an infringement claim arising from the use of its<br />
software products. Because the outcome of infringement disputes<br />
are related to the specific facts in each case, and given the lack of<br />
previous or current indemnification claims, the Company cannot<br />
estimate the maximum amount of potential future payments, if any,<br />
related to its indemnification provisions. However, the Company<br />
reasonably believes these indemnification provisions will not have<br />
a material adverse effect on its operating performance or financial<br />
condition. As of March 31, <strong>2011</strong>, the Company has not recorded any<br />
liabilities related to these indemnifications.<br />
The Company’s standard license agreement includes a warranty<br />
provision for software products. The Company generally warrants<br />
for the first ninety days after delivery that the software shall operate<br />
substantially as stated in the then current documentation provided<br />
that the software is used in a supported computer system. The<br />
Company provides for the estimated cost of product warranties<br />
based on specific warranty claims, provided that it is probable that a<br />
liability exists and provided the amount can be reasonably estimated.<br />
To date, the Company has not had any material costs associated<br />
with these warranties.<br />
The Company is involved in other claims and legal proceedings<br />
arising from its normal operations. The Company does not expect<br />
these matters, individually or in the aggregate, to have a material<br />
effect on its financial condition, results of operations, or cash flows.<br />
11. CreDiT agreemenTs anD noTes payable<br />
Effective June 10, 2002, the Company entered into a credit facility<br />
with a commercial bank. The credit facility permitted the use of<br />
funds for general corporate purposes and the issuance of letters<br />
of credit up to a maximum of $10.0 million in the aggregate. As<br />
of March 31, <strong>2011</strong>, the lender under our credit facility had issued<br />
letters of credit in favor of the beneficiaries under a number of our<br />
operating leases and a guarantee to satisfactorily complete a longterm<br />
professional services contract in the aggregate amount of $3.5<br />
million. The long-term professional services contract was completed<br />
in fiscal 2012. Upon a default, as defined in the respective office
lease agreement, the applicable landlord has the right to draw upon<br />
its letter of credit in whole or in part. Interest under this facility,<br />
including interest on any amounts drawn under the letters of credit,<br />
is payable monthly at an annual rate of 1.25%. The credit facility is<br />
collateralized by the Company’s accounts receivable.<br />
12. employee benefiT plan<br />
Effective August 1, 1993, the Company established a 401(k) retirement<br />
plan, or the Plan, covering all eligible employees, as defined.<br />
Eligible employees who are at least 21 years old may participate.<br />
Under the terms of the Plan, participants may defer a portion of<br />
their salaries as employee contributions. The Company makes<br />
matching contributions and may make discretionary contributions.<br />
Employee contributions and discretionary contributions made by<br />
the Company are 100% vested immediately. In general, the Company’s<br />
matching and discretionary contributions vest ratably over<br />
OPNET Technologies, Inc. <strong>2011</strong> <strong>Annual</strong> <strong>Report</strong><br />
46<br />
a five-year period. The Company’s expense under this Plan for fiscal<br />
<strong>2011</strong>, 2010, and 2009 was $1.3 million, $1.1 million, and $1.4 million,<br />
respectively.<br />
13. earnings per share<br />
On April 1, 2009, the Company adopted FSP EITF 03-6-1 (as codified<br />
in ASC 260). This FSP addresses whether awards granted in sharebased<br />
transactions are participating securities prior to vesting and<br />
therefore need to be included in the earning allocation in computing<br />
earnings per share using the two-class method under ASC 260.<br />
FSP EITF 03-6-1 requires nonvested share-based payment awards<br />
that have non-forfeitable rights to dividends or dividend equivalents<br />
to be treated as a separate class of securities in calculating<br />
earnings per share. The Company’s participating securities include<br />
nonvested restricted stock. FSP EITF 03-6-1 was applied retrospectively<br />
and therefore prior period information was adjusted.<br />
The following is a reconciliation of the amounts used in calculating basic and diluted net income per common share for fiscal <strong>2011</strong>, 2010, and 2009:<br />
<strong>2011</strong> 2010 2009<br />
(dollars in thousands, except per share amounts)<br />
Net income (numerator):<br />
Basic and diluted net income attributable to common stockholders $ 12,401 $ 5,823 $ 4,732<br />
Dividends paid on nonvested restricted stock (183) (72) —<br />
Undistributed earnings attributable to nonvested restricted stock — — (44)<br />
Net income available to common stockholders excluding nonvested restricted stock $ 12,218 $ 5,751 $ 4,688<br />
Shares (denominator):<br />
Weighted average common shares outstanding – basic 21,428,618 20,529,036 20,296,165<br />
Effect of other dilutive securities - options 701,040 261,438 237,212<br />
Weighted average diluted shares outstanding 22,129,658 20,790,474 20,533,377<br />
Net income per common share:<br />
Basic $ 0.57 $ 0.28 $ 0.23<br />
Diluted $ 0.55 $ 0.28 $ 0.23<br />
The weighted average diluted shares outstanding during any<br />
period does not include shares issuable upon exercise of any stock<br />
option where the exercise price of the stock option is greater than<br />
the average market price because including them would be antidilutive.<br />
There were no options with an anti-dilutive effect during<br />
fiscal <strong>2011</strong>. Options for the purchase of 1,036,800 and 1,745,390<br />
common shares were excluded from the weighted average diluted<br />
shares outstanding for fiscal 2010 and 2009, respectively, because<br />
their effect was anti-dilutive.<br />
14. sToCKholDers’ equiTy<br />
Treasury Stock<br />
On January 31, 2005, the Company announced that the Board had<br />
authorized the repurchase of up to 1,000,000 shares of the Company’s<br />
common stock from time to time on the open market or in privately<br />
negotiated transactions. On February 4, 2008, the Company<br />
announced that the Board had authorized the repurchase of an<br />
additional 1,000,000 shares of the Company’s common stock under<br />
the stock repurchase program. This stock repurchase program does<br />
not have a specified termination date. Any repurchased shares will<br />
be available for use in connection with the Company’s stock plans<br />
or other corporate purposes. The Company expended $3.6 million,<br />
$2.3 million, and $955,000 to purchase 223,399, 186,550, and 75,724<br />
shares during fiscal <strong>2011</strong>, 2010, and 2009, respectively, at an average<br />
price of $16.26, $12.27, and $12.61.<br />
Restricted stock shares withheld from employees to satisfy the minimum<br />
statutory withholding obligations with respect to the income<br />
recognized by these employees upon the vesting of their restricted<br />
stock shares during the year are included in these totals.<br />
As of March 31, <strong>2011</strong>, the Company had repurchased 1,521,360<br />
shares of common stock under the stock repurchase program.
Dividend<br />
OPNET Technologies, Inc. <strong>2011</strong> <strong>Annual</strong> <strong>Report</strong><br />
The Company did not declare or pay any dividends in fiscal 2009. The following table summarizes the Company’s quarterly cash dividend<br />
payments for fiscal <strong>2011</strong> and 2010 and the one-time special dividend payment in November 2010:<br />
Declaration Date Stockholder Record Date Payment Date Amount per Share<br />
May 13, 2009 June 15, 2009 June 29, 2009 $0.09<br />
July 30, 2009 September 15, 2009 September 29, 2009 $0.09<br />
October 28, 2009 December 15, 2009 December 30, 2009 $0.09<br />
January 27, 2010 March 15, 2010 March 30, 2010 $0.09<br />
May 5, 2010 June 15, 2010 June 30, 2010 $0.10<br />
August 4, 2010 September 14, 2010 September 29, 2010 $0.10<br />
October 27, 2010 November 14, 2010 November 30, 2010 $0.75<br />
October 27, 2010 December 7, 2010 December 21, 2010 $0.10<br />
January 26, <strong>2011</strong> March 16, <strong>2011</strong> March 30, <strong>2011</strong> $0.10<br />
The declaration of cash dividends in the future is subject to final<br />
determination each quarter by the Board based on a number of<br />
factors, including the Company’s financial performance and available<br />
cash resources, its cash requirements and alternative uses of<br />
cash that the Board may conclude would represent an opportunity<br />
to generate a greater return on investment for the Company. The<br />
Board may decide that future dividends will be in amounts that are<br />
different than the amount described above or may decide to suspend<br />
or discontinue the payment of cash dividends altogether.<br />
15. Comprehensive inCome<br />
Comprehensive income includes net income, foreign currency translation<br />
adjustments, and net unrealized (losses)/gains on marketable<br />
securities. The components of comprehensive income for fiscal<br />
<strong>2011</strong>, 2010, and 2009, net of tax, are as follows:<br />
<strong>2011</strong> 2010 2009<br />
Net income<br />
Foreign currency<br />
$ 12,401 $ 5,823 $ 4,732<br />
translation adjustments<br />
Net unrealized gains<br />
346 172 (1,712)<br />
on marketable securities 4 — 381<br />
Total comprehensive income $ 12,751 $ 5,995 $ 3,401<br />
Accumulated other comprehensive loss includes foreign currency<br />
translation adjustments and net unrealized (losses)/gains on marketable<br />
securities. The components of accumulated other comprehensive<br />
(loss) income at March 31, <strong>2011</strong> and 2010, net of tax, are as<br />
follows:<br />
<strong>2011</strong> 2010<br />
Foreign currency translation adjustments $ (653) $ (999)<br />
Net unrealized gains on marketable securities 4 —<br />
Total accumulated other comprehensive loss $ (649) $ (999)<br />
47<br />
16. business segmenT anD geographiC area informaTion<br />
The Company operates in one industry segment, the development<br />
and sale of computer software programs and related services. The<br />
chief operating decision maker evaluates the performance of the<br />
Company using one industry segment. For the years ended March<br />
31, <strong>2011</strong>, 2010, and 2009, revenue from transactions with United<br />
States government agencies was approximately 32.5%, 39.9%, and<br />
35.3% of total revenue, respectively. No single customer accounted<br />
for 10% or more of revenue for fiscal <strong>2011</strong>, 2010, or 2009. In addition,<br />
there was no country, with the exception of the United States,<br />
where aggregate sales accounted for 10% or more of total revenue.<br />
The Company’s assets were primarily held in the United States for<br />
fiscal <strong>2011</strong>, 2010, and 2009.<br />
Revenue by geographic destination and as a percentage of total<br />
revenue for fiscal <strong>2011</strong>, 2010, and 2009 is as follows:<br />
<strong>2011</strong> 2010<br />
(in thousands)<br />
2009<br />
Geographic area by Destination<br />
United States $109,689 $ 97,955 $ 96,896<br />
International 38,297 28,392 25,983<br />
$147,986 $126,347 $122,879<br />
Geographic area by Destination<br />
United States 74.1% 77.5% 78.9%<br />
International 25.9 22.5 21.1<br />
100.0% 100.0% 100.0%
17. valuaTion anD qualifying aCCounTs<br />
OPNET Technologies, Inc. <strong>2011</strong> <strong>Annual</strong> <strong>Report</strong><br />
The following table sets forth activity in the Company’s valuation accounts:<br />
Balance at Balance at<br />
Beginning Charges to End of<br />
of Period Expenses Deductions (1) Period<br />
(in thousands)<br />
accounts receivable reserve account:<br />
Year ended March 31, <strong>2011</strong> $ 336 $ 558 $ (548) $ 346<br />
Year ended March 31, 2010 $ 713 $ 297 $ (674) $ 336<br />
Year ended March 31, 2009 $ 154 $ 646 $ (87) $ 713<br />
Deferred tax valuation account:<br />
Year ended March 31, <strong>2011</strong> $ 13,289 $ — $ — $ 13,289<br />
Year ended March 31, 2010 $ 13,289 $ — $ — $ 13,289<br />
Year ended March 31, 2009 $ 13,289 $ — $ — $ 13,289<br />
(1)Deductions represent write-offs of accounts receivable previously reserved and adjustments to reflect accounts receivable at net realizable<br />
value.<br />
18. quarTerly finanCial DaTa (unauDiTeD)<br />
Year Ended March 31, <strong>2011</strong> First Quarter Second Quarter Third Quarter Fourth Quarter<br />
(in thousands, except per share data)<br />
Revenue $ 31,085 $ 36,118 $ 39,678 $ 41,105<br />
Gross profit 23,744 27,667 31,274 32,515<br />
Income from operations 2,308 4,652 5,603 6,239<br />
Net income 1,339 2,916 4,324 3,822<br />
Basic net income per common share $ 0.06 $ 0.14 $ 0.19 $ 0.18<br />
Diluted net income per common share $ 0.06 $ 0.13 $ 0.19 $ 0.17<br />
Basic weighted average common shares outstanding 20,926 21,251 21,608 21,929<br />
Diluted weighted average common shares outstanding 21,562 21,788 22,230 22,507<br />
Year Ended March 31, 2010 First Quarter Second Quarter Third Quarter Fourth Quarter<br />
(in thousands, except per share data)<br />
Revenue $ 27,727 $ 30,628 $ 33,555 $ 34,437<br />
Gross profit 19,927 22,876 25,482 26,057<br />
(Loss) income from operations (624) 2,203 3,430 3,098<br />
Net (loss) income (359) 1,533 2,340 2,309<br />
Basic net (loss) income per common share $ (0.02) $ 0.07 $ 0.11 $ 0.12<br />
Diluted net (loss) income per common share $ (0.02) $ 0.07 $ 0.11 $ 0.12<br />
Basic weighted average common shares outstanding 20,439 20,520 20,536 20,622<br />
Diluted weighted average common shares outstanding 20,439 20,718 20,818 21,153<br />
48
19. inTeresT anD oTher (expense) inCome, neT<br />
The components of interest and other (expense) income, net, for<br />
fiscal <strong>2011</strong>, 2010, and 2009 were as follows:<br />
<strong>2011</strong> 2010 2009<br />
Interest income<br />
(in thousands)<br />
$ 90 $ 52 $1,004<br />
Interest expense (31) (4) (25)<br />
Other income — — 267<br />
Other expense (210) (118) —<br />
interest and other (expense) income, net $ (151) $ (70) $1,246<br />
20. subsequenT evenT<br />
On May 4, <strong>2011</strong>, the Board approved a quarterly cash dividend in<br />
the amount of $0.12 per share, which will be paid on June 29, <strong>2011</strong><br />
to stockholders of record as of the close of business on June 15,<br />
<strong>2011</strong>. The declaration of cash dividends in the future is subject to<br />
final determination each quarter by the Board based on a number<br />
of factors, including the Company’s financial performance and available<br />
cash resources, its cash requirements and alternative uses of<br />
cash that the Board may conclude would represent an opportunity<br />
to generate a greater return on investment for the Company. The<br />
Board may decide that future dividends will be in amounts that are<br />
different than the amount described above or may decide to suspend<br />
or discontinue the payment of cash dividends altogether.<br />
OPNET Technologies, Inc. <strong>2011</strong> <strong>Annual</strong> <strong>Report</strong><br />
49
OPNET Technologies, Inc. <strong>2011</strong> <strong>Annual</strong> <strong>Report</strong><br />
50
DIRECTORS<br />
Marc A. Cohen<br />
Chairman of the Board<br />
and Chief Executive Officer<br />
Alain J. Cohen<br />
President<br />
and Chief Technology Officer<br />
Steven G. Finn, Ph.D.<br />
Principal Research Scientist and<br />
Lecturer, Massachusetts Institute of<br />
Technology<br />
Ronald W. Kaiser<br />
Independent Director<br />
William F. Stasior<br />
Senior Chairman<br />
Booz Allen Hamilton, Inc.<br />
OPNET Technologies, Inc. <strong>2011</strong> <strong>Annual</strong> <strong>Report</strong><br />
ANNUAL MEETING<br />
The <strong>Annual</strong> Meeting of Stockholders will be held on Monday, September<br />
12, <strong>2011</strong> at OPNET Corporate Headquarters, 7255 Woodmont<br />
Avenue, Bethesda, Maryland 20814.<br />
FORM 10-K<br />
A copy of the Company’s <strong>Annual</strong> <strong>Report</strong> to the Securities and<br />
Exchange Commission on Form 10-K is available without charge on<br />
our Web site.<br />
MARKET INFORMATION<br />
Our common stock trades on the Nasdaq National Market under the<br />
symbol “OPNT.” The following table sets forth, on a per share basis,<br />
for the indicated periods, the high and low sale prices of our common<br />
stock as reported by the Nasdaq National Market.<br />
Quarterly Common Stock-Price for the Years Ended March 31<br />
<strong>2011</strong> 2010<br />
Quarter ended High Low High Low<br />
June 30 $ 17.12 $ 14.46 $ 10.75 $ 6.92<br />
September 30 19.60 13.01 11.56 8.24<br />
December 31 27.28 16.80 12.70 10.01<br />
March 31 39.00 24.38 16.20 11.70<br />
On May 4, <strong>2011</strong>, the Board approved a quarterly cash dividend in<br />
the amount of $0.12 per share, which was paid on June 29, <strong>2011</strong> to<br />
stockholders of record as of the close of business on June 15, <strong>2011</strong>.<br />
The declaration of cash dividends in the future is subject to final<br />
determination each quarter by the Board based on a number of<br />
factors, including our financial performance and available cash<br />
resources, our cash requirements and alternative uses of cash that<br />
the Board may conclude would represent an opportunity to generate<br />
a greater return on investment for us. The Board may decide<br />
that future dividends will be in amounts that are different than the<br />
amount described above or may decide to suspend or discontinue<br />
the payment of cash dividends altogether.<br />
COMPARATIVE STOCK PERFORMANCE<br />
The graph below compares the cumulative total stockholder return<br />
on the Common Stock of the Company from March 31, 2006 to<br />
March 31, <strong>2011</strong> with the cumulative total return of (i) the NASDAQ<br />
National Market and (ii) the NASDAQ Computer & Data Process-<br />
$400 ing Index. The graph assumes the investment of $100.00 on March<br />
31, 2006 in the Company’s Common Stock, the NASDAQ National<br />
Market, and the NASDAQ Computer & Data Processing Index, and in<br />
$300<br />
each case assumes that any dividends are reinvested.<br />
$200<br />
$400<br />
$100<br />
$300<br />
$0<br />
3/06<br />
$200<br />
$100<br />
$0<br />
3/06<br />
CORPORATE INFORMATION<br />
3/07 3/08 3/09<br />
3/07 3/08 3/09<br />
3/10 3/11<br />
3/10 3/11<br />
EXECUTIVE OFFICERS<br />
Marc A. Cohen<br />
Chairman of the Board<br />
and Chief Executive Officer<br />
Alain J. Cohen<br />
President<br />
and Chief Technology Officer<br />
Mel F. Wesley<br />
Vice President<br />
and Chief Financial Officer<br />
INVESTOR RELATIONS<br />
Mel F. Wesley<br />
ir@opnet.com<br />
INDEPENDENT AUDITOR<br />
Deloitte & Touche LLP<br />
1750 Tysons Boulevard<br />
McLean, VA 22102<br />
TRANSFER AGENT<br />
American Stock Transfer<br />
& Trust Company, LLC<br />
59 Maiden Lane<br />
Plaza Level<br />
New York, NY 10038<br />
LEGAL COUNSEL<br />
Cooley LLP<br />
One Freedom Square<br />
Reston Town Center<br />
11951 Freedom Drive<br />
Reston, Virginia 20190<br />
CORPORATE HEADQUARTERS<br />
OPNET Technologies, Inc.<br />
7255 Woodmont Avenue<br />
Bethesda, MD 20814<br />
(240) 497-3000<br />
ir@opnet.com<br />
www.opnet.com<br />
NASDAQ: OPNT<br />
OPNET Technologies, Inc.<br />
NASDAQ Composite<br />
NASDAQ Computer & Data Processing<br />
OPNET Technologies, Inc.<br />
* $100 NASDAQ invested Composite<br />
on 3/31/06 in stock or indexincluding<br />
reinvestment of dividends. Fiscal year<br />
ending NASDAQ March 31.<br />
Computer & Data Processing
ALL TRADEMARKS ARE THE PROPERTY OF THEIR RESPECTIVE OWNERS. © <strong>2011</strong> OPNET Technologies, Inc. All rights reserved.<br />
OPNET Technologies, Inc.<br />
7255 Woodmont Avenue<br />
Bethesda, Maryland 20814, USA<br />
phone: (240) 497-3000<br />
email: info@opnet.com<br />
Investor Relations: ir@opnet.com<br />
www.opnet.com