
You also want an ePaper? Increase the reach of your titles
YUMPU automatically turns print PDFs into web optimized ePapers that Google loves.
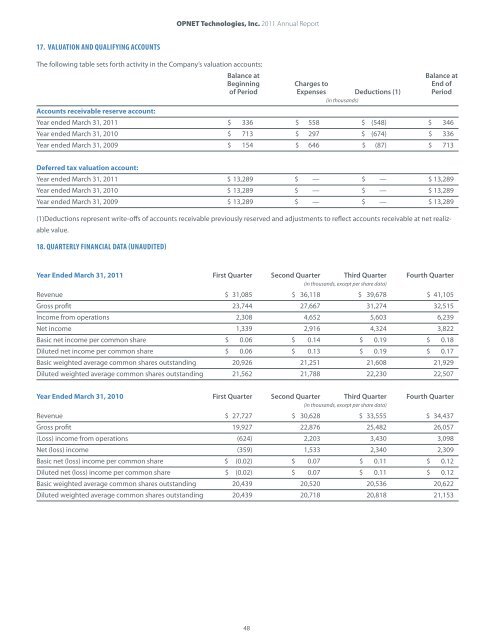
17. valuaTion anD qualifying aCCounTs<br />
OPNET Technologies, Inc. <strong>2011</strong> <strong>Annual</strong> <strong>Report</strong><br />
The following table sets forth activity in the Company’s valuation accounts:<br />
Balance at Balance at<br />
Beginning Charges to End of<br />
of Period Expenses Deductions (1) Period<br />
(in thousands)<br />
accounts receivable reserve account:<br />
Year ended March 31, <strong>2011</strong> $ 336 $ 558 $ (548) $ 346<br />
Year ended March 31, 2010 $ 713 $ 297 $ (674) $ 336<br />
Year ended March 31, 2009 $ 154 $ 646 $ (87) $ 713<br />
Deferred tax valuation account:<br />
Year ended March 31, <strong>2011</strong> $ 13,289 $ — $ — $ 13,289<br />
Year ended March 31, 2010 $ 13,289 $ — $ — $ 13,289<br />
Year ended March 31, 2009 $ 13,289 $ — $ — $ 13,289<br />
(1)Deductions represent write-offs of accounts receivable previously reserved and adjustments to reflect accounts receivable at net realizable<br />
value.<br />
18. quarTerly finanCial DaTa (unauDiTeD)<br />
Year Ended March 31, <strong>2011</strong> First Quarter Second Quarter Third Quarter Fourth Quarter<br />
(in thousands, except per share data)<br />
Revenue $ 31,085 $ 36,118 $ 39,678 $ 41,105<br />
Gross profit 23,744 27,667 31,274 32,515<br />
Income from operations 2,308 4,652 5,603 6,239<br />
Net income 1,339 2,916 4,324 3,822<br />
Basic net income per common share $ 0.06 $ 0.14 $ 0.19 $ 0.18<br />
Diluted net income per common share $ 0.06 $ 0.13 $ 0.19 $ 0.17<br />
Basic weighted average common shares outstanding 20,926 21,251 21,608 21,929<br />
Diluted weighted average common shares outstanding 21,562 21,788 22,230 22,507<br />
Year Ended March 31, 2010 First Quarter Second Quarter Third Quarter Fourth Quarter<br />
(in thousands, except per share data)<br />
Revenue $ 27,727 $ 30,628 $ 33,555 $ 34,437<br />
Gross profit 19,927 22,876 25,482 26,057<br />
(Loss) income from operations (624) 2,203 3,430 3,098<br />
Net (loss) income (359) 1,533 2,340 2,309<br />
Basic net (loss) income per common share $ (0.02) $ 0.07 $ 0.11 $ 0.12<br />
Diluted net (loss) income per common share $ (0.02) $ 0.07 $ 0.11 $ 0.12<br />
Basic weighted average common shares outstanding 20,439 20,520 20,536 20,622<br />
Diluted weighted average common shares outstanding 20,439 20,718 20,818 21,153<br />
48