
You also want an ePaper? Increase the reach of your titles
YUMPU automatically turns print PDFs into web optimized ePapers that Google loves.
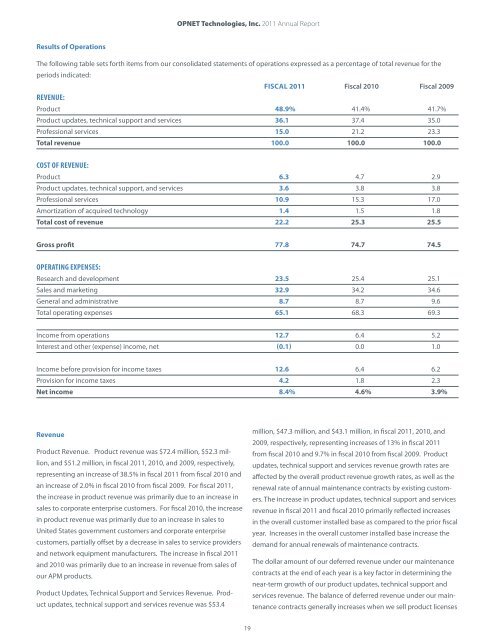
Results of Operations<br />
OPNET Technologies, Inc. <strong>2011</strong> <strong>Annual</strong> <strong>Report</strong><br />
The following table sets forth items from our consolidated statements of operations expressed as a percentage of total revenue for the<br />
periods indicated:<br />
FiScal <strong>2011</strong> Fiscal 2010 Fiscal 2009<br />
revenue:<br />
Product 48.9% 41.4% 41.7%<br />
Product updates, technical support and services 36.1 37.4 35.0<br />
Professional services 15.0 21.2 23.3<br />
Total revenue 100.0 100.0 100.0<br />
CosT of revenue:<br />
Product 6.3 4.7 2.9<br />
Product updates, technical support, and services 3.6 3.8 3.8<br />
Professional services 10.9 15.3 17.0<br />
Amortization of acquired technology 1.4 1.5 1.8<br />
Total cost of revenue 22.2 25.3 25.5<br />
Gross profit 77.8 74.7 74.5<br />
operaTing expenses:<br />
Research and development 23.5 25.4 25.1<br />
Sales and marketing 32.9 34.2 34.6<br />
General and administrative 8.7 8.7 9.6<br />
Total operating expenses 65.1 68.3 69.3<br />
Income from operations 12.7 6.4 5.2<br />
Interest and other (expense) income, net (0.1) 0.0 1.0<br />
Income before provision for income taxes 12.6 6.4 6.2<br />
Provision for income taxes 4.2 1.8 2.3<br />
Net income 8.4% 4.6% 3.9%<br />
Revenue<br />
Product Revenue. Product revenue was $72.4 million, $52.3 million,<br />
and $51.2 million, in fiscal <strong>2011</strong>, 2010, and 2009, respectively,<br />
representing an increase of 38.5% in fiscal <strong>2011</strong> from fiscal 2010 and<br />
an increase of 2.0% in fiscal 2010 from fiscal 2009. For fiscal <strong>2011</strong>,<br />
the increase in product revenue was primarily due to an increase in<br />
sales to corporate enterprise customers. For fiscal 2010, the increase<br />
in product revenue was primarily due to an increase in sales to<br />
United States government customers and corporate enterprise<br />
customers, partially offset by a decrease in sales to service providers<br />
and network equipment manufacturers. The increase in fiscal <strong>2011</strong><br />
and 2010 was primarily due to an increase in revenue from sales of<br />
our APM products.<br />
Product Updates, Technical Support and Services Revenue. Product<br />
updates, technical support and services revenue was $53.4<br />
19<br />
million, $47.3 million, and $43.1 million, in fiscal <strong>2011</strong>, 2010, and<br />
2009, respectively, representing increases of 13% in fiscal <strong>2011</strong><br />
from fiscal 2010 and 9.7% in fiscal 2010 from fiscal 2009. Product<br />
updates, technical support and services revenue growth rates are<br />
affected by the overall product revenue growth rates, as well as the<br />
renewal rate of annual maintenance contracts by existing customers.<br />
The increase in product updates, technical support and services<br />
revenue in fiscal <strong>2011</strong> and fiscal 2010 primarily reflected increases<br />
in the overall customer installed base as compared to the prior fiscal<br />
year. Increases in the overall customer installed base increase the<br />
demand for annual renewals of maintenance contracts.<br />
The dollar amount of our deferred revenue under our maintenance<br />
contracts at the end of each year is a key factor in determining the<br />
near-term growth of our product updates, technical support and<br />
services revenue. The balance of deferred revenue under our maintenance<br />
contracts generally increases when we sell product licenses