De novo transcriptome assembly with ABySS - Bioinformatics
De novo transcriptome assembly with ABySS - Bioinformatics
De novo transcriptome assembly with ABySS - Bioinformatics

You also want an ePaper? Increase the reach of your titles
YUMPU automatically turns print PDFs into web optimized ePapers that Google loves.
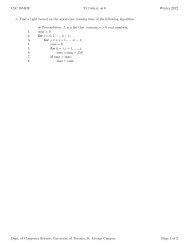
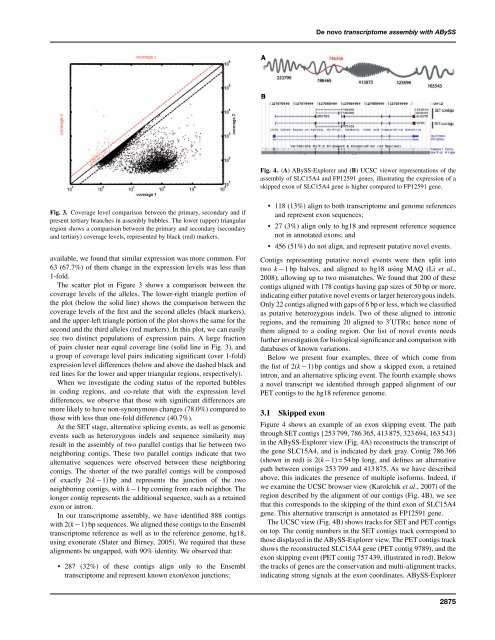
Fig. 3. Coverage level comparison between the primary, secondary and if<br />
present tertiary branches in <strong>assembly</strong> bubbles. The lower (upper) triangular<br />
region shows a comparison between the primary and secondary (secondary<br />
and tertiary) coverage levels, represented by black (red) markers.<br />
available, we found that similar expression was more common. For<br />
63 (67.7%) of them change in the expression levels was less than<br />
1-fold.<br />
The scatter plot in Figure 3 shows a comparison between the<br />
coverage levels of the alleles. The lower-right triangle portion of<br />
the plot (below the solid line) shows the comparison between the<br />
coverage levels of the first and the second alleles (black markers),<br />
and the upper-left triangle portion of the plot shows the same for the<br />
second and the third alleles (red markers). In this plot, we can easily<br />
see two distinct populations of expression pairs. A large fraction<br />
of pairs cluster near equal coverage line (solid line in Fig. 3), and<br />
a group of coverage level pairs indicating significant (over 1-fold)<br />
expression level differences (below and above the dashed black and<br />
red lines for the lower and upper triangular regions, respectively).<br />
When we investigate the coding status of the reported bubbles<br />
in coding regions, and co-relate that <strong>with</strong> the expression level<br />
differences, we observe that those <strong>with</strong> significant differences are<br />
more likely to have non-synonymous changes (78.0%) compared to<br />
those <strong>with</strong> less than one-fold difference (40.7%).<br />
At the SET stage, alternative splicing events, as well as genomic<br />
events such as heterozygous indels and sequence similarity may<br />
result in the <strong>assembly</strong> of two parallel contigs that lie between two<br />
neighboring contigs. These two parallel contigs indicate that two<br />
alternative sequences were observed between these neighboring<br />
contigs. The shorter of the two parallel contigs will be composed<br />
of exactly 2(k −1) bp and represents the junction of the two<br />
neighboring contigs, <strong>with</strong> k −1 bp coming from each neighbor. The<br />
longer contig represents the additional sequence, such as a retained<br />
exon or intron.<br />
In our <strong>transcriptome</strong> <strong>assembly</strong>, we have identified 888 contigs<br />
<strong>with</strong> 2(k −1) bp sequences. We aligned these contigs to the Ensembl<br />
<strong>transcriptome</strong> reference as well as to the reference genome, hg18,<br />
using exonerate (Slater and Birney, 2005). We required that these<br />
alignments be ungapped, <strong>with</strong> 90% identity. We observed that:<br />
287 (32%) of these contigs align only to the Ensembl<br />
<strong>transcriptome</strong> and represent known exon/exon junctions;<br />
<strong>De</strong> <strong>novo</strong> <strong>transcriptome</strong> <strong>assembly</strong> <strong>with</strong> <strong>ABySS</strong><br />
Fig. 4. (A) <strong>ABySS</strong>-Explorer and (B) UCSC viewer representations of the<br />
<strong>assembly</strong> of SLC15A4 and FP12591 genes, illustrating the expression of a<br />
skipped exon of SLC15A4 gene is higher compared to FP12591 gene.<br />
118 (13%) align to both <strong>transcriptome</strong> and genome references<br />
and represent exon sequences;<br />
27 (3%) align only to hg18 and represent reference sequence<br />
not in annotated exons; and<br />
456 (51%) do not align, and represent putative novel events.<br />
Contigs representing putative novel events were then split into<br />
two k −1 bp halves, and aligned to hg18 using MAQ (Li et al.,<br />
2008), allowing up to two mismatches. We found that 200 of these<br />
contigs aligned <strong>with</strong> 178 contigs having gap sizes of 50 bp or more,<br />
indicating either putative novel events or larger heterozygous indels.<br />
Only 22 contigs aligned <strong>with</strong> gaps of 6 bp or less, which we classified<br />
as putative heterozygous indels. Two of these aligned to intronic<br />
regions, and the remaining 20 aligned to 3 ′ UTRs; hence none of<br />
them aligned to a coding region. Our list of novel events needs<br />
further investigation for biological significance and comparison <strong>with</strong><br />
databases of known variations.<br />
Below we present four examples, three of which come from<br />
the list of 2(k −1) bp contigs and show a skipped exon, a retained<br />
intron, and an alternative splicing event. The fourth example shows<br />
a novel transcript we identified through gapped alignment of our<br />
PET contigs to the hg18 reference genome.<br />
3.1 Skipped exon<br />
Figure 4 shows an example of an exon skipping event. The path<br />
through SET contigs {253 799, 786 365, 413 875, 323 694, 163 543}<br />
in the <strong>ABySS</strong>-Explorer view (Fig. 4A) reconstructs the transcript of<br />
the gene SLC15A4, and is indicated by dark gray. Contig 786 366<br />
(shown in red) is 2(k −1) = 54 bp long, and defines an alternative<br />
path between contigs 253 799 and 413 875. As we have described<br />
above, this indicates the presence of multiple isoforms. Indeed, if<br />
we examine the UCSC browser view (Karolchik et al., 2007) of the<br />
region described by the alignment of our contigs (Fig. 4B), we see<br />
that this corresponds to the skipping of the third exon of SLC15A4<br />
gene. This alternative transcript is annotated as FP12591 gene.<br />
The UCSC view (Fig. 4B) shows tracks for SET and PET contigs<br />
on top. The contig numbers in the SET contigs track correspond to<br />
those displayed in the <strong>ABySS</strong>-Explorer view. The PET contigs track<br />
shows the reconstructed SLC15A4 gene (PET contig 9789), and the<br />
exon skipping event (PET contig 757 439, illustrated in red). Below<br />
the tracks of genes are the conservation and multi-alignment tracks,<br />
indicating strong signals at the exon coordinates. <strong>ABySS</strong>-Explorer<br />
2875