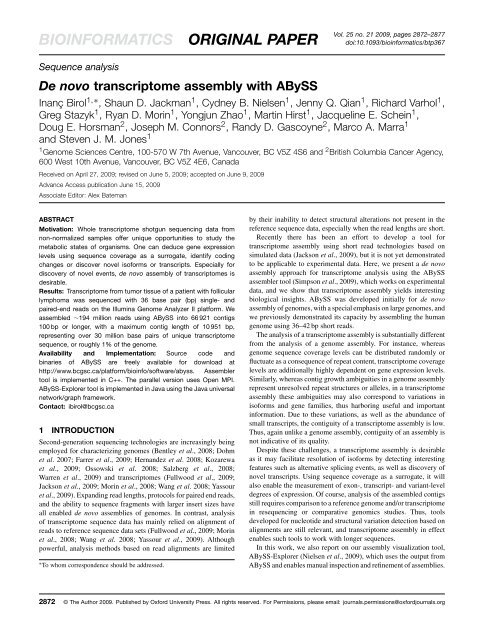
De novo transcriptome assembly with ABySS - Bioinformatics
De novo transcriptome assembly with ABySS - Bioinformatics
De novo transcriptome assembly with ABySS - Bioinformatics

You also want an ePaper? Increase the reach of your titles
YUMPU automatically turns print PDFs into web optimized ePapers that Google loves.
BIOINFORMATICS ORIGINAL PAPER<br />
Sequence analysis<br />
<strong>De</strong> <strong>novo</strong> <strong>transcriptome</strong> <strong>assembly</strong> <strong>with</strong> <strong>ABySS</strong><br />
Vol. 25 no. 21 2009, pages 2872–2877<br />
doi:10.1093/bioinformatics/btp367<br />
Inanç Birol 1,∗ , Shaun D. Jackman 1 , Cydney B. Nielsen 1 , Jenny Q. Qian 1 , Richard Varhol 1 ,<br />
Greg Stazyk 1 , Ryan D. Morin 1 , Yongjun Zhao 1 , Martin Hirst 1 , Jacqueline E. Schein 1 ,<br />
Doug E. Horsman 2 , Joseph M. Connors 2 , Randy D. Gascoyne 2 , Marco A. Marra 1<br />
and Steven J. M. Jones 1<br />
1 Genome Sciences Centre, 100-570 W 7th Avenue, Vancouver, BC V5Z 4S6 and 2 British Columbia Cancer Agency,<br />
600 West 10th Avenue, Vancouver, BC V5Z 4E6, Canada<br />
Received on April 27, 2009; revised on June 5, 2009; accepted on June 9, 2009<br />
Advance Access publication June 15, 2009<br />
Associate Editor: Alex Bateman<br />
ABSTRACT<br />
Motivation: Whole <strong>transcriptome</strong> shotgun sequencing data from<br />
non-normalized samples offer unique opportunities to study the<br />
metabolic states of organisms. One can deduce gene expression<br />
levels using sequence coverage as a surrogate, identify coding<br />
changes or discover novel isoforms or transcripts. Especially for<br />
discovery of novel events, de <strong>novo</strong> <strong>assembly</strong> of <strong>transcriptome</strong>s is<br />
desirable.<br />
Results: Transcriptome from tumor tissue of a patient <strong>with</strong> follicular<br />
lymphoma was sequenced <strong>with</strong> 36 base pair (bp) single- and<br />
paired-end reads on the Illumina Genome Analyzer II platform. We<br />
assembled ∼194 million reads using <strong>ABySS</strong> into 66 921 contigs<br />
100 bp or longer, <strong>with</strong> a maximum contig length of 10 951 bp,<br />
representing over 30 million base pairs of unique <strong>transcriptome</strong><br />
sequence, or roughly 1% of the genome.<br />
Availability and Implementation: Source code and<br />
binaries of <strong>ABySS</strong> are freely available for download at<br />
http://www.bcgsc.ca/platform/bioinfo/software/abyss. Assembler<br />
tool is implemented in C++. The parallel version uses Open MPI.<br />
<strong>ABySS</strong>-Explorer tool is implemented in Java using the Java universal<br />
network/graph framework.<br />
Contact: ibirol@bcgsc.ca<br />
1 INTRODUCTION<br />
Second-generation sequencing technologies are increasingly being<br />
employed for characterizing genomes (Bentley et al., 2008; Dohm<br />
et al. 2007; Farrer et al., 2009; Hernandez et al. 2008; Kozarewa<br />
et al., 2009; Ossowski et al. 2008; Salzberg et al., 2008;<br />
Warren et al., 2009) and <strong>transcriptome</strong>s (Fullwood et al., 2009;<br />
Jackson et al., 2009; Morin et al., 2008; Wang et al. 2008; Yassour<br />
et al., 2009). Expanding read lengths, protocols for paired end reads,<br />
and the ability to sequence fragments <strong>with</strong> larger insert sizes have<br />
all enabled de <strong>novo</strong> assemblies of genomes. In contrast, analysis<br />
of <strong>transcriptome</strong> sequence data has mainly relied on alignment of<br />
reads to reference sequence data sets (Fullwood et al., 2009; Morin<br />
et al., 2008; Wang et al. 2008; Yassour et al., 2009). Although<br />
powerful, analysis methods based on read alignments are limited<br />
∗ To whom correspondence should be addressed.<br />
by their inability to detect structural alterations not present in the<br />
reference sequence data, especially when the read lengths are short.<br />
Recently there has been an effort to develop a tool for<br />
<strong>transcriptome</strong> <strong>assembly</strong> using short read technologies based on<br />
simulated data (Jackson et al., 2009), but it is not yet demonstrated<br />
to be applicable to experimental data. Here, we present a de <strong>novo</strong><br />
<strong>assembly</strong> approach for <strong>transcriptome</strong> analysis using the <strong>ABySS</strong><br />
assembler tool (Simpson et al., 2009), which works on experimental<br />
data, and we show that <strong>transcriptome</strong> <strong>assembly</strong> yields interesting<br />
biological insights. <strong>ABySS</strong> was developed initially for de <strong>novo</strong><br />
<strong>assembly</strong> of genomes, <strong>with</strong> a special emphasis on large genomes, and<br />
we previously demonstrated its capacity by assembling the human<br />
genome using 36–42 bp short reads.<br />
The analysis of a <strong>transcriptome</strong> <strong>assembly</strong> is substantially different<br />
from the analysis of a genome <strong>assembly</strong>. For instance, whereas<br />
genome sequence coverage levels can be distributed randomly or<br />
fluctuate as a consequence of repeat content, <strong>transcriptome</strong> coverage<br />
levels are additionally highly dependent on gene expression levels.<br />
Similarly, whereas contig growth ambiguities in a genome <strong>assembly</strong><br />
represent unresolved repeat structures or alleles, in a <strong>transcriptome</strong><br />
<strong>assembly</strong> these ambiguities may also correspond to variations in<br />
isoforms and gene families, thus harboring useful and important<br />
information. Due to these variations, as well as the abundance of<br />
small transcripts, the contiguity of a <strong>transcriptome</strong> <strong>assembly</strong> is low.<br />
Thus, again unlike a genome <strong>assembly</strong>, contiguity of an <strong>assembly</strong> is<br />
not indicative of its quality.<br />
<strong>De</strong>spite these challenges, a <strong>transcriptome</strong> <strong>assembly</strong> is desirable<br />
as it may facilitate resolution of isoforms by detecting interesting<br />
features such as alternative splicing events, as well as discovery of<br />
novel transcripts. Using sequence coverage as a surrogate, it will<br />
also enable the measurement of exon-, transcript- and variant-level<br />
degrees of expression. Of course, analysis of the assembled contigs<br />
still requires comparison to a reference genome and/or <strong>transcriptome</strong><br />
in resequencing or comparative genomics studies. Thus, tools<br />
developed for nucleotide and structural variation detection based on<br />
alignments are still relevant, and <strong>transcriptome</strong> <strong>assembly</strong> in effect<br />
enables such tools to work <strong>with</strong> longer sequences.<br />
In this work, we also report on our <strong>assembly</strong> visualization tool,<br />
<strong>ABySS</strong>-Explorer (Nielsen et al., 2009), which uses the output from<br />
<strong>ABySS</strong> and enables manual inspection and refinement of assemblies.<br />
2872 © The Author 2009. Published by Oxford University Press. All rights reserved. For Permissions, please email: journals.permissions@oxfordjournals.org
Furthermore, it aids incorporation of additional data, such as pairedend<br />
sequencing data <strong>with</strong> longer inserts.<br />
We used <strong>ABySS</strong> to assemble the <strong>transcriptome</strong> of a follicular<br />
lymphoma tumor sample, and <strong>ABySS</strong>-Explorer to visually inspect<br />
our contigs. In this article we illustrate our analysis methods, and<br />
share our encouraging preliminary results.<br />
2 METHODS<br />
2.1 Patient sample<br />
The <strong>transcriptome</strong> data belongs to a patient who presented at 44 years of<br />
age <strong>with</strong> bulky stage II A intra-abdominal follicular, grade 1 non-Hodgkin<br />
lymphoma based on an inguinal lymph node biopsy. The staging bone<br />
marrow biopsy revealed no lymphoma. Initial treatment consisted of eight<br />
cycles of CVP-R (cyclophosphamide, vincristine, prednisone and rituximab)<br />
chemotherapy and produced a partial response. However, <strong>with</strong>in 3 months<br />
symptomatic progression of lymphoma was evident <strong>with</strong>in the abdomen and<br />
a repeat inguinal lymph node biopsy revealed residual grade 1 follicular<br />
lymphoma. We obtained informed consent from the patient, approved by<br />
the Research Ethics Board, and material from this biopsy was subjected<br />
to genomic analyses including whole <strong>transcriptome</strong> shotgun sequencing<br />
(WTSS).<br />
2.2 Library construction and sequencing<br />
RNA was extracted from the tumour biopsy sample using AllPrep DNA/RNA<br />
Mini Kit (Qiagen, USA) and DNaseI (Invitrogen, USA) treated following<br />
the manufacturer’s protocol. We generated three WTSS libraries, one from<br />
amplified complementary DNA (cDNA), another from the same amplified<br />
cDNA <strong>with</strong> normalization, and the last from unamplified cDNA, as follows.<br />
2.2.1 WTSS-lite and normalized WTSS-lite libraries Double-stranded<br />
amplified cDNA was generated from 200 ng RNA by templateswitching<br />
cDNA synthesis kit (Clontech, USA) using Superscript Reverse<br />
Transcriptase (Invitrogen, USA), followed by amplification using Advantage<br />
2 PCR kit (Clontech, USA) in 20 cycle reactions. Custom biotinylated PCR<br />
primers containing MmeI recognition sequences were used to facilitate the<br />
removal of primer sequences from cDNA template for WTSS-Lite library<br />
construction.<br />
Normalized cDNA was generated from 1.2 µg of the above amplified<br />
cDNA using Trimmer cDNA Normalization Kit (Evrogen, Russia) followed<br />
by amplification using the same biotinylated PCR primers, in a single<br />
15 cycle reaction <strong>with</strong> Advantage 2 Polymerase (Clontech, USA). The<br />
normalized and amplified cDNA pool generated <strong>with</strong> the 1/2× duplexspecific<br />
nuclease (DSN) enzyme dilution was chosen to be the template<br />
for WTSS-Lite normalized library construction.<br />
For both WTSS-Lite and normalized WTSS-Lite libraries, the removal<br />
of amplification oligonucleotide templates from the cDNA ends was<br />
accomplished by the binding to M-280 Streptavidin beads (Invitrogen,<br />
USA), followed by MmeI digestion. The supernatant of digest was purified<br />
and prepared for library construction as follows: roughly 500 ng of cDNA<br />
template was sonicated for 5 min using a Sonic Dismembrator 550 (cup horn,<br />
Fisher Scientific, Canada), and size fractionated using 8% PAGE gel. The<br />
100–300 bp size fraction was excised for library construction according to the<br />
Genomic DNA Sample Prep Kit protocol (Illumina, USA), using 10 cycles of<br />
PCR and purified using a Spin-X Filter Tube (Fisher Scientific) and ethanol<br />
precipitation. The library DNA quality was assessed and quantified using an<br />
Agilent DNA 1000 series II assay and Nanodrop 1000 spectrophotometer<br />
(Nanodrop, USA) and diluted to 10 nM.<br />
2.2.2 Unamplified WTSS library We used 5 µg RNA to purify<br />
polyA+RNA fraction using the MACS mRNA Isolation Kit (Miltenyi<br />
Biotec, Germany). Double-stranded cDNA was synthesized from the<br />
<strong>De</strong> <strong>novo</strong> <strong>transcriptome</strong> <strong>assembly</strong> <strong>with</strong> <strong>ABySS</strong><br />
purified polyA+RNA using Superscript Double-Stranded cDNA Synthesis<br />
kit (Invitrogen, USA) and random hexamer primers (Invitrogen, USA) at a<br />
concentration of 5 µM. The cDNA was sheared and library was constructed<br />
by following the same Genomic DNA Sample Prep Kit protocol (Illumina,<br />
USA).<br />
2.2.3 Sequencing <strong>De</strong>rived cDNA libraries were used to generate clusters<br />
on the Illumina cluster station and sequenced on the Illumina Genome<br />
Analyzer II platform following the manufacturer’s instructions. We ran seven<br />
lanes each of the two amplified libraries to generate 36 bp single end tag<br />
(SET) reads, and seven lanes of the unamplified library to generate 36 bp<br />
paired end tag (PET) reads.<br />
2.3 Assembly method<br />
We assembled the reads using <strong>ABySS</strong> (Simpson et al., 2009). The <strong>ABySS</strong><br />
algorithm is based on a de Bruijn di-graph representation of sequence<br />
neighborhoods (de Bruijn, 1946), where a sequence read is decomposed<br />
into tiled sub-reads of length k(k-mers) and sequences sharing k −1 bases are<br />
connected by directed edges. This approach was introduced to DNAsequence<br />
<strong>assembly</strong> by Pevzner et al. (2001) and was followed by others (Butler<br />
et al., 2008; Chaisson and Pevzner, 2008; Jackson et al., 2009; Zerbino and<br />
Birney, 2008). Although memory requirements for implementing de Bruijn<br />
graphs scale linearly <strong>with</strong> the underlying sequence, <strong>ABySS</strong> uses a distributed<br />
representation that relaxes these memory and computation time restrictions<br />
(Simpson et al., 2009).<br />
A de Bruijn graph captures the adjacency information between sequences<br />
of a uniform length k, defined by an overlap between the last and the first<br />
k −1 characters of two adjacent k-mers. <strong>ABySS</strong> starts by cataloging k-mers<br />
in a given set of reads and establishes their adjacency, represented in a<br />
distributed data format. The resulting graph is then inspected to identify<br />
potential sequencing errors and small-scale sequence variation.<br />
When a sequence has a read error, it alters all the k-mers that span it,<br />
which form branches in the graph. However, since such errors are stochastic<br />
in nature, their rate of observation is substantially lower than that of correct<br />
sequences. Hence, they can be discerned using coverage information, and<br />
branches <strong>with</strong> low coverage can be culled to increase the quality and<br />
contiguity of an <strong>assembly</strong>. This is especially true for genomic sequences.<br />
For <strong>transcriptome</strong>s, however, sequence coverage depth is a function of the<br />
transcript expression level it represents. Therefore, such culling needs to be<br />
performed <strong>with</strong> extra care. Accordingly, in the <strong>assembly</strong> stage, we applied<br />
trimming for those (false) branches when the absolute coverage levels were<br />
below a threshold of 2-fold (2×). In the analysis stage, we evaluated <strong>assembly</strong><br />
branches using the local coverage information, as well as contig lengths. For<br />
instance, in a neighborhood where a contig C1 branches into contig C2 and<br />
C3, <strong>with</strong> coverage levels of x1, x2 and x3, and contig lengths l1, l2 and l3,<br />
respectively, if x1 and x2 are significantly higher than x3, and l3 is shorter<br />
than a threshold, then we assume that C3 is a false branch.<br />
Some repeat read errors and small-scale sequence variation between<br />
approximate repeats or alleles result in some of the branches merging back<br />
to the trunk of the de Bruijn graph. We call such structures ‘bubbles’, and<br />
remove them during the <strong>assembly</strong>. Since they may represent real albeit<br />
alternative sequence at that location, we preserve the information they carry<br />
by recording them in a special log file, along <strong>with</strong> the variant we leave in the<br />
<strong>assembly</strong> contig and their coverage levels. These log entries are later used<br />
to postulate effects of allelic variations on expression levels.<br />
After the false branches are culled and bubbles removed, unambiguously<br />
linear paths along the de Bruijn graph are connected to form the single end<br />
tag <strong>assembly</strong> (SET) contigs. The branching information is also recorded for<br />
the subsequent paired end tag <strong>assembly</strong> (PET) stage and further analysis. At<br />
the SET stage, every k-mer represented in the <strong>assembly</strong> contigs has a unique<br />
occurrence. Using that information, we apply a streamlined read-to-<strong>assembly</strong><br />
alignment routine. We use the aligned read pairs to (i) infer read distance<br />
distributions between pairs in libraries that form our read set, and (ii) identify<br />
contigs that are in a certain neighborhood defined by these distributions.<br />
2873
I.Birol et al.<br />
Fig. 1. Excerpt from an <strong>ABySS</strong>-Explorer view, where edges represent<br />
contigs and nodes represent common k −1-mers between adjacent contigs.<br />
The labels correspond to SET contig IDs. Contig length and coverage are<br />
indicated by the length and the thickness of the edges, respectively. Arrows<br />
and edge arc shape indicate the direction of contigs and the polarity of<br />
the nodes distinguish reverse complements of common k −1-mers between<br />
adjacent contigs.<br />
The adjacency and the neighborhood information are used by the PET routine<br />
to merge SET contigs connected by pairs unambiguously, while keeping the<br />
list of the merged SET contigs (or the pedigree information) in the FASTA<br />
header for backtracking.<br />
The adjacency, neighborhood and pedigree information, along <strong>with</strong> the<br />
contig coverage information are also used by our <strong>assembly</strong> visualization<br />
tool, <strong>ABySS</strong>-Explorer. Figure 1 shows the <strong>ABySS</strong>-Explorer representation<br />
of some SET contigs in a neighborhood. Note that both the edges and the<br />
nodes are polarized in accordance <strong>with</strong> the directionality of the contigs and<br />
the k −1-mer overlaps between them, respectively. In the interactive view,<br />
when a user double-clicks on a contig, its direction and node connection<br />
polarizations flip to reflect the reverse complement. Paired end tags often<br />
resolve paths along SET contigs and they are subsequently merged in the<br />
PET stage. We indicate such merged contigs by dark gray paths in the viewer,<br />
when one of the contigs contributing to a merge is selected.<br />
The <strong>ABySS</strong>-Explorer representation encodes additional information<br />
including contig coverage (indicated by the edge thickness) and contig length<br />
(indicated by the edge lengths). A wave representation is used to indicate<br />
contig length such that a single oscillation corresponds to a user-defined<br />
number of nucleotides. A long contig results in packed oscillations, which<br />
obscure the arrowhead indicating its direction. To resolve this ambiguity,<br />
the envelope of the oscillations outlines a leaf-like shape <strong>with</strong> the thicker<br />
stem of the shape marking the start of the contig and the thinner tip pointing<br />
to its end. For example, contig 383 936 is a 627 bp long contig, which is<br />
much longer than the shortest contig 297 333 (29 bp), but its direction is still<br />
evident from its shape, <strong>with</strong> the thinner tip pointing to the right.<br />
We performed a parameter search for <strong>assembly</strong> optimization by varying k<br />
values in the range between 25 bp and 32 bp for the SET stage. Figure 2 shows<br />
some key statistics of our assemblies as a function of k. We picked the best<br />
<strong>assembly</strong> to be that for k = 28, as the number of contigs drops significantly<br />
between k =27 and k = 28, while the number of contigs 100 bp or longer do<br />
not increase, which indicate a substantial improvement in contiguity. Beyond<br />
k = 28, the number of contigs in both categories keeps decreasing, but so does<br />
the <strong>assembly</strong> N50.<br />
3 RESULTS<br />
Each <strong>assembly</strong> <strong>with</strong> a distinct k-value is performed on a cluster of<br />
20 compute nodes, each <strong>with</strong> 2 GB of memory. Since the number of<br />
possible k-mers changes <strong>with</strong> the parameter k, the runtime of the SET<br />
stage varies as a function of k. For the optimal <strong>assembly</strong> parameter<br />
of k = 28, the first stage of the <strong>assembly</strong> takes about 123 min for 194<br />
million reads. The runtime of the second stage highly depends on the<br />
results of the first stage, most importantly, on the number of contigs<br />
generated. In this case, it takes about 7.6 h to assemble 812 300<br />
SET contigs into 764 365 PET contigs on a single workstation. Key<br />
statistics on this optimal <strong>assembly</strong> are presented in Table 1.<br />
With this <strong>assembly</strong>, we reconstructed over 30 million bases of<br />
sequence. Following alignment of these PET contigs to the reference<br />
human genome, hg18, using BLAT (Kent, 2002) we observed that<br />
2874<br />
Fig. 2. Comparison of SET assemblies <strong>with</strong> k in [25, 32]. The blue crosses<br />
show the number of contigs (left axis), the green circles show the number of<br />
those that are 100 bp or longer (right axis). The bars indicate the <strong>assembly</strong><br />
N50 on an arbitrary scale. The N50 values of k = 28 and k = 32 assemblies<br />
are as indicated.<br />
Table 1. Assembly statistics of the follicular lymphoma <strong>transcriptome</strong> for<br />
the SET and PET stages <strong>with</strong> k =28<br />
k = 28 <strong>assembly</strong> SET PET<br />
Number of contigs 812 300 764 365<br />
Number of contigs ≥100 bp 95 080 66 921<br />
N50 (bp) 481 1114<br />
Max (bp) 7386 10 951<br />
Total (Mb) 29 30<br />
Assembly N50 values and total reconstruction are reported for contigs of length 100 bp<br />
or longer.<br />
92.5% of bases are in contigs that overlap a gene, as defined by<br />
the UCSC gene list (Hsu et al., 2006). The remaining 7.5% of<br />
bases are entirely <strong>with</strong>in intronic or intergenic regions. Only 1317<br />
bases, or a mere 0.004% were found to not align to hg18, and these<br />
primarily aligned to bacterial genome sequences, suggesting sample<br />
contamination.<br />
In the SET stage, we report 15 831 bubbles, of which 15 651<br />
(98.9%) contain two variants, and the remaining 180 (1.1%) contain<br />
three variants. We aligned these bubble sequences to hg18 using<br />
BLAT, requiring 95% or better identity. Out of 15 831 branches,<br />
6832 (43.2%) contain at least two variants that align uniquely<br />
to the same coordinates, indicating heterozygous (mostly single)<br />
nucleotide variants. A small fraction of the total (93) but over half<br />
of the three variant branches hit uniquely to the same coordinate,<br />
suggesting a mixed cell population, typical for tumor tissue samples.<br />
Using the fold coverage of the bubble branches as a surrogate for<br />
their expression levels, we analyzed the relative expression levels<br />
between alleles. When we compared the primary allele (highest<br />
coverage) to the secondary allele (second highest coverage), we<br />
found that the expression level difference was less than 1-fold<br />
for 3362 (49.2%) of the branches. Comparing the expression<br />
level change between the secondary and the tertiary alleles where
Fig. 3. Coverage level comparison between the primary, secondary and if<br />
present tertiary branches in <strong>assembly</strong> bubbles. The lower (upper) triangular<br />
region shows a comparison between the primary and secondary (secondary<br />
and tertiary) coverage levels, represented by black (red) markers.<br />
available, we found that similar expression was more common. For<br />
63 (67.7%) of them change in the expression levels was less than<br />
1-fold.<br />
The scatter plot in Figure 3 shows a comparison between the<br />
coverage levels of the alleles. The lower-right triangle portion of<br />
the plot (below the solid line) shows the comparison between the<br />
coverage levels of the first and the second alleles (black markers),<br />
and the upper-left triangle portion of the plot shows the same for the<br />
second and the third alleles (red markers). In this plot, we can easily<br />
see two distinct populations of expression pairs. A large fraction<br />
of pairs cluster near equal coverage line (solid line in Fig. 3), and<br />
a group of coverage level pairs indicating significant (over 1-fold)<br />
expression level differences (below and above the dashed black and<br />
red lines for the lower and upper triangular regions, respectively).<br />
When we investigate the coding status of the reported bubbles<br />
in coding regions, and co-relate that <strong>with</strong> the expression level<br />
differences, we observe that those <strong>with</strong> significant differences are<br />
more likely to have non-synonymous changes (78.0%) compared to<br />
those <strong>with</strong> less than one-fold difference (40.7%).<br />
At the SET stage, alternative splicing events, as well as genomic<br />
events such as heterozygous indels and sequence similarity may<br />
result in the <strong>assembly</strong> of two parallel contigs that lie between two<br />
neighboring contigs. These two parallel contigs indicate that two<br />
alternative sequences were observed between these neighboring<br />
contigs. The shorter of the two parallel contigs will be composed<br />
of exactly 2(k −1) bp and represents the junction of the two<br />
neighboring contigs, <strong>with</strong> k −1 bp coming from each neighbor. The<br />
longer contig represents the additional sequence, such as a retained<br />
exon or intron.<br />
In our <strong>transcriptome</strong> <strong>assembly</strong>, we have identified 888 contigs<br />
<strong>with</strong> 2(k −1) bp sequences. We aligned these contigs to the Ensembl<br />
<strong>transcriptome</strong> reference as well as to the reference genome, hg18,<br />
using exonerate (Slater and Birney, 2005). We required that these<br />
alignments be ungapped, <strong>with</strong> 90% identity. We observed that:<br />
287 (32%) of these contigs align only to the Ensembl<br />
<strong>transcriptome</strong> and represent known exon/exon junctions;<br />
<strong>De</strong> <strong>novo</strong> <strong>transcriptome</strong> <strong>assembly</strong> <strong>with</strong> <strong>ABySS</strong><br />
Fig. 4. (A) <strong>ABySS</strong>-Explorer and (B) UCSC viewer representations of the<br />
<strong>assembly</strong> of SLC15A4 and FP12591 genes, illustrating the expression of a<br />
skipped exon of SLC15A4 gene is higher compared to FP12591 gene.<br />
118 (13%) align to both <strong>transcriptome</strong> and genome references<br />
and represent exon sequences;<br />
27 (3%) align only to hg18 and represent reference sequence<br />
not in annotated exons; and<br />
456 (51%) do not align, and represent putative novel events.<br />
Contigs representing putative novel events were then split into<br />
two k −1 bp halves, and aligned to hg18 using MAQ (Li et al.,<br />
2008), allowing up to two mismatches. We found that 200 of these<br />
contigs aligned <strong>with</strong> 178 contigs having gap sizes of 50 bp or more,<br />
indicating either putative novel events or larger heterozygous indels.<br />
Only 22 contigs aligned <strong>with</strong> gaps of 6 bp or less, which we classified<br />
as putative heterozygous indels. Two of these aligned to intronic<br />
regions, and the remaining 20 aligned to 3 ′ UTRs; hence none of<br />
them aligned to a coding region. Our list of novel events needs<br />
further investigation for biological significance and comparison <strong>with</strong><br />
databases of known variations.<br />
Below we present four examples, three of which come from<br />
the list of 2(k −1) bp contigs and show a skipped exon, a retained<br />
intron, and an alternative splicing event. The fourth example shows<br />
a novel transcript we identified through gapped alignment of our<br />
PET contigs to the hg18 reference genome.<br />
3.1 Skipped exon<br />
Figure 4 shows an example of an exon skipping event. The path<br />
through SET contigs {253 799, 786 365, 413 875, 323 694, 163 543}<br />
in the <strong>ABySS</strong>-Explorer view (Fig. 4A) reconstructs the transcript of<br />
the gene SLC15A4, and is indicated by dark gray. Contig 786 366<br />
(shown in red) is 2(k −1) = 54 bp long, and defines an alternative<br />
path between contigs 253 799 and 413 875. As we have described<br />
above, this indicates the presence of multiple isoforms. Indeed, if<br />
we examine the UCSC browser view (Karolchik et al., 2007) of the<br />
region described by the alignment of our contigs (Fig. 4B), we see<br />
that this corresponds to the skipping of the third exon of SLC15A4<br />
gene. This alternative transcript is annotated as FP12591 gene.<br />
The UCSC view (Fig. 4B) shows tracks for SET and PET contigs<br />
on top. The contig numbers in the SET contigs track correspond to<br />
those displayed in the <strong>ABySS</strong>-Explorer view. The PET contigs track<br />
shows the reconstructed SLC15A4 gene (PET contig 9789), and the<br />
exon skipping event (PET contig 757 439, illustrated in red). Below<br />
the tracks of genes are the conservation and multi-alignment tracks,<br />
indicating strong signals at the exon coordinates. <strong>ABySS</strong>-Explorer<br />
2875
I.Birol et al.<br />
Fig. 5. (A) <strong>ABySS</strong>-Explorer and (B) UCSC viewer representations of the<br />
<strong>assembly</strong> of UNC119 gene, illustrating a retained intron.<br />
view suggests that the relative expression level of SLC15A4 gene<br />
is higher compared to FP12591 gene.<br />
3.2 Retained intron<br />
For retained introns, we expect a similar graph topology to that<br />
of the exon skipping events. Consider Figure 5A for example,<br />
which illustrates the <strong>ABySS</strong>-Explorer view of a subgraph <strong>with</strong> SET<br />
contigs aligning to UNC119 gene. The alternative paths through<br />
contigs 17 937 (red) and 17 938 (gray) correspond to observed<br />
alternative events as annotated in the UCSC browser ideograms in<br />
Figure 5B. The first and second UNC119 annotations show a gap that<br />
corresponds to the reconstruction indicated by SET contig 17 937<br />
(renumbered as 26 875 during the PET stage and is illustrated in red<br />
in the PET contigs track). The third annotation of UNC119 indicates<br />
that this ‘intronic’ sequence corresponds to an untranslated region<br />
(UTR). Although PET contig 340 reconstructs the longer variant, the<br />
coverage information shown in the <strong>ABySS</strong>-Explorer view indicates<br />
that the expression level of the transcript <strong>with</strong> the retained intron is<br />
lower, and the SET path {781 893, 17 937, 237 348, 456 654} is the<br />
predominant variant.<br />
3.3 Alternative 5 ′ splicing<br />
Figure 6 illustrates an example where we detect an alternative 5 ′<br />
splicing event, represented in the <strong>ABySS</strong>-Explorer view by two<br />
SET contigs, 614 385 (gray) for the normal splicing event and<br />
280 269 (red) for the alternative splicing event. The UCSC viewer<br />
representation indicates that this alternative splicing removes 27 bp<br />
or 9 amino acids from the 3 ′ end of an exon. When we investigate<br />
the raw data for this event, we see that eight reads align reasonably<br />
well to the normal transcript <strong>with</strong> up to five mismatches. Thus, if<br />
one were to analyze the data by alignment of short reads to the<br />
known <strong>transcriptome</strong>, allowing a certain number of mismatches and<br />
no indels, these are the reads which could identify this alternative<br />
junction, as other reads that span it would not be mappable.<br />
However, these reads and reads that tile across the alternative<br />
junction assemble easily to reconstruct this event, and the alignment<br />
of contigs <strong>with</strong> longer lengths enables its recovery.<br />
The topology of this event is similar to those of the previous<br />
examples. Length of the contig <strong>with</strong> the shorter splicing (280 269<br />
in SET, and 276 186 in PET assemblies) is 2(k −1) = 54 bp, <strong>with</strong><br />
k −1 bp of it anchored to SET contigs on either side.<br />
2876<br />
Fig. 6. (A) <strong>ABySS</strong>-Explorer and (B) UCSC viewer representations of the<br />
<strong>assembly</strong> of EZH2 gene, illustrating a novel alternative splicing event.<br />
Fig. 7. UCSC viewer representations of the <strong>assembly</strong> of LBA1 gene,<br />
illustrating a putative novel transcript.<br />
Transcriptome data is typically contaminated by genomic data in<br />
small quantity, which nonetheless can be sufficient in some places<br />
to assemble short contigs. Reads derived from genomic sequence<br />
that cover an exon/intron boundary will assemble into short but<br />
low-coverage tips that branch from the portion of the graph that<br />
represents <strong>transcriptome</strong> sequence. Figure 6A shows one such tip<br />
(SET contig 607 087, illustrated in light gray) in the<strong>ABySS</strong>-Explorer<br />
view. The short length of the curve indicates the short length of the<br />
contig, and the narrow width of the curve indicates its low coverage.<br />
3.4 Novel transcript<br />
Graph topology of novel transcripts does not follow the previous<br />
cases of skipped exons, retained introns or other splice variant<br />
events. They are identified by aligning contigs to the reference<br />
genome, and the contig lengths are instrumental in their discovery, as<br />
longer contigs have improved alignment specificity. Consequently,<br />
the example we provide for this case does not require the graph<br />
representation of the SET stage, but the final contig of the PET<br />
stage.<br />
PET contig 699 in Figure 7 represents a sequence over 10 kb<br />
in length that maps 100% to the reference genome <strong>with</strong> one<br />
mismatch in the first long exon, and mostly follows the annotated<br />
exon structure of LBA1 gene, but appears to have an alternative<br />
transcription start and additional exons. Interestingly, the extra<br />
nine upstream exons are all annotated as spliced ESTs, albeit in<br />
two disconnected groups, one of which points to an even further<br />
transcription start. Also of note here is the concordance between<br />
the estimated exons and the strong mammalian conservation signal<br />
depicted in the bottom ideogram as a gray-scale signal.<br />
This event would be difficult, if not impossible to reconstruct<br />
through an analysis based on alignment of short reads. Although they<br />
would potentially yield hits to these estimated exons, they would not
only have lower coverage on the exon boundaries due to potential<br />
mismatches in reads that span junctions, but also would be difficult<br />
to discern from genomic sequence contamination.<br />
4 DISCUSSION<br />
To our knowledge, this is the first demonstration of de <strong>novo</strong><br />
<strong>assembly</strong> of experimental human <strong>transcriptome</strong> data from a short<br />
read sequencing platform, and its results are presented in a form<br />
that allows high throughput analysis for comparative genomics.<br />
The preliminary analysis and the examples presented illustrate<br />
the utility of <strong>ABySS</strong> for de <strong>novo</strong> <strong>assembly</strong> of <strong>transcriptome</strong>s.<br />
Assembled contigs, their topological relationships and information<br />
about putative heterozygous nucleotide variations offer intriguing<br />
leads for the analysis of genomic events and their effects on<br />
biological functions. With the reported results in this manuscript<br />
we are only scratching the surface in analyzing the results of<br />
our <strong>transcriptome</strong> <strong>assembly</strong>. We are currently developing high<br />
throughput analysis methods based on the properties of the anecdotal<br />
evidence we present here, and will report a more thorough account<br />
of our results in due time.<br />
<strong>ABySS</strong>-Explorer is an important component of this tools set that<br />
provides an interactive interface for visualizing <strong>ABySS</strong> <strong>assembly</strong><br />
graphs. As illustrated by the sample events presented here, this graph<br />
view emphasizes alternative paths through an assembled region,<br />
making alternative events easy to identify. It captures coverage<br />
information as edge thickness and facilitates judgments of relative<br />
expression levels. Finally, this tool can readily display additional<br />
data not used in the <strong>assembly</strong>, such as annotations or additional<br />
paired end data, which are useful in inferring the nature of the<br />
putative isoforms presented in the graph.<br />
Thus the set of tools we introduce in this article, coupled<br />
<strong>with</strong> alignment methods, will help researchers interrogate high<br />
throughput data from whole <strong>transcriptome</strong> shotgun sequencing<br />
experiments using short read sequencing platforms. As an enabling<br />
technology, these tools will make it possible to formulate new<br />
hypotheses for testing.<br />
ACKNOWLEDGEMENTS<br />
The authors would like to thank Kim Wong, Matthew Field, Andrew<br />
Mungall and Karen Mungall for helpful discussions, and Pawan<br />
Pandoh, Helen McDonald and Jennifer Asano for their contributions<br />
in WTSS library construction. SJMJ is a senior scholar of the<br />
Michael Smith Foundation for Health Research.<br />
Funding: Genome Canada, Genome British Columbia and the<br />
British Columbia Cancer Foundation; National Cancer Institute of<br />
<strong>De</strong> <strong>novo</strong> <strong>transcriptome</strong> <strong>assembly</strong> <strong>with</strong> <strong>ABySS</strong><br />
Canada Terry Fox Program Project award (# 016003) (to D.E.H.,<br />
J.M.C., R.D.G. and M.A.M.).<br />
Conflict of Interest: none declared.<br />
REFERENCES<br />
Bentley,D.R. et al. (2008) Accurate whole human genome sequencing using reversible<br />
terminator chemistry. Nature 456, 53–59.<br />
Butler,J. et al. (2008) ALLPATHS: de <strong>novo</strong> <strong>assembly</strong> of whole-genome shotgun<br />
microreads. Genome Res., 18, 810–820.<br />
Chaisson,M.J. and Pevzner,P.A. (2008) Short read fragment <strong>assembly</strong> of bacterial<br />
genomes. Genome Res., 18, 324–330.<br />
de Bruijn,N.G. (1946). A combinatorial problem. Koninklijke Nederlandse Akademie v.<br />
Wetenschappen, 49, 758–764.<br />
Dohm,J.C. et al. (2007) SHARCGS, a fast and highly accurate short-read <strong>assembly</strong><br />
algorithm for de <strong>novo</strong> genomic sequencing. Genome Res., 11, 1697–1706.<br />
Farrer,R.A. et al. (2009) <strong>De</strong> <strong>novo</strong> <strong>assembly</strong> of the Pseudomonas syringae pv. syringae<br />
B728a genome using Illumina/Solexa short sequence reads. FEMS Microbiol. Lett.,<br />
1, 103–111.<br />
Fullwood,M.J. et al. (2009) Next-generation DNA sequencing of paired-end tags (PET)<br />
for <strong>transcriptome</strong> and genome analyses. Genome Res., 4, 521–532.<br />
Hernandez,D. et al. (2008) <strong>De</strong> <strong>novo</strong> bacterial genome sequencing: millions of very short<br />
reads assembled on a desktop computer. Genome Res., 5, 802–809.<br />
Hsu,F. et al. (2006) The UCSC known genes. <strong>Bioinformatics</strong>, 9, 1036–1046.<br />
Jackson,B.G. et al. (2009) Parallel short sequence <strong>assembly</strong> of <strong>transcriptome</strong>s. BMC<br />
Bioinform., 10, S1–S14.<br />
Karolchik,D. et al. (2007) The UCSC Genome Browser. Curr. Protoc. Bioinform.,<br />
Chapter 1, Unit 1.4.<br />
Kent,W.J. (2002) BLAT – the BLAST-like alignment tool. Genome Res., 4, 656–664.<br />
Kozarewa,I. et al. (2009) Amplification-free Illumina sequencing-library preparation<br />
facilitates improved mapping and <strong>assembly</strong> of (G+C)-biased genomes. Nat.<br />
Methods, 4, 291–295.<br />
Li,H. et al. (2008) Mapping short DNA sequencing reads and calling variants using<br />
mapping quality scores. Genome Res., 11, 1851–8.<br />
Morin,R. et al. (2008) Profiling the HeLa S3 <strong>transcriptome</strong> using randomly primed<br />
cDNA and massively parallel short-read sequencing. Biotechniques, 45, 81–94.<br />
Nielsen,C.B. et al. (2009) <strong>ABySS</strong>-Explorer: visualizing genome sequence assemblies.<br />
IEEE Trans. Vis. Comp. Graphics (in revision).<br />
Ossowski,S. et al. (2008) Sequencing of natural strains of Arabidopsis thaliana <strong>with</strong><br />
short reads. Genome Res., 12, 2024–2033.<br />
Pevzner,P.A. et al. (2001) An Eulerian path approach to DNA fragment <strong>assembly</strong>. Proc.<br />
Natl Acad. Sci. USA, 98, 9748–9753.<br />
Salzberg,S.L. et al. (2008) Gene-boosted <strong>assembly</strong> of a novel bacterial genome from<br />
very short reads. PLoS Comput Biol., 9, e1000186.<br />
Simpson,J.T. et al. (2009) <strong>ABySS</strong>: a parallel assembler for short read sequence data.<br />
Genome Res., 19, 1117–1123.<br />
Slater,G.S. and Birney,E. (2005) Automated generation of heuristics for biological<br />
sequence comparison. BMC Bioinform., 6, 31<br />
Wang,E.T. et al. (2008) Alternative isoform regulation in human tissue <strong>transcriptome</strong>s.<br />
Nature, 456, 470–476.<br />
Warren,R.L. et al. (2009) Profiling model T-cell metagenomes <strong>with</strong> short reads.<br />
<strong>Bioinformatics</strong>, 4, 458–464.<br />
Yassour,M. et al. (2009) Ab initio construction of a eukaryotic <strong>transcriptome</strong> by<br />
massively parallel mRNA sequencing. Proc. Natl Acad. Sci. USA, 9, 3264–3269.<br />
Zerbino,D.R. and Birney,E. (2008) Velvet: algorithms for de <strong>novo</strong> short read <strong>assembly</strong><br />
using de Bruijn graphs. Genome Res., 18, 821–829.<br />
2877