great lakes dairy sheep symposium - the Department of Animal ...
great lakes dairy sheep symposium - the Department of Animal ...
great lakes dairy sheep symposium - the Department of Animal ...

You also want an ePaper? Increase the reach of your titles
YUMPU automatically turns print PDFs into web optimized ePapers that Google loves.
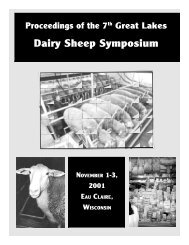
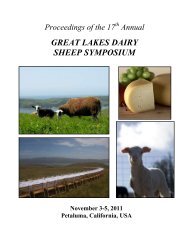
Proceedings <strong>of</strong> <strong>the</strong> 12 th Annual<br />
GREAT LAKES DAIRY<br />
SHEEP SYMPOSIUM<br />
November 9–11, 2006<br />
La Crosse,<br />
Wisconsin,<br />
USA
Proceedings <strong>of</strong> <strong>the</strong> 12 th Annual<br />
GREAT LAKES DAIRY SHEEP<br />
SYMPOSIUM<br />
November 9 – 11, 2006<br />
Midway Hotel Riverfront Resort<br />
La Crosse, Wisconsin, USA<br />
Organized by:<br />
Wisconsin Sheep Dairy Cooperative (http://www.<strong>sheep</strong>milk.biz/)<br />
University <strong>of</strong> Wisconsin-Madison, College <strong>of</strong> Agricultural and Life<br />
Sciences, Madison, Wisconsin, USA<br />
Spooner Agricultural Research Station<br />
(http://www.uwex.edu/ces/sars/menu.htm)<br />
<strong>Department</strong> <strong>of</strong> <strong>Animal</strong> Sciences (http://www.ansci.wisc.edu/)<br />
University <strong>of</strong> Wisconsin-Extension, Cooperative Extension, Madison,<br />
Wisconsin, USA (http://www.uwex.edu/ces/animalscience/<strong>sheep</strong>/)<br />
Presented by:<br />
Dairy Sheep Association <strong>of</strong> North America, Madison, Wisconsin, USA<br />
(http://www.dsana.org/index.php)<br />
i
Symposium Organizing Committee<br />
Yves Berger, Spooner, Wisconsin, USA - Chair<br />
Steve and Darlene Eckerman, Antigo, Wisconsin, USA<br />
Dan Guertin and Alice Henriksen, Stillwater, Minnesota, USA<br />
Tom and Laurel Kieffer, Strum, Wisconsin, USA<br />
Larry and Emily Meisegeier, Bruce, Wisconsin, USA<br />
Claire Mikolayunas, Madison, Wisconsin, USA<br />
David Thomas, Madison, Wisconsin, USA<br />
Lorraine Toman, Rice Lake, Wisconsin, USA<br />
Proceedings Edited and Compiled by:<br />
David L. Thomas, Madison, Wisconsin, USA<br />
Photographs on <strong>the</strong> Cover:<br />
Counter-clockwise from top right:<br />
Dairy ewes, Hidden Springs Farm, Westby, Wisconsin – photo by Brenda Jensen<br />
Percheron draft horses, Hidden Springs Farm, Westby, Wisconsin – photo by<br />
Brenda Jensen<br />
Hand-milked <strong>dairy</strong> ewes on a rotating parlor, Clover Dale Farm, Westby,<br />
Wisconsin – photo by Artak Khahcatryan<br />
Aged Marisa award-winning <strong>sheep</strong> milk cheese, Carr Valley Cheese, La Valle,<br />
Wisconsin – photo by Carr Valley Cheese<br />
ii
Table <strong>of</strong> Contents<br />
Program <strong>of</strong> Events ………………………………………………………………………........... v<br />
Speakers………………………………………………………………………………………… vii<br />
Sponsors ……………………………………………………………………………………….. viii<br />
SHEEP DAIRY FARM ECONOMIC ANALYSIS – COST OF MILK PRODUCTION<br />
Tom Kieffer and Dan Guertin ……………………………………………………… …………. 1<br />
THE DAIRY BUSINESS INNOVATION CENTER: A CATALYST FOR INNOVATION<br />
Kate Arding and Norman E. Monsen ………………………………………………………….. 4<br />
ORGANIC SHEEP DAIRY: MARKETS AND PRODUCTION<br />
Jody Padgham…………………………………………………………………………………… 11<br />
DAIRY SHEEP PRODUCTION AND CHEESE MAKING IN THE FRENCH PYRENEES<br />
G. Lagriffoul, J.M. Arranz, J.M. Astruc, and E. Morin ……………………………………....... 20<br />
OVINE PROGRESSIVE PNEUMONIA AND CASEOUS LYMPHADENITIS – YOU CAN<br />
RAISE SHEEP WITHOUT THEM<br />
Holly Neaton …………………………………………………………………………………… 26<br />
STRATEGIC CONTROL OF GASTRO-INTESTINAL PARASITES IN SHEEP<br />
D.H. Bliss ………………………………………………………………………………………. 33<br />
SOMATIC CELL COUNTS IN DAIRY SHEEP MILK<br />
G. Lagriffoul, F. Barillet, R. Rupp, X. Ber<strong>the</strong>lot, and D. Bergonier………………………........ 38<br />
EFFECT OF SUPPLEMENTATION AND STAGE OF LACTATION ON PERFORMANCE<br />
OF GRAZING DAIRY EWES<br />
Claire M. Mikolayunas, David L. Thomas, Kenneth A. Albrecht, David K. Combs, and<br />
Yves M. Berger ………………………………………………………………………………… 56<br />
EFFECT OF PREPARTUM PHOTOPERIOD ON PROLACTIN AND MILK PRODUCTION<br />
OF DAIRY EWES<br />
Claire M. Mikolayunas, David L. Thomas, Yves M. Berger, T. F. Gressley, and G. E. Dahl … 72<br />
SHEEP BEHAVIOR AND ITS USE IN SHEEP MANAGEMENT<br />
Harold W. Gonyou …………………………………………………………………………….. 82<br />
CONTINUUM OF DAIRY OPERATIONS, PRODUCTS AND MARKETING STRATEGIES<br />
Alice Henriksen and Laurel Kieffer ….………………………………………………………… 86<br />
iii
Table <strong>of</strong> Contents (cont.)<br />
SHEPHERD’S DAIRY<br />
Kim Curtis ……………………………………………………………………………………… 87<br />
MILKING EWES IN THE CENTER OF MEXICO<br />
Javier Pérez Rocha Malcher……………………………………………………………………. 88<br />
ARTISAN SHEEP MILK CHEESE<br />
Jodi Ohlsen Read ………………………………………………………………………………. 91<br />
ACCURACY OF THE PORTASCC® MILK TEST FOR THE DETECTION OF SOMATIC<br />
CELLS IN SHEEP MILK<br />
Yves M. Berger ………………………………………………………………………………… 93<br />
CLOVER DALE SHEEP DAIRY<br />
John Henry and Mary Miller…………………………………………………………………… 97<br />
HIDDEN SPRINGS FARM AND CREAMERY<br />
Dean and Brenda Jensen ..……………………………………………………………………… 98<br />
CARR VALLEY CHEESE<br />
Sid Cook ……………………………………………………………………………………….. 99<br />
Information from <strong>the</strong> Symposium Sponsors ……………………………………………………100<br />
iv
Program <strong>of</strong> Events<br />
Thursday, November 9, 2006<br />
8:30 a.m. Registration, Midway Hotel Riverfront Resort, La Crosse, Wisconsin, USA<br />
10:00 a.m. Welcome<br />
10:30 a.m. Sheep Dairy Farm Economic Analysis – Cost <strong>of</strong> Milk Production<br />
Dan Guertin, Dairy Sheep Producer, Stillwater, Minnesota, USA<br />
Tom Kieffer, Dairy Sheep Producer, Strum, Wisconsin, USA<br />
Noon Lunch<br />
1:15 p.m. The Dairy Business Innovation Center: A Catalyst for Innovation<br />
Kate Arding, Consultant to <strong>the</strong> Dairy Business Innovation Center, Wisconsin<br />
<strong>Department</strong> <strong>of</strong> Agriculture, Trade and Consumer Protection, Madison,<br />
Wisconsin, USA<br />
2:00 p.m. Organic Sheep Dairy: Markets and Production<br />
Jody Padgham, Midwest Organic and Sustainable Education Service, Spring<br />
Valley, Wisconsin, USA<br />
2:45 p.m. Dairy Sheep Production and Cheese Making in <strong>the</strong> French Pyrenees<br />
Gilles Lagriffoul, Institut de l’Elevage - Comité National Brebis Laitières,<br />
INRA, Toulouse, France<br />
3:45 p.m. Annual Meeting <strong>of</strong> <strong>the</strong> Dairy Sheep Association <strong>of</strong> North America<br />
5:00 p.m. Social Hour<br />
Friday, November 10, 2006<br />
8:00 a.m. Registration, Midway Hotel Riverfront Resort, La Crosse, Wisconsin, USA<br />
8:30 a.m. Ovine Progressive Pneumonia and Caseous Lymphadenitis – You Can<br />
Raise Sheep Without Them<br />
Holly Neaton, DVM and Sheep Producer, Watertown, Minnesota, USA<br />
9:15 a.m. Strategic Control <strong>of</strong> Gastro-Intestinal Parasites in Sheep<br />
Don Bliss, Parasitologist, Mid America Ag Research, Verona, Wisconsin,<br />
USA<br />
10:00 a.m. Break<br />
10:30 a.m. Somatic Cell Counts in Dairy Sheep Milk<br />
Gilles Lagriffoul, Institut de l’Elevage - Comité National Brebis Laitières,<br />
INRA, Toulouse, France<br />
v
Program <strong>of</strong> Events (cont.)<br />
Friday, November 10, 2006<br />
11:15 a.m. Dairy Sheep Grazing Research at <strong>the</strong> University <strong>of</strong> Wisconsin-Madison<br />
Claire Mikolayunas, Ph.D. Research Assistant, <strong>Department</strong> <strong>of</strong> <strong>Animal</strong><br />
Sciences, University <strong>of</strong> Wisconsin-Madison, Madison, Wisconsin, USA<br />
Noon Lunch<br />
1:30 p.m. Effect <strong>of</strong> Prepartum Photoperiod on Prolactin and Milk Production <strong>of</strong><br />
Dairy Ewes<br />
Claire Mikolayunas, Ph.D. Research Assistant, <strong>Department</strong> <strong>of</strong> <strong>Animal</strong><br />
Sciences, University <strong>of</strong> Wisconsin-Madison, Madison, Wisconsin, USA<br />
2:15 p.m. Sheep Behavior and Its Use in Sheep Management<br />
Harold Gonyou, <strong>Animal</strong> Behaviorist, Prairie Swine Centre and <strong>the</strong> University<br />
<strong>of</strong> Saskatchewan, Saskatoon, Saskatchewan, Canada<br />
3:00 p.m. Break<br />
3:30 p.m. A Continuum <strong>of</strong> Dairy Sheep Operations, Products, and Marketing<br />
Strategies<br />
Moderators:<br />
Alice Henriksen Dairy Sheep Producer, Stillwater, Minnesota, USA<br />
Laurel Kieffer, Dairy Sheep Producer, Strum, Wisconsin, USA<br />
Panelists:<br />
Kim Curtis, Dairy Sheep Producer and Sheep Milk Soap Processor and<br />
Marketer, Anselmo, Nebraska, USA<br />
Javier Pérez Rocha Malcher, Organic Dairy Sheep Producer and Sheep<br />
Milk Cheesemaker and Marketer, El Marques, Querétaro, México<br />
Jodi Ohlsen Read, Dairy Sheep Producer and Sheep Milk Cheesemaker and<br />
Marketer, Nerstrand, Minnesota, USA<br />
6:30 p.m. Symposium Banquet (separate ticket required)<br />
Midway Hotel Riverfront Resort, La Crosse, Wisconsin, USA<br />
Saturday, November 11, 2006<br />
8:30 a.m. –<br />
4:30 p.m.<br />
Board Buses for Farm and Cheese Plant Tours<br />
Clover Dale Dairy Sheep Farm, Westby, Wisconsin, USA – John Henry<br />
and Mary Miller<br />
Hidden Springs Farm and Creamery, Westby, Wisconsin, USA – Dean and<br />
Brenda Jensen<br />
Carr Valley Cheese, Mauston, Wisconsin, USA – Sid Cook<br />
vi
Speakers<br />
at <strong>the</strong> <strong>symposium</strong> site on Thursday and Friday and on <strong>the</strong> farm and cheese plant tours on<br />
Saturday<br />
Kate Arding, Consultant to <strong>the</strong> Dairy Business Innovation Center, Wisconsin <strong>Department</strong> <strong>of</strong><br />
Agriculture, Trade and Consumer Protection, Madison, Wisconsin, USA<br />
Don Bliss, Parasitologist, Mid America Ag Research, Verona, Wisconsin, USA<br />
Sid Cook, Wisconsin Master Cheesemaker, Cheese Plant Owner and Marketer, Carr Valley<br />
Cheese, La Valle, Wisconsin, USA<br />
Kim Curtis, Dairy Sheep Producer and Sheep Milk Soap Processor and Marketer, Anselmo,<br />
Nebraska, USA<br />
Harold Gonyou, <strong>Animal</strong> Behaviorist, Prairie Swine Centre and <strong>the</strong> University <strong>of</strong> Saskatchewan,<br />
Saskatoon, Saskatchewan, Canada<br />
Dan Guertin, Dairy Sheep Producer, Stillwater, Minnesota, USA<br />
Alice Henriksen, Dairy Sheep Producer, Stillwater, Minnesota, USA<br />
Dean and Brenda Jensen, Dairy Sheep Producers, Farmstead Cheesemakers and Marketers,<br />
Hidden Springs Farm and Creamery, Westby, Wisconsin, USA<br />
Tom and Laurel Kieffer, Dairy Sheep Producers, Strum, Wisconsin, USA<br />
Gilles Lagriffoul, Institut de l’Elevage - Comité National Brebis Laitières, INRA, Toulouse,<br />
France<br />
Javier Pérez Rocha Malcher, Organic Dairy Sheep Producer and Sheep Milk Cheesemaker and<br />
Marketer, El Marques, Querétaro, México<br />
Jodi Ohlsen Read, Dairy Sheep Producer and Sheep Milk Cheesemaker and Marketer, Nerstrand,<br />
Minnesota, USA<br />
Claire Mikolayunas, Ph.D. Research Assistant, <strong>Department</strong> <strong>of</strong> <strong>Animal</strong> Sciences, University <strong>of</strong><br />
Wisconsin-Madison, Madison, Wisconsin, USA<br />
John Henry and Mary Miller, Dairy Sheep Producers, Clover Dale Dairy Sheep Farm, Westby,<br />
Wisconsin, USA<br />
Holly Neaton, DVM and Sheep Producer, Watrertown, Minnesota, USA<br />
Jody Padgham, Midwest Organic and Sustainable Education Service, Spring Valley, Wisconsin,<br />
USA<br />
vii
Gold:<br />
Sponsors<br />
Babcock Institute for International Dairy Research and Development, University <strong>of</strong><br />
Wisconsin-Madison, Madison, Wisconsin, USA; http://babcock.cals.wisc.edu/<br />
The Coburn Company, Inc., Whitewater, Wisconsin, USA; www.coburnco.com<br />
Silver:<br />
Grober Nutrition, Quaker City, Ohio, USA; www.grobernutrition.com<br />
Milk Products (Sav-a-Lam), Chilton, Wisconsin, USA; http://savacaf.com/<br />
Wisconsin Sheep Dairy Cooperative, Strum, Wisconsin, USA; http://www.<strong>sheep</strong>milk.biz/<br />
Bronze:<br />
Biotic Industries, Bell Buckle, Tennessee, USA; www.biotic.com/<br />
The Country Today, Eau Claire, Wisconsin, USA; www.<strong>the</strong>countrytoday.com<br />
EZ <strong>Animal</strong> Products, LLC, Ellendale, Minnesota, USA; www.udderlyezllc.com<br />
Land O’Lakes <strong>Animal</strong> Milk Products, St. Paul, Minnesota, USA;<br />
http://www.lando<strong>lakes</strong>inc.com/<br />
Nelson Manufacturing Company, Cedar Rapids, Iowa, USA; www.nelsonmfg.com<br />
Old Chatham Sheepherding Company, Old Chatham, New York, USA;<br />
http://www.black<strong>sheep</strong>cheese.com/<br />
Shepherd’s Dairy, Anselmo, Nebraska, USA; www.shepherds<strong>dairy</strong>.com<br />
Small Ruminant Dairy Project, University <strong>of</strong> Vermont Center for Sustainable Agriculture,<br />
Burlington, Vermont, USA; http://www.uvm.edu/sustainableagriculture/smallrumi.html<br />
viii
Supporting:<br />
Sponsors (cont.)<br />
CHR Hansen, Milwaukee, Wisconsin, USA; www.chr-hansen.com/<br />
D. Eckerman Tax Services, LLC, Antigo, Wisconsin, USA ; eckermst@antigopro.net<br />
Fromagex, Rimouski, Québec, Canada; http://www.fromagex.com/<br />
Major Farm Parlors, Putney, Vermont, USA; www.vermontshepherd.com<br />
PortaCheck, Morrestown, New Jersey, USA; www.portacheck.com<br />
River Ridge Stock Farm, Larry and Emily Meisegeier, Bruce, Wisconsin, USA (donation <strong>of</strong><br />
lamb for <strong>the</strong> banquet)<br />
Spooner Agricultural Research Station, College <strong>of</strong> Agricultural and Life Sciences, University<br />
<strong>of</strong> Wisconsin-Madison, Spooner, Wisconsin, USA (donation <strong>of</strong> lamb for <strong>the</strong> banquet)<br />
Sydell Inc., Burbank, South Dakota, USA; www.sydell.com<br />
All 2006 sponsors are gratefully thanked for <strong>the</strong>ir generous support <strong>of</strong><br />
<strong>the</strong> 12 th Great Lakes Dairy Sheep Symposium and for <strong>the</strong>ir interest and<br />
support <strong>of</strong> <strong>the</strong> North American <strong>dairy</strong> <strong>sheep</strong> industry.<br />
Please consider supporting <strong>the</strong>se sponsors as you purchase equipment,<br />
supplies, and services for your <strong>dairy</strong> <strong>sheep</strong> farm or <strong>sheep</strong> milk<br />
processing facility.<br />
ix
SHEEP DAIRY FARM ECONOMIC ANALYSIS – COST OF MILK PRODUCTION<br />
Introduction<br />
Tom Kieffer and Dan Guertin<br />
Wisconsin Sheep Dairy Cooperative<br />
Strum, Wisconsin, USA<br />
In 1996, <strong>the</strong> Wisconsin Sheep Dairy Cooperative (WSDC) was formed with an initial<br />
membership <strong>of</strong> 26 farms. Of <strong>the</strong>se farms, only 6 farms were actually milking <strong>sheep</strong>. The<br />
remaining farms were in various stages <strong>of</strong> planning and/or setting up to milk. The primary<br />
question asked by <strong>the</strong> initial members was, “How much will I be paid for my milk?” In <strong>the</strong><br />
ensuing 10 years, this question continued to be asked by everyone interested in ei<strong>the</strong>r joining <strong>the</strong><br />
co-op or setting up an independent <strong>sheep</strong> milking operation. Of <strong>the</strong> original 26 farms, 6 farms<br />
are still actively milking members <strong>of</strong> <strong>the</strong> WSDC. Three o<strong>the</strong>r farms became independent<br />
farmstead operations and are currently making <strong>the</strong>ir own <strong>sheep</strong> milk products. The remaining 17<br />
farms went out <strong>of</strong> <strong>the</strong> <strong>sheep</strong> <strong>dairy</strong> business. The reasons for farms not succeeding are varied,<br />
some because <strong>of</strong> health issues, some because <strong>of</strong> lack <strong>of</strong> labor, but most because <strong>the</strong>y were not<br />
able to make enough money milking <strong>sheep</strong>. Over <strong>the</strong> last 10 years, <strong>the</strong> co-op has had<br />
approximately 20 additional individuals who tried, or seriously investigated, <strong>sheep</strong> <strong>dairy</strong>ing. Of<br />
<strong>the</strong>se, 14 have ended up leaving <strong>the</strong> <strong>sheep</strong> <strong>dairy</strong>ing business.<br />
Approach<br />
The question <strong>of</strong> why some farms succeeded and o<strong>the</strong>rs failed has been contemplated by <strong>the</strong><br />
WSDC Board <strong>of</strong> Directors for a number <strong>of</strong> years. All <strong>of</strong> <strong>the</strong> member farms were being paid <strong>the</strong><br />
same amount for <strong>the</strong>ir milk, yet some were able to cash flow <strong>the</strong>ir operations and o<strong>the</strong>r weren’t.<br />
Trying to elucidate this answer has been very complicated because no two farm situations are <strong>the</strong><br />
same. Some farms had additional sources <strong>of</strong> farm income beside milk, some farms carried heavy<br />
debt loads, some farms were milking 50 or fewer <strong>sheep</strong> while o<strong>the</strong>rs were milking 300+ <strong>sheep</strong>,<br />
and each farm had different levels <strong>of</strong> direct and indirect costs.<br />
Since <strong>the</strong> Great Lakes Dairy Sheep Symposium is focused on <strong>sheep</strong> <strong>dairy</strong>ing, this<br />
presentation is focused on developing a standardized system for recordkeeping and determining<br />
<strong>the</strong> direct cost <strong>of</strong> milk production. The approach we have taken is to segregate <strong>the</strong> various direct<br />
costs in a typical <strong>sheep</strong> <strong>dairy</strong> operation into ‘standardized’ categories, and <strong>the</strong>n to address each <strong>of</strong><br />
<strong>the</strong> categories related to <strong>the</strong> direct cost <strong>of</strong> milk production. Clearly, if a farm is being paid<br />
$0.55/lb <strong>of</strong> milk, but is spending $0.60/lb to produce <strong>the</strong> milk, <strong>the</strong> farm will not be viable over<br />
<strong>the</strong> long term.<br />
We wish to clearly state at <strong>the</strong> outset that we fully realize that by focusing only on <strong>the</strong> direct<br />
cost <strong>of</strong> milk production, a farm will not be able to predict success or failure. We also realize that<br />
each farm may allocate direct and indirect costs differently across multiple farm enterprises for<br />
tax and overall farm budgeting purposes. The goal <strong>of</strong> establishing a standardized method for<br />
calculating <strong>the</strong> cost <strong>of</strong> milk production, in isolation from <strong>the</strong> rest <strong>of</strong> <strong>the</strong> farm operation, is to<br />
1
allow a variety <strong>of</strong> farms with different situations to gauge <strong>the</strong>ir direct cost <strong>of</strong> production against<br />
o<strong>the</strong>r farms to determine if <strong>the</strong>ir cost <strong>of</strong> production is higher or lower than o<strong>the</strong>r farms.<br />
By benchmarking <strong>the</strong> average and range <strong>of</strong> costs in each <strong>of</strong> <strong>the</strong>se categories, farmers will be<br />
able to determine how <strong>the</strong>y compare to o<strong>the</strong>rs in <strong>the</strong> industry. If, by using <strong>the</strong> standardized<br />
calculation, a farm determines that <strong>the</strong>ir cost <strong>of</strong> production is significantly higher than o<strong>the</strong>r<br />
farms, that farm will be able to compare <strong>the</strong>ir costs across <strong>the</strong> different categories with o<strong>the</strong>r<br />
farms to determine in which category(ies) <strong>the</strong>ir costs are out <strong>of</strong> line. By being able to identify<br />
problem areas, <strong>the</strong> farm can concentrate on different ways to bring <strong>the</strong>se costs down.<br />
Conversely, if a farm finds that <strong>the</strong>ir overall cost <strong>of</strong> production is at <strong>the</strong> lower end <strong>of</strong> <strong>the</strong> scale,<br />
<strong>the</strong>y can help to establish ‘best practices’ in <strong>the</strong> <strong>sheep</strong> <strong>dairy</strong> industry that o<strong>the</strong>r <strong>sheep</strong> <strong>dairy</strong> farms<br />
can follow to be more successful. Today’s presentation will follow <strong>the</strong> format outlined below.<br />
We will start with an overview <strong>of</strong> farm accounting in order to establish <strong>the</strong> framework in<br />
which <strong>the</strong> standardized direct cost <strong>of</strong> milk production model is built. This will be followed by a<br />
discussion <strong>of</strong> <strong>the</strong> definitions for <strong>the</strong> various terms and categories used in our model. These<br />
definitions are essential in order to establish a ‘common language’ between <strong>sheep</strong> <strong>dairy</strong> farmers<br />
that can be used in future discussions. A good example <strong>of</strong> where <strong>the</strong> lack <strong>of</strong> having a common<br />
language is seen on a recurring basis in <strong>the</strong> <strong>sheep</strong> business is when farms discuss <strong>the</strong>ir lambing<br />
percentage. Some farms calculate <strong>the</strong> number <strong>of</strong> lambs born per number <strong>of</strong> pregnant ewes,<br />
o<strong>the</strong>rs calculate <strong>the</strong> number <strong>of</strong> lambs born per number <strong>of</strong> ewes exposed, o<strong>the</strong>rs count <strong>the</strong> number<br />
<strong>of</strong> lambs weaned per number <strong>of</strong> ewes exposed, still o<strong>the</strong>rs count … <strong>the</strong> variations are too<br />
numerous to describe. We will <strong>the</strong>n discuss <strong>the</strong> types <strong>of</strong> records needed to calculate your direct<br />
cost <strong>of</strong> production and provide some tools that will make <strong>the</strong> record keeping process from<br />
becoming too cumbersome. Throughout <strong>the</strong>se discussions, we will solicit feedback and<br />
comments from <strong>the</strong> audience. Clearly, <strong>the</strong> only way this project can be successful is if <strong>the</strong><br />
majority <strong>of</strong> farms understand and agree with <strong>the</strong> approach. Following our presentation, we will<br />
make modifications to <strong>the</strong> proposed standardized approach based on <strong>the</strong> audience feedback. The<br />
finalized standardized approach, and supporting tools, will <strong>the</strong>n be available by <strong>the</strong> end <strong>of</strong><br />
December 2006 for anyone to download from <strong>the</strong> WSDC website (Sheepmilk.biz) so you can<br />
start using <strong>the</strong> tools in 2007. Prior to next year’s <strong>symposium</strong>, we will solicit <strong>the</strong> results from<br />
participating farms for a presentation to <strong>the</strong> general membership. We will establish a process for<br />
you to anonymously provide this information so that your identity will be protected.<br />
Outline <strong>of</strong> Approach<br />
1) Present <strong>the</strong> bigger picture <strong>of</strong> farm accounting<br />
a) Farm Enterprises<br />
b) Direct, Fixed and Overhead costs<br />
c) Complexities <strong>of</strong> accurate accounting<br />
d) Today’s session goal as a subset <strong>of</strong> <strong>the</strong> big picture<br />
2) Define basic parameters<br />
a) Terms and definitions<br />
b) Standardized set <strong>of</strong> cost/expense categories<br />
c) Determination <strong>of</strong> direct vs. fixed cost<br />
2
3) Recordkeeping<br />
a) Degrees <strong>of</strong> detail and appropriate methods<br />
b) Example forms and procedures<br />
4) Calculations<br />
a) Direct cost <strong>of</strong> milk production<br />
b) Break even analysis<br />
c) Considerations and limitations for decision making<br />
d) How to evaluate your results<br />
e) Available tools for cost <strong>of</strong> milk production<br />
Conclusion<br />
In <strong>the</strong> fields <strong>of</strong> agricultural economics, accounting, and statistics, many models and methods<br />
for farm budgeting, recordkeeping and analysis have been developed and are used regularly in<br />
<strong>the</strong> cow <strong>dairy</strong>, beef, crop farming, and o<strong>the</strong>r segments. The tools used vary in scope and<br />
complexity from a single enterprise <strong>of</strong> one farm business to state and national analysis <strong>of</strong> whole<br />
farm operations. We have studied a variety <strong>of</strong> resources, models and methods, and have met<br />
with several pr<strong>of</strong>essionals in <strong>the</strong>se fields to gain an understanding <strong>of</strong> current practices. We have<br />
attempted to draw upon this work to develop some relatively simple, farmer friendly tools that<br />
can be used in our situation.<br />
For those <strong>of</strong> you who have been to a number <strong>of</strong> <strong>the</strong>se symposia in <strong>the</strong> past, look around and<br />
take note <strong>of</strong> <strong>the</strong> number <strong>of</strong> ‘new faces’. Five years ago, <strong>the</strong> estimated number <strong>of</strong> <strong>sheep</strong> <strong>dairy</strong><br />
farms in North America was about 100. Today, <strong>the</strong> estimated number <strong>of</strong> <strong>sheep</strong> <strong>dairy</strong> farms in<br />
North America is still about 100. Of <strong>the</strong> 100 farms milking <strong>sheep</strong> 5 years ago, only about 30%<br />
are still milking. Based on <strong>the</strong>se numbers, <strong>the</strong> phenomena <strong>of</strong> high turnover in <strong>the</strong> <strong>sheep</strong> <strong>dairy</strong><br />
industry in not unique to <strong>the</strong> WSDC. It is now clear that <strong>the</strong> farmers currently milking <strong>sheep</strong> as<br />
well as those contemplating entering <strong>sheep</strong> <strong>dairy</strong>ing must ask both, “How much will I be paid for<br />
my milk”, as well as, “How much will it cost me to produce a pound <strong>of</strong> milk?”<br />
The long-term viability <strong>of</strong> <strong>the</strong> <strong>sheep</strong> <strong>dairy</strong> industry in North America requires <strong>the</strong> long term<br />
success <strong>of</strong> its <strong>dairy</strong> farms. In order for <strong>the</strong> <strong>sheep</strong> <strong>dairy</strong> industry to flourish and grow, we need to<br />
identify <strong>the</strong> critical issues around sustainability and to establish best practices that can benefit<br />
individuals and <strong>the</strong> entire industry. We hope that today’s discussion will be a first step in<br />
making this happen.<br />
3
THE DAIRY BUSINESS INNOVATION CENTER:<br />
A CATALYST FOR INNOVATION<br />
Kate Arding and Norman E. Monsen<br />
Dairy Business Innovation Center, Wisconsin <strong>Department</strong> <strong>of</strong> Agriculture Trade and<br />
Consumer Protection<br />
Madison, Wisconsin, USA<br />
Introduction and Overview <strong>of</strong> <strong>the</strong> Dairy Business Innovation Center and <strong>the</strong> Wisconsin<br />
Value Added Dairy Initiative Program<br />
The Wisconsin Value Added Dairy Initiative Program traces it’s origin to <strong>the</strong> mid and late<br />
1990’s. This period was <strong>the</strong> culmination <strong>of</strong> a 15 to 20 year down cycle in <strong>the</strong> state <strong>dairy</strong><br />
economy. During <strong>the</strong>se years <strong>the</strong> number <strong>of</strong> active <strong>dairy</strong> farms in Wisconsin decreased by<br />
15,000+ families along with a corresponding decrease in <strong>dairy</strong> manufacturing plants. Many<br />
factors can be listed as causes including; depressed milk prices, high interest rates, over<br />
expansion due to easy credit and government programs, and declining market share for cheese<br />
and o<strong>the</strong>r <strong>dairy</strong> products. Shortly after this period, Wisconsin lost its place as <strong>the</strong> nation’s <strong>dairy</strong><br />
leader.<br />
During this time frame many Wisconsin <strong>dairy</strong> farmers approached <strong>the</strong> Wisconsin <strong>Department</strong><br />
<strong>of</strong> Agriculture, Trade, and Consumer Protection to request assistance with looking at options so<br />
that <strong>the</strong>y might continue to farm. Many <strong>of</strong> <strong>the</strong>se farmers recognized that <strong>the</strong> milk <strong>the</strong>y were<br />
producing was unique and that <strong>the</strong>re should be potential to capture higher pr<strong>of</strong>its.<br />
To respond to <strong>the</strong> requests for assistance, a number <strong>of</strong> agencies organized a value added <strong>dairy</strong><br />
conference for late 1999. Two motives for <strong>the</strong> conference were identified: 1) to provide a means<br />
to distribute information, and 2) to measure interest. Conference organizers anticipated that<br />
approximately 40 to 50 would attend. All involved were shocked when registration totaled over<br />
270.<br />
As a result, state agencies began to assist Wisconsin farmers with activities that might help<br />
<strong>the</strong>m with <strong>the</strong>ir efforts to capture more value/pr<strong>of</strong>its for <strong>the</strong>ir milk. Agency efforts were limited<br />
as staff and budget time hadn’t been allocated. Included in activities/projects were field days,<br />
regulatory review and advocacy, grass root marketing efforts, and <strong>the</strong> development <strong>of</strong> a network<br />
<strong>of</strong> partners and resources.<br />
In 2001/2002, <strong>the</strong> Federal Government began to recognize <strong>the</strong> strength <strong>of</strong> <strong>the</strong><br />
artisan/specialty <strong>dairy</strong> movement in Wisconsin. Limited funding was allocated to Wisconsin<br />
projects as <strong>the</strong> USDA recognized that this area <strong>of</strong> work <strong>of</strong>fered <strong>the</strong> potential <strong>of</strong> developing ways<br />
that farmers might stay on <strong>the</strong>ir farms as well as streng<strong>the</strong>ning rural communities.<br />
In late 2002, <strong>the</strong> Wisconsin congressional staff to Washington became aware <strong>of</strong> <strong>the</strong> grass<br />
roots artisan <strong>dairy</strong> movement. After review <strong>of</strong> current projects and evaluation <strong>of</strong> potential<br />
benefits, Congress allocated 2 million dollars to help <strong>the</strong> Wisconsin <strong>dairy</strong> industry build milk<br />
supply, develop new markets and products, and to improve efficiencies in <strong>the</strong> value chain.<br />
4
Out <strong>of</strong> this allocation, <strong>the</strong> Dairy Business Innovation Center (DBIC) was created. The DBIC,<br />
as a non-pr<strong>of</strong>it organization, attempts to help <strong>the</strong> industry develop new markets, new products,<br />
and new processes. Clients range from small farmstead producers through some <strong>of</strong> Wisconsin’s<br />
largest cooperative and private <strong>dairy</strong> manufacturers. The DBIC, a virtual center without<br />
buildings or <strong>of</strong>fice space, contracts with state and national <strong>dairy</strong> consultants and partners to bring<br />
expertise to approved clients. Among <strong>the</strong> DBIC partners are <strong>the</strong> Wisconsin Milk Marketing<br />
Board (WMMB), <strong>the</strong> Wisconsin Cheese Makers Association, <strong>the</strong> UW-System, Wisconsin state<br />
agencies (DATCP, Commerce, Tourism, etc) and <strong>the</strong> Center for Dairy Research. Fur<strong>the</strong>r<br />
information on <strong>the</strong> DBIC can be found at www.dbicusa.org.<br />
An Overview <strong>of</strong> Challenges and Solutions Facing <strong>the</strong> Small-Scale Cheese Maker<br />
Within <strong>the</strong> last sixty years, <strong>the</strong> cheese industry has witnessed enormous changes and<br />
challenges both in Europe and <strong>the</strong> United States, and none has been more adversely affected than<br />
<strong>the</strong> small-scale cheese producer.<br />
When it comes to cheese, <strong>the</strong> U.S. has traditionally looked to Europe for inspiration.<br />
However, <strong>the</strong> European cheese industry has faced tremendous challenges and changes over <strong>the</strong><br />
last sixty years and as a result, <strong>the</strong> U.S. can learn from European mistakes and successes. Whilst<br />
Europe – and in particular <strong>the</strong> U.K. and France – have been primarily concerned with preserving<br />
<strong>the</strong> traditions <strong>of</strong> farmhouse cheese production, <strong>the</strong> U.S. is trying to establish those traditions.<br />
In <strong>the</strong> U.K., many factors contributed to <strong>the</strong> decline <strong>of</strong> <strong>the</strong> traditional farmhouse cheese: <strong>the</strong><br />
consequences <strong>of</strong> two world wars, subsequent changes in agricultural policy, <strong>the</strong> industrialization<br />
<strong>of</strong> agriculture, and <strong>the</strong> disappearance <strong>of</strong> <strong>the</strong> specialty retailer and cheese store led to near<br />
obliteration <strong>of</strong> small-scale cheese production. Equally worrying, was <strong>the</strong> parallel decline <strong>of</strong> <strong>the</strong><br />
specialty knowledge needed to produce and sell such cheeses.<br />
By <strong>the</strong> mid-1980’s, <strong>the</strong> farmhouse cheese industry in <strong>the</strong> U.K. was in crisis. Traditional<br />
British cheeses had all but disappeared and had been replaced by factory-produced versions,<br />
carrying <strong>the</strong> same name but bearing no resemblance to <strong>the</strong> original thing. Unlike France or Italy,<br />
<strong>the</strong> UK has no AOC/DOP system designed to protect <strong>the</strong> names or recipes <strong>of</strong> specialist cheeses.<br />
For example in 1939, <strong>the</strong>re were 405 on-farm producers <strong>of</strong> Cheshire. By 1986, <strong>the</strong>re was one<br />
producer - <strong>the</strong> Appleby family - remaining.<br />
However, despite this bleak picture, <strong>the</strong>re was hope. It came in <strong>the</strong> form <strong>of</strong> a small group <strong>of</strong><br />
people, spearheaded by Randolph Hodgson at Neals Yard Dairy, who were determined to<br />
prevent <strong>the</strong>se producers from becoming extinct. In <strong>the</strong> early days, <strong>the</strong> key to success lay in<br />
establishing a knowledgeable retail and wholesale outlet that could handle and sell farmhouse<br />
cheese. The crucial part lay in establishing a close working relationship between store and<br />
producer, providing <strong>the</strong>m with feedback, paying <strong>the</strong>m a fair price (and on time) and selling <strong>the</strong>ir<br />
cheeses to <strong>the</strong> end consumer in <strong>the</strong> condition that <strong>the</strong> producer would wish it to be sold. The net<br />
result <strong>of</strong> all this was that <strong>the</strong> producer was left to do <strong>the</strong> thing that <strong>the</strong>y do best – make cheese.<br />
The o<strong>the</strong>r crucial role <strong>of</strong> <strong>the</strong>se stores was to provide an educational platform for <strong>the</strong> public and to<br />
5
e-awaken people to <strong>the</strong> fact that <strong>the</strong>se cheeses simply taste better than <strong>the</strong>ir factory produced<br />
counterparts.<br />
As <strong>the</strong> farmhouse cheese industry began to regain some momentum, this same group <strong>of</strong><br />
people also began to try and influence some <strong>of</strong> <strong>the</strong> legislative issues surrounding farmhouse<br />
cheese production. This is a slow and torturous process. However, it is essential for <strong>the</strong>se<br />
producers to be able to continue in <strong>the</strong> face <strong>of</strong> <strong>the</strong> industrialization <strong>of</strong> <strong>the</strong> majority <strong>of</strong> our food<br />
sources.<br />
By <strong>the</strong> mid 1990’s, <strong>the</strong> industry was looking very different from one decade earlier. New<br />
cheese makers and cheeses were emerging, largely inspired by <strong>the</strong> revitalization <strong>of</strong> <strong>the</strong> traditional<br />
farmhouse cheese producers and <strong>the</strong> fact that a viable market was being established. New<br />
specialty cheese stores and wholesalers began to spring up, thus educating <strong>the</strong> public and<br />
generating demand for quality cheese on a wider basis.<br />
So how does <strong>the</strong> DBIC fit into all <strong>of</strong> this? Well, essentially <strong>the</strong>y are striving to achieve <strong>the</strong><br />
same goals as those mentioned above. Not only is <strong>the</strong> DBIC bringing toge<strong>the</strong>r <strong>dairy</strong> farmers and<br />
cheese producers with legislators and industry experts, and thus creating a viable future. They are<br />
also ensuring <strong>the</strong> longevity <strong>of</strong> this trend by providing an educational platform amongst <strong>the</strong> public<br />
and those interested in entering <strong>the</strong> industry.<br />
It is a system that works. Pro<strong>of</strong> <strong>of</strong> that lies in <strong>the</strong> U.K. model and <strong>the</strong> fact that <strong>the</strong>re are now<br />
280 small-scale cheese producers in <strong>the</strong> U.K. as opposed to approximately 33 in 1984. The same<br />
trend is happening in <strong>the</strong> U.S. and is exemplified by <strong>the</strong> increasing number <strong>of</strong> members <strong>of</strong> <strong>the</strong><br />
American Cheese Society.<br />
Two examples <strong>of</strong> <strong>the</strong> positive changes that are taking place in Wisconsin are at Uplands<br />
Cheese and Hidden Springs Farm. Uplands Cheese is a cow milk <strong>dairy</strong> and cheese production<br />
facility based near Dodgeville and Hidden Springs is a <strong>sheep</strong> milk <strong>dairy</strong> near Westby.<br />
Uplands Farm, Dodgeville, Wisconsin<br />
Uplands Cheese is owned by two couples. Mike and Carol Gingrich and Dan and Jeanne<br />
Patenaude.<br />
The business comprises a 300-acre farm and working <strong>dairy</strong> that was purchased in 1994. Up<br />
until 2004/5, cheese making took place at ano<strong>the</strong>r cheese plant, using milk from <strong>the</strong> Uplands<br />
herd.<br />
Mike and Carol Gingrich have lived on a small farm in Wisconsin since 1974. Dan also grew<br />
up on a small neighboring farm and, when he met <strong>the</strong> Gingriches, he owned and milked 30 cows.<br />
The pattern <strong>of</strong> <strong>dairy</strong> farming in Wisconsin is such that, traditionally, <strong>the</strong>re have always been<br />
a large number <strong>of</strong> small-scale farms. Typically, each farm would have between 15 and 30 cows.<br />
6
The original plan for Uplands was to sell milk year-round. However, when Mike tasted <strong>the</strong><br />
spring milk, he thought it was exceptional. Therefore, ra<strong>the</strong>r than ship it <strong>of</strong>f to <strong>the</strong> co-operative,<br />
he began to look around for a specialty item that would reflect <strong>the</strong> quality <strong>of</strong> <strong>the</strong> milk. He<br />
considered many different products, including ice cream and yogurt, but kept returning to cheese.<br />
Since Uplands is much smaller than o<strong>the</strong>r cheese making dairies in <strong>the</strong> state and <strong>the</strong>refore is<br />
unable to compete based on volume, Mike realized that in order to be successful <strong>the</strong>y needed to<br />
produce an extremely high quality and unique cheese<br />
Realizing that one <strong>of</strong> Uplands main assets is its high quality pasture, Mike began to focus on<br />
some European cheeses that are dependent on quality pasture in order to produce uniquely<br />
excellent milk. Excellent milk leads to excellent cheese. Ano<strong>the</strong>r common denominator is <strong>the</strong><br />
fact that <strong>the</strong> best pasture is a highly seasonal affair. Thus, <strong>the</strong> best cheeses are not only reliant on<br />
excellent pasture, but are only made at certain times <strong>of</strong> year – usually in <strong>the</strong> spring and summer.<br />
Armed with this information, Mike decided to experiment making cheese to a Beaufort recipe.<br />
Beaufort is well known both for its dependence on good pasture and its seasonality.<br />
Mike took <strong>the</strong> Cheese Makers Short Course at <strong>the</strong> University <strong>of</strong> Wisconsin-Madison (UW-<br />
Madison) <strong>the</strong>n followed through with a 12-month apprenticeship at a local cheese making<br />
facility. In order to produce cheese for sale in Wisconsin, it is a legal requirement to hold a<br />
cheese maker’s license.<br />
He <strong>the</strong>n approached <strong>the</strong> UW-Madison to ask for <strong>the</strong>ir assistance in developing and adapting<br />
<strong>the</strong> Beaufort recipe.<br />
The scientists at <strong>the</strong> Wisconsin Center for Dairy Research took up <strong>the</strong> challenge to help Mike<br />
develop his cheese. Working toge<strong>the</strong>r, <strong>the</strong>y developed <strong>the</strong> recipe, <strong>the</strong> original B. linens culture,<br />
procedure and methods. In <strong>the</strong> summer <strong>of</strong> 1999 at <strong>the</strong> Center’s test facility, <strong>the</strong>y produced eight<br />
different versions <strong>of</strong> four wheels with a view to taste-testing. The cheese that was chosen as best<br />
became <strong>the</strong> prototype for future production.<br />
Production <strong>of</strong> Pleasant Ridge Reserve began in earnest in June 2000. Ra<strong>the</strong>r than build a<br />
facility, Mike approached one <strong>of</strong> <strong>the</strong> local cheese making facilities and set up a rental agreement<br />
to make his cheese <strong>the</strong>re three times a week during <strong>the</strong> spring and summer months. However,<br />
since October 2005, cheese production has taken place in a purpose-built facility located at<br />
Uplands Farm. Maturation <strong>of</strong> <strong>the</strong> cheeses also takes place on site.<br />
Uplands produces one type <strong>of</strong> cheese and markets directly to customers across <strong>the</strong> country.<br />
In addition, <strong>the</strong>y use two distributors, but prefer to have control as to <strong>the</strong> final destination <strong>of</strong> <strong>the</strong>ir<br />
cheese. They have found farmer’s markets to be unsuccessful since <strong>the</strong>y only have one product<br />
to <strong>of</strong>fer and <strong>the</strong> price point is high.<br />
Pasture<br />
One <strong>of</strong> <strong>the</strong> deciding factors for <strong>the</strong> purchase <strong>of</strong> <strong>the</strong> farm, was that <strong>the</strong> buildings were centrally<br />
located. The advantage <strong>of</strong> this for a <strong>dairy</strong> farm is that <strong>the</strong> cows can move directly from <strong>the</strong><br />
7
pasture to <strong>the</strong> milking barn without having to traverse any roads, creeks or <strong>lakes</strong>. Thus <strong>the</strong><br />
property is continuous pasture and <strong>the</strong> goal is to graze one cow per acre.<br />
Since acquiring <strong>the</strong> farm in 1994, Dan has been actively working to improve <strong>the</strong> pasture.<br />
Frost broadcast seeding has played a major part in introducing clovers as well as orchard grass,<br />
both <strong>of</strong> which grow very well.<br />
The farm has just transitioned to become organic. Therefore, it is a goal to increase <strong>the</strong><br />
nitrogen levels through <strong>the</strong> introduction <strong>of</strong> legumes as opposed to <strong>the</strong> more conventional method<br />
<strong>of</strong> spreading liquid nitrogen fertilizer. In addition, a more thorough form <strong>of</strong> manure management<br />
is being introduced.<br />
Cows<br />
The original herd <strong>of</strong> 130 Holsteins was acquired in 1994. Dan <strong>the</strong>n added 30 cows from his<br />
own farm, some <strong>of</strong> which were crossbreds. Since <strong>the</strong>n, Uplands have continued to crossbreed.<br />
Currently, <strong>the</strong> herd consists <strong>of</strong> Holsteins crossed with one <strong>of</strong> <strong>the</strong> following breeds: Normandie,<br />
Tarantaise, Abondance, New Zealand Jersey, New Zealand Friesian, Brown Swiss, Ayrshire or<br />
Jersey.<br />
The main desirable traits that Dan is striving for in <strong>the</strong> breeding program are longevity <strong>of</strong><br />
lactation and a good position <strong>of</strong> <strong>the</strong> udders. Additionally, <strong>the</strong>y are looking more carefully at<br />
casein amounts in <strong>the</strong> milk since this has a very direct affect on cheese production.<br />
Dan likes a Holstein/Jersey mix because he feels that <strong>the</strong> breed is docile and hearty. The<br />
Normandie crosses proved temperamental as did <strong>the</strong> Ayrshire who tended to be aggressive and<br />
difficult to milk. The Brown Swiss turned out to be large animals and not very agile.<br />
All <strong>the</strong> cows are serviced via AI. Due to <strong>the</strong> importance <strong>of</strong> seasonality at Uplands, it is<br />
crucial to streamline most <strong>of</strong> <strong>the</strong> cows and for <strong>the</strong>m to become impregnated in one AI cycle.<br />
Ideally, 150 cows would calf in April, <strong>the</strong>n be milked for 200 days before drying <strong>the</strong>m <strong>of</strong>f<br />
toge<strong>the</strong>r. Despite this, Mike also adopts a balanced approach. In <strong>the</strong> event that <strong>the</strong>re is a good<br />
cow who for some reason has failed to become pregnant from <strong>the</strong> first service, <strong>the</strong>y will keep her<br />
for a year and try again. If <strong>the</strong> second attempt fails, <strong>the</strong>n she will be sold.<br />
In 2003, Uplands hired a new AI technician from <strong>the</strong> local area who has helped change <strong>the</strong>ir<br />
system. This specialist looks at any problems <strong>the</strong>y are encountering such as reproductive<br />
infections, cysts, etc. and checks every cow at 20 days into milking. If <strong>the</strong>re is a problem, that<br />
cow is kept under surveillance until <strong>the</strong> problem is understood, solved, and kept under control.<br />
In 2003, <strong>the</strong> conception rate was 57%.<br />
Cows are dried up in January. In mid-November <strong>the</strong> ground freezes and <strong>the</strong>refore <strong>the</strong> cows<br />
are fed on hay, silage and supplements. By May <strong>the</strong>y are once again on a 100% pasture fed diet.<br />
8
Cheese<br />
As previously mentioned, Pleasant Ridge Reserve is a firm, raw milk cheese in <strong>the</strong> style <strong>of</strong><br />
Beaufort. Development <strong>of</strong> <strong>the</strong> cheese took two years, but largely due to <strong>the</strong> work and help from<br />
<strong>the</strong> Center for Dairy Research, <strong>the</strong>re was no wastage during this time.<br />
Traditional Beaufort is made in very large wheels weighing between 70-100 lbs. and<br />
measuring 3 ft. in diameter. For practical purposes, Mike chose to use traditional Gouda molds<br />
and adapted <strong>the</strong> recipe to accommodate <strong>the</strong> difference in maturation.<br />
Their first year, 2000, saw <strong>the</strong> production <strong>of</strong> 600 wheels. At this stage, <strong>the</strong>y had little idea as<br />
to how <strong>the</strong> marketing and sales <strong>of</strong> <strong>the</strong>ir cheese would evolve. However, also in 2000, Uplands<br />
received a hugely deserved but completely unexpected boost. They won Best in Show at <strong>the</strong><br />
American Cheese Society competition.<br />
Maturing rooms<br />
There are three aging rooms, side by side, each <strong>of</strong> which is 27’ x 18’ with a 10’ ceiling.<br />
Refrigeration is provided by cold water pipes that run directly around <strong>the</strong> walls inside <strong>the</strong> room.<br />
These also negate <strong>the</strong> necessity for a fan which has a severe drying effect on cheeses with a B.<br />
linens culture.<br />
The walls are 5” thick and made <strong>of</strong> styr<strong>of</strong>oam, covered by thin white plastic sheeting (RFP or<br />
‘glass board’) that are easy to clean. Floors are sloped towards <strong>the</strong> door for drainage. For<br />
reasons <strong>of</strong> hygiene, <strong>the</strong>re are no direct drains in <strong>the</strong> aging rooms.<br />
The total capacity <strong>of</strong> <strong>the</strong> three maturing rooms is 7000 wheels.<br />
Cheeses are aged for a minimum <strong>of</strong> four months, however most wheels are aged for longer<br />
which necessitates more space being available. Mike has been experimenting with some 2-and<br />
3-year old wheels although somewhere between 4 and 11 months is optimum.<br />
Hidden Springs Farm, Westby, Wisconsin<br />
Hidden Springs Farm, owned by Brenda and Dean Jensen, is a sustainable <strong>sheep</strong> <strong>dairy</strong><br />
located in <strong>the</strong> Coulee Region amongst <strong>the</strong> beautiful rolling hills <strong>of</strong> southwestern Wisconsin.<br />
Brenda and Dean started <strong>the</strong>ir <strong>dairy</strong> with just 50 <strong>sheep</strong>. Today <strong>the</strong>y milk 116 Lacaune and<br />
East Friesian <strong>dairy</strong> <strong>sheep</strong> and have 110 lambs. They are constantly striving to improve <strong>the</strong><br />
genetics <strong>of</strong> <strong>the</strong> herd. Friesians are known for being excellent producers and for having a calm<br />
temperament. Lacaune are renowned for producing milk with higher fat and protein than many<br />
o<strong>the</strong>r breeds.<br />
Brenda grew up on a small farm and had a career as a corporate manufacturing manager. In<br />
June 2006, having gained her cheese maker’s license, she left corporate America in order to<br />
pursue <strong>the</strong> <strong>sheep</strong> creamery and cheese making.<br />
9
Dean is a mental health <strong>the</strong>rapist with his own practice. He predominantly works with <strong>the</strong><br />
Amish communities that surround <strong>the</strong> Jensen’s farm, and both Dean and Brenda have a deep<br />
appreciation <strong>of</strong> Amish values and work practices. They employ Amish friends and neighbors for<br />
milking and construction. The fields at Hidden Springs are plowed by Percheron draft horses.<br />
Donkeys deter coyotes and o<strong>the</strong>r predators from bo<strong>the</strong>ring <strong>the</strong> <strong>sheep</strong> and lambs, and all <strong>the</strong> <strong>sheep</strong><br />
graze seasonally on <strong>the</strong> Jensens’ 30 acres <strong>of</strong> fenced pasture.<br />
Brenda has only recently begun to make cheese. The cheese that she is currently producing<br />
is called Driftless and is named for <strong>the</strong> region in which Hidden Springs is located. The cheese is<br />
a s<strong>of</strong>t fresh <strong>sheep</strong>’s milk cheese, and it is already becoming popular amongst specialist retail<br />
stores and high-end restaurants in Wisconsin.<br />
Brenda also travels to two farmer’s markets each week to sell her cheese.<br />
10
ORGANIC SHEEP DAIRY: MARKETS AND PRODUCTION<br />
Jody Padgham<br />
Education Director, Midwest Organic and Sustainable Education Service (MOSES),<br />
Spring Valley, Wisconsin, USA<br />
jody@mosesorganic.org<br />
The Organic Market<br />
The International and U.S. organic markets are growing quickly, and have been for <strong>the</strong> past<br />
15 years. Statistics show that <strong>the</strong> U.S. organic <strong>dairy</strong> market has been growing at a rate <strong>of</strong> over<br />
25% for several years. 1 The Organic Trade Association (www.ota.com) states that 66% <strong>of</strong> U.S.<br />
consumers report that <strong>the</strong>y use organic products at least occasionally. A 2002 literature review<br />
from Canada states that “The intention to buy more organic food ranges from 16% in <strong>the</strong> U.S. to<br />
53% in India; worldwide it is approximately 30%.” 2 Thousands <strong>of</strong> new consumers are buying<br />
organic products each week, as education about “<strong>the</strong> organic difference” and why one may<br />
choose organic products reaches a broader consumer base.<br />
The availability <strong>of</strong> organic products has also expanded, even reaching into main-stream<br />
companies such as General Mills foods, Hunts and Heins, Dean Foods and recently Kemps Dairy<br />
products. These ultra-large companies would not be joining <strong>the</strong> organic market if <strong>the</strong>y didn’t<br />
consider <strong>the</strong> market demand to be strong and growing.<br />
Buyers <strong>of</strong> specialty cheeses are also supportive <strong>of</strong> organic products. A 2000-2001 nor<strong>the</strong>rn<br />
California study <strong>of</strong> specialty cheese consumers found that buying organic is very important to<br />
21.2%, important to 51.5%, makes no difference to only 15.2% and is not important to only<br />
12.1% 3<br />
In an article titled “Emerging Top Food Trends in <strong>the</strong> U.S. and Abroad”, <strong>the</strong> Institute <strong>of</strong> Food<br />
Technologists name “inherently healthy, fancy and farm-friendly” among <strong>the</strong>ir top five qualities<br />
that consumers will be seeking in <strong>the</strong> near future. 4 What a perfect description <strong>of</strong> organically<br />
produced <strong>sheep</strong> <strong>dairy</strong> products!<br />
Who Buys Organic?<br />
An assessment <strong>of</strong> <strong>the</strong> organic market in The Gourmet Retailer notes that <strong>the</strong> organic<br />
consumer is not that different than <strong>the</strong> non-organic consumer. “Contrary to conventional<br />
wisdom, organic consumers are not significantly more affluent than <strong>the</strong> U.S. public as a whole,<br />
but instead have an average or slightly above-average income vs. that <strong>of</strong> all U.S. consumers.<br />
Nei<strong>the</strong>r are organic consumers a fringe or an "alternative" group culturally; <strong>the</strong>y are basically<br />
1 “Recent Growth Patterns in <strong>the</strong> U.S. Organic Foods Market” USDA-Economic Research Service, Agricultural<br />
Information Bulletin Number 777, September 2002.<br />
2 A Pr<strong>of</strong>ile <strong>of</strong> <strong>the</strong> Organic Industry and Its Issues, Rosalie Cunningham and Betty Vladicka, Government <strong>of</strong><br />
Alberta, Canada, 2002.<br />
3 Test Marketing Pasture-produced Artisan Cheeses. Tim Pedrozo, Pedrozo Dairy and Cheese Company. SARE<br />
funded grant research. 2002.<br />
4 Emerging Top Food Trends in <strong>the</strong> U.S. and Abroad, Institute <strong>of</strong> Food Technologists, April 2005<br />
11
mainstream citizens who are similar to most U.S. consumers in <strong>the</strong> majority <strong>of</strong> <strong>the</strong>ir attitudes,<br />
beliefs, behaviors, and purchase patterns. The ethnicities <strong>of</strong> organic consumers are also similar to<br />
<strong>the</strong> overall U.S. population's ethnic makeup.” 5<br />
The article goes on to note, however, that organic consumers are a special group in one<br />
important way. Their education level is considerably higher than that <strong>of</strong> most Americans.<br />
The percentage <strong>of</strong> college and post-college graduates among organic consumers is nearly<br />
fifty percent higher than that <strong>of</strong> <strong>the</strong> U.S. population. The article concludes “this leads to <strong>the</strong><br />
fact that <strong>the</strong>y read and understand labels. Organic consumers possess knowledge about<br />
ingredients, both <strong>the</strong> good stuff and <strong>the</strong> bad stuff, far deeper than most U.S. consumers.”<br />
Why Buy Organic?<br />
The Canadian review again states that “Roughly two-thirds <strong>of</strong> <strong>the</strong> population in most<br />
countries believe that organic food is safer and healthier and about <strong>the</strong> same proportion are<br />
willing to pay a ten percent premium for it. Consumer perception is that organic production<br />
practices address many <strong>of</strong> <strong>the</strong>ir health and safety concerns.” 6<br />
According to a national consumer opinion poll conducted by Roper Public Affairs, seven in<br />
ten Americans express some concerns about <strong>the</strong> health risks <strong>of</strong> pesticides, hormones, antibiotics<br />
and o<strong>the</strong>r chemicals used in food production. The survey found consumers felt smaller scale<br />
family farms were more likely to care about food safety than large-scale industrial farms, and<br />
that it was important to know whe<strong>the</strong>r food is grown or produced locally or regionally.<br />
An article published in The Gourmet Retailer summarizes <strong>the</strong> motivations <strong>of</strong> <strong>the</strong> typical<br />
organic consumer:<br />
“Following are four basic reasons in order <strong>of</strong> importance why consumers buy organic foods:<br />
- Taste. Organic foods are chosen because <strong>the</strong>y have strong positive taste associations.<br />
Consumers associate <strong>the</strong> taste <strong>of</strong> organic with simple, understandable benefits, such as freshness,<br />
purity, wholesomeness, less processed, etc. Organic food is seen as "<strong>the</strong> way nature intended," or<br />
"<strong>the</strong> way it should be," along with <strong>the</strong> belief that nature intended food to be delicious, as well as<br />
nutritious.<br />
- Health. Organic consumers seek to have better personal health over a longer period.<br />
- Safety. As a pathway to health, organic consumers think about food safety as it relates to purity.<br />
They are concerned about <strong>the</strong>ir food containing pesticides, hormones, antibiotics, and o<strong>the</strong>r<br />
chemicals. They seek foods <strong>the</strong>y perceive to be more "pure" and less "tainted." Such concern is<br />
heightened for parents and o<strong>the</strong>r primary purchasers buying food for <strong>the</strong>ir families.<br />
- Environment. Organic consumers are generally concerned about <strong>the</strong> environment. They also<br />
have an "action orientation," a belief that food dollars can be directed to enact positive change.” 7<br />
Studying <strong>the</strong> qualities listed above, it is clear that <strong>the</strong> average organic consumer would be a<br />
perfect candidate to choose an organic <strong>sheep</strong> milk product. Sheep milk produces excellent tasting<br />
5<br />
Merchandising Organic Products, By Clark F. Driftmier, The Gourmet Retailer, May 2001<br />
6<br />
A Pr<strong>of</strong>ile <strong>of</strong> <strong>the</strong> Organic Industry and Its Issues, Rosalie Cunningham and Betty Vladicka, Government <strong>of</strong><br />
Alberta, Canada, 2002.<br />
7<br />
Merchandising Organic Products, By Clark F. Driftmier, The Gourmet Retailer, May 2001<br />
12
products that, especially combined with <strong>the</strong> benefits <strong>of</strong> a grass-based product, have strong health<br />
qualities. Organic <strong>sheep</strong> milk products are pure, generally with no pesticide residues and without<br />
antibiotic residues. Recently a <strong>sheep</strong> <strong>dairy</strong> producer reminded me that <strong>sheep</strong> are known as “The<br />
Golden Ho<strong>of</strong>ed <strong>Animal</strong>,” due to <strong>the</strong>ir ability to increase pasture fertility and <strong>the</strong>ir gentle impact<br />
on <strong>the</strong> landscape.<br />
What About <strong>the</strong> Price?<br />
Organic cow <strong>dairy</strong> producers receive a price premium for <strong>the</strong>ir raw products. They have<br />
avoided <strong>the</strong> path <strong>of</strong> typical commodity price competition and low price pressures by controlling<br />
supply and working toge<strong>the</strong>r to support price to marketers and distributors. Farmer alliances,<br />
such as <strong>the</strong> Nor<strong>the</strong>ast Organic Dairy Producers Association (NODPA) and it’s sister here in <strong>the</strong><br />
Midwest, MODPA, have been important in assuring fair prices to organic <strong>dairy</strong> producers. With<br />
organic cow <strong>dairy</strong> demand currently outstripping supply, pay price to farmers is <strong>the</strong> highest it has<br />
ever been, with some pay prices double conventional milk prices.<br />
Organic prices to <strong>the</strong> consumer have been 10 to 50% higher than that for similar non-organic<br />
products. With <strong>the</strong> entrance <strong>of</strong> large retailers such as WalMart into <strong>the</strong> organic equation, this<br />
trend may be changing. In industries such as <strong>sheep</strong> <strong>dairy</strong>, where <strong>the</strong> producers can control supply<br />
to processors, a premium for organic products could likely be maintained.<br />
An Ohio study done <strong>of</strong> upscale natural foods customers in 2004 reported “Loyal organic<br />
consumers may not be highly sensitive to organic food prices.” And “Consumers would be<br />
willing to pay <strong>the</strong> largest price premium for products made with 100% organic ingredients.”<br />
(Labels as “100% Organic” vs “made with organic ingredients.”) O<strong>the</strong>r qualities consumers were<br />
willing to pay a premium for, at a lesser rate than for organic, were “pesticide free,” “locally<br />
grown,” and “non-GMO.” 8<br />
Although <strong>sheep</strong> <strong>dairy</strong> products tend to be in high priced categories, it is likely that <strong>the</strong><br />
average organic consumer will be willing to pay a moderate premium for an organic product.<br />
Although organic <strong>sheep</strong> <strong>dairy</strong> products are currently rare in <strong>the</strong> U.S., <strong>the</strong>y are available in Europe<br />
and do demand moderate price premiums <strong>the</strong>re.<br />
Cost <strong>of</strong> Production<br />
Data analyzing <strong>the</strong> cost <strong>of</strong> organic <strong>dairy</strong> production has just recently begun to be collected.<br />
Tom Kriegl, from <strong>the</strong> University <strong>of</strong> Wisconsin-Madison, Center for Dairy Pr<strong>of</strong>itability, is<br />
currently collecting data from organic cow dairies in Wisconsin, <strong>the</strong> Nor<strong>the</strong>ast U.S. and Quebec<br />
for an ongoing study on organic <strong>dairy</strong> pr<strong>of</strong>itability. Preliminary studies show that organic dairies<br />
in <strong>the</strong> Midwest are pr<strong>of</strong>itable, and have lower costs for purchased feed, veterinary and medicine,<br />
depreciation <strong>of</strong> purchased livestock, chemicals and non-dependant labor. However, <strong>the</strong> organic<br />
farms studied have higher costs for: repairs, fuel, supplies, marketing, seeds, fertilizer and lime.<br />
Dairy herds in <strong>the</strong> Nor<strong>the</strong>ast have much higher purchased feed costs, and so pr<strong>of</strong>itability <strong>the</strong>re<br />
for organic systems may be lower unless <strong>the</strong> price premium is higher. Many cow dairies report<br />
8 A consumer Survey <strong>of</strong> Specialty Food Shoppers: Understanding <strong>of</strong> <strong>the</strong> National Organic Program and<br />
Willingness to Pay. Neal H. Hooker, Marvin T. Batte and Jeremy Beaverson, Ohio State University, May 2004.<br />
13
that lowered animal stress in <strong>the</strong>ir organic systems results in longer milking tenures for <strong>the</strong>ir<br />
cows, with many organic dairies getting strong production from 10 and even 15 year old cows.<br />
This reduces replacement costs and helps raise pr<strong>of</strong>itability.<br />
Studies have not been done to compare costs <strong>of</strong> a U.S. organic <strong>sheep</strong> <strong>dairy</strong> operation with a<br />
non-organic system. However, based on what is beginning to be understood about organic cow<br />
dairies, and <strong>the</strong> differences in production systems between cows and <strong>sheep</strong>, it is not unreasonable<br />
to assume that organic <strong>sheep</strong> milk production will not increase costs <strong>of</strong> production significantly.<br />
Marketing <strong>the</strong> Organic Difference<br />
The Gourmet Retailer highlights how to appeal to <strong>the</strong> organic consumer: “The stories<br />
behind <strong>the</strong> food products must be told accurately to preserve au<strong>the</strong>nticity. If <strong>the</strong> food truly is<br />
what is described, <strong>the</strong>n organic consumers will embrace <strong>the</strong> products and over time, become<br />
more emotionally involved. However, organic consumers are likely to uncover any<br />
miscommunication, inaccuracy, or false description, <strong>the</strong>reby leading <strong>the</strong>m to permanently<br />
reject <strong>the</strong> products. In certain cases, not only will organic consumers reject <strong>the</strong> product, but<br />
some <strong>of</strong> <strong>the</strong> more activist ones will use e-mail, chat rooms, and <strong>the</strong> like to expose and<br />
communicate what <strong>the</strong>y perceive to be false presentations <strong>of</strong> <strong>the</strong> products' identities to friends<br />
or even <strong>the</strong> media.<br />
Organic consumers will be fascinated by information about <strong>the</strong> place <strong>of</strong> origin, <strong>the</strong> farmers,<br />
<strong>the</strong> farm, <strong>the</strong> region and its special qualities, <strong>the</strong> methods <strong>of</strong> growing and harvesting, <strong>the</strong> care<br />
taken <strong>of</strong> <strong>the</strong> land, and <strong>the</strong> way that <strong>the</strong> food fits within <strong>the</strong> region's culture. If presented in a<br />
compelling way, organic consumers will hungrily absorb every word about <strong>the</strong> food -- <strong>the</strong>y may<br />
even plan a visit to <strong>the</strong> farm itself.<br />
The food and its "story" are also important to organic consumers. They genuinely care about<br />
food, its origins, its history, and who produced it. Organic consumers are also more likely to be<br />
"foodies" and are willing to pay more for good food -- up to double in certain cases -- and <strong>the</strong>y<br />
have fewer price barriers where food quality and taste are concerned.” 9<br />
Organic <strong>sheep</strong> <strong>dairy</strong> producers would have a <strong>great</strong> story to tell, with lively <strong>sheep</strong> on green<br />
pastures and a quality product with complex flavors. Consumers would respond well to a welltold<br />
organic <strong>sheep</strong> <strong>dairy</strong> story.<br />
Organic Market Conclusions<br />
Looking at what <strong>the</strong> average organic consumer wants, and is willing to pay for, it is logical<br />
that <strong>the</strong> organic market is ready to support organic <strong>sheep</strong> <strong>dairy</strong> products. High quality, good<br />
tasting, nutrient-rich, chemical-free, pasture-based, family-farmed are all qualities <strong>the</strong> rising<br />
number <strong>of</strong> organic consumers are looking for and willing to support. They will even pay a higher<br />
price to be assured that <strong>the</strong>y are supporting <strong>the</strong>se qualities. The <strong>sheep</strong> <strong>dairy</strong> industry is well<br />
poised to enter <strong>the</strong> organic market with quality specialty products.<br />
9 Merchandising Organic Products, By Clark F. Driftmier, The Gourmet Retailer, May 2001<br />
14
Organic Milk Production Requirements<br />
Most <strong>sheep</strong> <strong>dairy</strong>ing is a relatively low-input farming system. Especially grass-based systems<br />
will have relatively few major changes to convert <strong>the</strong>ir herds to organic production. However, a<br />
few <strong>of</strong> those changes represent significant alterations in management perspective. The major<br />
challenges in organic <strong>sheep</strong> milk production may be access to pasture, feeding lambs, parasite<br />
control and production or purchase <strong>of</strong> organic feed.<br />
Because organic production systems are limited in <strong>the</strong>ir use <strong>of</strong> non-natural inputs, <strong>the</strong> focus<br />
<strong>of</strong> <strong>the</strong> farm activity must be on preventative management - creating environments where<br />
problems are least likely to happen. This concept relates to feed and pasture production as well<br />
as animal health and management. The basis <strong>of</strong> any successful organic system, animal or crop, is<br />
through effective soil management. This involves supporting diverse soil biology, balancing<br />
minerals and improving soil organic matter. With a focus on improving soil, feed quality will<br />
improve and ultimately, animal health will become optimized, reducing <strong>the</strong> need for health<br />
interventions. Many farmers who have transitioned to organic animal management systems are<br />
amazed by <strong>the</strong> long-term improvements in animal health, reduction in veterinarian visits and<br />
improved longevity <strong>of</strong> <strong>the</strong>ir herds or flocks. <strong>Animal</strong> health relies on building <strong>the</strong> animals’<br />
immune system so that a natural reaction can fight <strong>of</strong>f <strong>the</strong> common hazards and infections. An<br />
animal with a compromised or weak immune system will fall prey to things a robust animal will<br />
fight <strong>of</strong>f. Stress is a significant catalyst to injury or illness, and all management practices should<br />
be planned to reduce flock and individual animal stress. Breeding and selection for disease and<br />
parasite resistance is a valuable tool in organic systems.<br />
The basics <strong>of</strong> an organic <strong>dairy</strong> system:<br />
1. Organic management for one year before <strong>the</strong> sale <strong>of</strong> organic milk. This involves feeding<br />
100% certified organic feed (including pasture) or feed in its third year <strong>of</strong> transition from<br />
your own farm.<br />
2. Only organic grains and forage. No GMO feed.<br />
3. <strong>Animal</strong>s must have access to pasture, representing a significant percent <strong>of</strong> feed intake as<br />
seasonally appropriate. Pasture must be certified organic (3 years <strong>of</strong> only approved<br />
practices).<br />
4. The entire flock must be transitioned at one time, animals may not be taken in and out <strong>of</strong><br />
organic production.<br />
5. No non-approved practices for health care. Vaccines are allowed, antibiotics are not<br />
allowed*, chemical wormers only in emergencies, no routine use. Herbal health products,<br />
homeopathic remedies, etc. allowed as long as <strong>the</strong>y do not include non-approved<br />
materials, such as fillers or flowing agents. (see resources) (*antibiotics must be used if<br />
<strong>the</strong>y are seen as <strong>the</strong> only way to save an animal’s life. If antibiotics are used, however,<br />
<strong>the</strong> animal must be taken out <strong>of</strong> organic production or sold, and will only produce nonorganic<br />
milk after this time.)<br />
6. Natural parasite control, involving proper pasture management and animal rotation and<br />
allowed herbal or mineral formulations. For more information see “Internal Parasites and<br />
Ruminants: Organic Answers.”<br />
http://www.mosesorganic.org/broadcaster/13.6intparisites.htm<br />
15
7. White salt and minerals are allowed, as long as <strong>the</strong>y do not include non-allowed flowing<br />
agents or fillers. (Mineral oil is NOT allowed for internal consumption, yellow prussiate<br />
<strong>of</strong> soda, a common flowing agent, is not allowed).<br />
8. Tail docking and de-horning are allowed.<br />
9. Rams do not need to be managed organically, except during <strong>the</strong> time <strong>the</strong>y are pastured<br />
with ewes.<br />
10. Housing should be well-planned with appropriate air circulation.<br />
11. There is no specification as to <strong>the</strong> timing <strong>of</strong> removing lambs from mo<strong>the</strong>rs. However, any<br />
milk replacer must be produced from only <strong>dairy</strong> products that are from non-rBGH cows.<br />
As <strong>of</strong> fall 2006, <strong>the</strong>re is no allowed milk replacer available. In lieu <strong>of</strong> milk replacer,<br />
organic whole milk must be fed (may be cow, <strong>sheep</strong>, goat).<br />
12. Pure iodine teat dip is allowed, but some dips are restricted.<br />
13. Milk house cleanup is basically <strong>the</strong> same as for non-organic systems, as long as<br />
procedures are installed to ensure pure wash water is <strong>the</strong> last product used before organic<br />
milk contacts a surface.<br />
14. Pest control in barns and milk houses is regulated.<br />
15. Treated wood is not allowed for new construction where <strong>the</strong>re is animal contact. Some<br />
certifiers do allow painted treated wood, check before you use it. Any treated wood in<br />
production systems before organic certification may be grandfa<strong>the</strong>red in. Alternatives<br />
include plastic, cedar, black locust, metal, fiberglass, etc.<br />
16. Comprehensive farm records must be maintained, including individual animal health,<br />
pasture management, and crop production etc. All animals must be somehow identified.<br />
Sample record keeping systems are available.<br />
To sell organic meat (Lamb)<br />
1. To produce an organic lamb for meat, <strong>the</strong> mo<strong>the</strong>r must be treated organically (feed,<br />
pasture, health, etc) for <strong>the</strong> last third <strong>of</strong> gestation (150 days / 3 = 50 days).<br />
2. Mo<strong>the</strong>rs may not be taken in and out <strong>of</strong> organic production.<br />
3. Lambs must be managed organically.<br />
4. Any animal not born <strong>of</strong> an organically managed mo<strong>the</strong>r may never be sold as organic<br />
meat.<br />
Organic Farm Certification<br />
In <strong>the</strong> United States, organic production is, since Oct 2002, regulated by <strong>the</strong> USDA. There is<br />
a 46-page law that describes what is allowed and not allowed in organic production. Canada is in<br />
<strong>the</strong> process <strong>of</strong> defining <strong>the</strong>ir own national organic law. To sell organic products in <strong>the</strong> U.S., you<br />
must abide by <strong>the</strong> regulations outlined by <strong>the</strong> USDA.<br />
Any farm with gross sales <strong>of</strong> organic product over $5,000 per year must be certified by a<br />
third-party organization in order to market organic products. You must also be certified to sell<br />
any ingredient that will be turned into an organic product (such as raw milk made into organic<br />
cheese.)<br />
16
To become certified, you must first find an organic certification agency. These agencies have<br />
been accredited by <strong>the</strong> USDA. A list <strong>of</strong> certification agents that operate around <strong>the</strong> U.S. may be<br />
found at <strong>the</strong> National Organic Program website at http://www.ams.usda.gov/nop/.<br />
The certification agency will send you an application packet; <strong>the</strong>re generally is a fee for this<br />
packet, commonly $50. It is recommended that you request this packet at least six months before<br />
you are ready to sell organic product. This will be months into your transition practices (<strong>the</strong><br />
number <strong>of</strong> months will depend on <strong>the</strong> complexity <strong>of</strong> your farm operation, 36 months for crop<br />
land or pasture, 12 months for animals). You will want to educate yourself about <strong>the</strong><br />
complexities <strong>of</strong> what is allowed and not allowed in organic production. To help with this, see <strong>the</strong><br />
Resources at <strong>the</strong> end <strong>of</strong> this paper. There are lists <strong>of</strong> products that are allowed and not allowed in<br />
<strong>the</strong> NOP Rule and on <strong>the</strong> website <strong>of</strong> <strong>the</strong> Organic Materials Review Institute (www.omri.org).<br />
The application packet will contain a copy <strong>of</strong> <strong>the</strong> National Organic Rule (also available at<br />
www.ams.usda.gov/nop) and o<strong>the</strong>r useful resources. You will be asked to fill out a<br />
comprehensive farm plan, which outlines your farm practices. This includes describing flock<br />
health practices, environmental management practices, weed and pest control strategies, manure<br />
management practices, etc. and will require that you draw a map <strong>of</strong> your farm.<br />
Once you have completed <strong>the</strong> application, you return it to <strong>the</strong> certification agency. They will<br />
let you know if <strong>the</strong>y have any questions. If not, <strong>the</strong>y will forward <strong>the</strong> application to a farm<br />
inspector, who will call you to set up an inspection appointment. When <strong>the</strong> inspector comes, <strong>the</strong>y<br />
will go over your application, your farm records, tour your farm and look at your animals. The<br />
inspector will complete a report, and turn it into <strong>the</strong> certification agency with any supporting<br />
documentation. The certification agency will make a determination as to if you are abiding by<br />
<strong>the</strong> NOP and qualify for organic certification. They will issue you a certificate if you qualify, and<br />
<strong>the</strong>n you can sell organic product. Each product you wish to sell (i.e. milk, lambs, corn) must be<br />
listed on <strong>the</strong> application and <strong>the</strong> certificate. Certification generally costs between $350 and $550<br />
annually, depending on how many products you are certifying and how much organic product<br />
you sell.<br />
For more information on organic certification, including how to certify organic crops, see <strong>the</strong><br />
MOSES Fact Sheets at (http://www.mosesorganic.org/factsheets/intro.htm).<br />
Organic Cheese Production<br />
To produce organic cheese, <strong>the</strong> certified organic milk must be transported in clean equipment<br />
to a facility that has been certified to process organic products. It is not especially difficult for a<br />
cheese or yogurt plant to become certified, even if <strong>the</strong>y also produce non-organic products.<br />
Generally organic products are produced <strong>the</strong> first run <strong>of</strong> <strong>the</strong> day/week so <strong>the</strong>y are produced in a<br />
clean system. Segregation must occur at all stages to isolate organic milk and products from nonorganic.<br />
There are a few specific practices and products that organic cheese makers must comply<br />
with:<br />
• Certified organic milk must be used. Any additions, such as powdered milk, cream or<br />
o<strong>the</strong>r kinds <strong>of</strong> milk must be certified organic to produce a 100% organic product. If o<strong>the</strong>r<br />
ingredients are not organic, <strong>the</strong> product can only be labeled as “made with organic<br />
17
ingredients.” For guidelines on this distinction and labeling requirements, see <strong>the</strong> NOP<br />
Rule.<br />
• Any o<strong>the</strong>r agricultural ingredients, such as flavorings (i.e. dill, basil, etc.) must be<br />
certified organic, if commercially available.<br />
• Any non-agricultural ingredients, such as salt, or calcium chloride, unless <strong>the</strong>y are on <strong>the</strong><br />
non-allowed list <strong>of</strong> <strong>the</strong> NOP, are allowed as long as <strong>the</strong>y do not have prohibited additives<br />
such as flowing agents.<br />
• Cultures and coagulants must by non-GMO. This will be a big issue, as although non-<br />
GMO are available, <strong>the</strong> GMO products are most commonly used. The cheesemaker must<br />
source non-GMO products and closely record <strong>the</strong>ir use and storage to prove no<br />
contamination has occurred.<br />
• Most sanitary practices are <strong>the</strong> same as for non-organic, but all surfaces touched by<br />
organic raw or finished products must be well flushed by water after any cleaning or<br />
sanitizing products have been used. Ei<strong>the</strong>r testing must be done or protocols developed to<br />
prove that <strong>the</strong> surface residue only contains pure water.<br />
• Any pest control must be mechanical within areas where organic raw or processed<br />
product is. If non-approved pest control methods are used (ie spraying cracks) a<br />
withdrawl period is mandated. Chemical fogging to prevent bacterial contamination is not<br />
allowed.<br />
Conclusion<br />
Organic production will not be for everyone. Organic cow <strong>dairy</strong> producers have said that<br />
organic production requires more overall management <strong>of</strong> <strong>the</strong> farm system. But <strong>the</strong>y also say that<br />
organic production is “less stressful and more fun.” Organic success is frequently based on <strong>the</strong><br />
development <strong>of</strong> custom solutions for each unique situation. <strong>Animal</strong> health tends to improve<br />
under organic management, as concentration on immune system function develops stronger<br />
animals. Breeding selection and culling are important tools; over time a flock with specialized<br />
traits to thrive within a given organic farm system can be developed. Organic systems are kind<br />
on <strong>the</strong> environment and when well managed, build soil and preserve resources.<br />
Consumers continue to show growing support for organic products. They identify organic<br />
with health, good taste and quality. They are loyal consumers, willing to pay for <strong>the</strong> qualities<br />
organic products encompass. Combined with family-farmed, pasture-raised or local, as many<br />
organic <strong>sheep</strong> products are, organic is a strong sales incentive. Organic <strong>sheep</strong> <strong>dairy</strong> products<br />
make sense and would <strong>of</strong>fer a quality product to a willing audience.<br />
Resources:<br />
Midwest Organic and Sustainable Education Service, MOSES . PO Box 339, Spring Valley,<br />
WI 54767. www.mosesorganic.org, 715-772-3153. Fact sheets, Guidebook to Organic<br />
Certification, Largest Organic Conference in <strong>the</strong> U.S., annually in Feb. in WI. Organic<br />
Broadcaster Newspaper, Upper Midwest Organic Resource Directory.<br />
18
ATTRA- <strong>the</strong> National Sustainable Agriculture Information Service. www.attra.org, PO Box<br />
3657 Fayetteveille, AR 72702. 800-346-9140. Online and published resources on organic and<br />
sustainable production.<br />
USDA National Organic Program (NOP) 1400 Independence Ave SW, room 4008 South,<br />
Washington, D.C., 20250. 202-720-3252. www.ams.usda.gov/nop The full listing <strong>of</strong> <strong>the</strong><br />
National Organic Rule, plus comments and any updates.<br />
NewFarm- www.newfarm.org Website with resources, articles, stories, price lists for organic<br />
farmers.<br />
OMRI- Organic Materials Review Institute- PO Box 11558, Eugene, OR. 541-343-7600.<br />
www.omri.org. Lists <strong>of</strong> approved products for organic production.<br />
19
DAIRY SHEEP PRODUCTION AND CHEESE MAKING IN THE FRENCH<br />
PYRENEES<br />
G. Lagriffoul 1 , J.M. Arranz 2 , JM Astruc 1 , E. Morin 1<br />
1 Institut de l’Elevage - Comité National Brebis Laitières<br />
Campus INRA de Toulouse, France<br />
2 GIS ID64 – Ordiarp - France<br />
Dairy <strong>sheep</strong> have been traditionally farmed in three mountainous areas in sou<strong>the</strong>rn France.<br />
With 10 million liters, Corsica represents about 5 % <strong>of</strong> <strong>the</strong> French production. With 177 million<br />
liters (71 %), Roquefort area is <strong>the</strong> biggest and <strong>the</strong> most famous. The <strong>dairy</strong> <strong>sheep</strong> production in<br />
French western Pyrenees (Béarn and Basque countries) represents 53 million liters, 21 % <strong>of</strong><br />
production. At <strong>the</strong> beginning <strong>of</strong> <strong>the</strong> 1970s, <strong>the</strong> production in <strong>the</strong> Pyrenees was about 10 millions<br />
liters and reached 16 million liters in 1980. During <strong>the</strong> last 25 years, <strong>the</strong> production was<br />
increased regularly by about 1 to 1.5 % per year, with an acceleration in <strong>the</strong> five past years to 2.5<br />
% per year.<br />
All <strong>the</strong> milk produced in <strong>the</strong> Pyrenees is processed into cheese: a typical Pyrenean <strong>sheep</strong><br />
milk cheese produced under “<strong>of</strong>ficial sign <strong>of</strong> quality” like Protected Designation <strong>of</strong> Origin (PDO)<br />
is Ossau-Iraty.<br />
The context <strong>of</strong> production is characterised by three local breeds, Basco-Bearnaise, Manech<br />
Red Face, and Manech Black Face and a traditional management system based on pasture and<br />
use <strong>of</strong> collective mountains. The climate, with mild winters (in <strong>the</strong> valley) and wet summers,<br />
allows <strong>the</strong> <strong>sheep</strong> grazing all through <strong>the</strong> year. The hilly relief limits <strong>the</strong> area <strong>of</strong> arable fields.<br />
The objective <strong>of</strong> this paper is to present an overview <strong>of</strong> <strong>the</strong> <strong>dairy</strong> <strong>sheep</strong> production and<br />
cheese making in western Pyrenees.<br />
1 – Breeds, Breeders and Milk Production<br />
1.1. Recent evolution<br />
During <strong>the</strong> last twenty years, <strong>the</strong> number <strong>of</strong> <strong>dairy</strong> farms in <strong>the</strong> Pyrenees has decreased from<br />
3,300 to 2,220 (- 30 %). In <strong>the</strong> same time, <strong>the</strong> number <strong>of</strong> <strong>dairy</strong> ewes increased from 380,000 in<br />
1985 to 481,000 in 2005 (+ 25 %). By itself, <strong>the</strong> evolution <strong>of</strong> <strong>the</strong> number <strong>of</strong> ewes can not explain<br />
<strong>the</strong> increase <strong>of</strong> milk production in <strong>the</strong> Pyrenees : + 40 % between 1985 to 2005 (Table 1). Both<br />
<strong>the</strong> improvement <strong>of</strong> <strong>the</strong> management systems and, above all, <strong>the</strong> efficiency <strong>of</strong> <strong>the</strong> genetic<br />
program have contributed to this evolution.<br />
Table 1. Recent evolution <strong>of</strong> <strong>dairy</strong> <strong>sheep</strong> production in <strong>the</strong> western Pyrenees (Pâtre 2006)<br />
1985 1995 2005<br />
Number <strong>of</strong> <strong>dairy</strong> <strong>sheep</strong> 380,000 463,300 481,400<br />
Number <strong>of</strong> breeders 3,300 2,648 2,223<br />
Total milk production (million liters) 21.8 37.5 54.0<br />
20
1.2. The average western Pyrenees <strong>dairy</strong> <strong>sheep</strong> farm<br />
A small area with a large part <strong>of</strong> pasture:<br />
- total farmland: 24.4 ha (60.3 acres)<br />
- principal forage area: 23.1 ha (57.1 acres). 67 % with permanent grassland.<br />
- For 74 % <strong>of</strong> <strong>the</strong> farms, <strong>the</strong> principal forage area is supplemented by 12 ha (29.7 acres)<br />
<strong>of</strong> “ drift pasture ”.<br />
- 80 % <strong>of</strong> <strong>the</strong> flocks are located in mountainous or hilly areas and 74 % use “collective<br />
mountain pastures”.<br />
A flock with local <strong>dairy</strong> <strong>sheep</strong> breed:<br />
- size <strong>of</strong> <strong>the</strong> flock: 260 <strong>dairy</strong> ewes (Manech Black Face, Manech Red Face, or Basco-<br />
Béarnaise)<br />
- annual milk production: 27,000 liters<br />
- milk production per ewe (all ewes present in <strong>the</strong> flock): 100 liters<br />
- milk composition: fat content 71.7 g/l, protein content 53.5 g/l<br />
- milk quality: SCC 858,000 cells/ml, bacterial count 82,900 germs/ml<br />
- number <strong>of</strong> sold lambs: 195<br />
- culling rate: about 20 %<br />
A herd <strong>of</strong> 15 beef cows in association with <strong>the</strong> <strong>dairy</strong> <strong>sheep</strong> flock:<br />
In 90 % <strong>of</strong> <strong>the</strong> farms, <strong>the</strong> <strong>dairy</strong> <strong>sheep</strong> flock is in association with ano<strong>the</strong>r production:<br />
- beef production: 75 % (with an average 15 cows <strong>of</strong> <strong>the</strong> breed “Blonde<br />
d’Aquitaine”)<br />
- <strong>dairy</strong> cow production: 11 % (with an average 17 <strong>dairy</strong> cows)<br />
- horses: 24 %<br />
A very busy family farm:<br />
The farm is a “family unit” with in average 1.8 “man-work-year” and <strong>the</strong> average age <strong>of</strong><br />
<strong>the</strong> producer is 43 years old.<br />
Nowadays, 40 % <strong>of</strong> <strong>the</strong> flocks are still hand-milked. When machine milking, <strong>the</strong> milking<br />
parlour is a pit with 24 places and 12 milking units<br />
20 % <strong>of</strong> <strong>the</strong> farmers make cheese on <strong>the</strong>ir farm.<br />
1.3. The diversity <strong>of</strong> <strong>the</strong> systems<br />
Beyond this average description, <strong>the</strong> systems are diverse. Four types <strong>of</strong> systems <strong>of</strong><br />
production are summarized in <strong>the</strong> Table 2.<br />
The four systems mainly differ in <strong>the</strong> local breeds used, <strong>the</strong> size <strong>of</strong> <strong>the</strong> farm and <strong>the</strong> percentage<br />
<strong>of</strong> farmstead cheese makers.<br />
21
Table 2. Description <strong>of</strong> <strong>the</strong> <strong>dairy</strong> <strong>sheep</strong> Pyrenees systems <strong>of</strong> production : results <strong>of</strong> <strong>the</strong> 800 flocks<br />
<strong>of</strong> <strong>the</strong> extension program in 2003 (E. Morin and al. 2006)<br />
Non- Intermediate Traditional System <strong>of</strong><br />
transhumance transhumance transhumance Bearn area<br />
system system system<br />
Percentage <strong>of</strong> <strong>the</strong> farms 33 % 30 % 20 % 10 %<br />
Total farm land 32 ha 28 ha 18 ha 27 ha<br />
(79 acres) (69 acres) (44 acres) (67 acres)<br />
Size <strong>of</strong> <strong>the</strong> flock* 291 221 244 240<br />
Dairy <strong>sheep</strong> breed Manech Red Manech Red Manceh Basco-<br />
Face Face Black Face Bearnaise<br />
Size <strong>of</strong> <strong>the</strong> beef cattle herd 16 17 12 18<br />
Farm <strong>dairy</strong> milk production (l) 36,200 20,500 21,500 21,100<br />
Percentage <strong>of</strong> farmstead<br />
cheese makers<br />
4 % 8 % 14 % 60 %<br />
* On average, <strong>the</strong> flocks involved in <strong>the</strong> extension program are larger.<br />
1.4. The breeds<br />
Nowadays, <strong>the</strong> local breeds represent 96 % <strong>of</strong> <strong>the</strong> <strong>dairy</strong> <strong>sheep</strong> in French Pyrenees. The<br />
proportion <strong>of</strong> <strong>the</strong> different breeds are :<br />
- Manech Red Face (MRF) 56 %<br />
- Manech Black Face (MBF) 23 %<br />
- Basco-Bearnaise (BB) 17 %<br />
- Lacaune 4 %<br />
Until now, several reasons have limited <strong>the</strong> development <strong>of</strong> <strong>the</strong> Lacaune breed :<br />
- local Pyreneans breeds are well adapted to <strong>the</strong>ir production systems with pasture and<br />
transhumance,<br />
- in accordance with <strong>the</strong> PDO “Ossau Iraty cheese”, only local breeds are allowed,<br />
- <strong>the</strong> Manech and Basco-Bearnaise breeding schemes are fully efficient.<br />
1.5. Breeding program<br />
The Manech and Basco-Bearnaise breeding program became fully efficient at <strong>the</strong> end <strong>of</strong> <strong>the</strong><br />
1980s. The program is based on a pyramidal scheme. The breeding tools are mainly used within<br />
<strong>the</strong> nucleus (flocks in <strong>of</strong>ficial milk recording), firstly to create genetic gain, and secondly to<br />
organize its diffusion by AI or natural mating towards <strong>the</strong> base population (Barillet, 1997). The<br />
rams to be progeny tested were born from assortative matings between elite rams and ewes <strong>of</strong> <strong>the</strong><br />
nucleus, and were chosen from 320 rams entering <strong>the</strong> breeding centers at 1 month <strong>of</strong> age. The<br />
best 210 entered <strong>the</strong> AI center <strong>of</strong> CDEO to be progeny tested in <strong>the</strong> nucleus. The rate <strong>of</strong> AI in <strong>the</strong><br />
nucleus ranged from 40 to 50 %.<br />
In 2005, 361 flocks (107,000 ewes) in <strong>of</strong>ficial milk recording were in <strong>the</strong> nucleus flocks : 220<br />
MRF flocks (70,000 ewes), 66 MBF flocks (18,000 ewes) and 75 BB flocks (19,000 ewes).<br />
22
During <strong>the</strong> last 15 years, <strong>the</strong> average milk yield (in <strong>the</strong> milking-only period) increased from<br />
64 liters (61 %) for <strong>the</strong> MRF, 37 litres for <strong>the</strong> MBF (42 %) and 45 liters for <strong>the</strong> BB (44 %). In<br />
2005, <strong>the</strong> milk production recorded in <strong>the</strong> nucleus was :<br />
- Manech Red Face : 168 liters in 150 days milking only period<br />
- Manech Black Face : 126 liters in 134 days milking only period<br />
- Basco-Bearnaise : 147 liters in 142 days milking only period<br />
Due to <strong>the</strong> pyramidal organization <strong>of</strong> <strong>the</strong> genetic program, <strong>the</strong> level <strong>of</strong> production in <strong>the</strong><br />
nucleus flocks, submitted to an <strong>of</strong>ficial milk recording (in average, 158 liters in 146 days) is<br />
higher than in <strong>the</strong> rest <strong>of</strong> <strong>the</strong> population. The difference represents about 15 years <strong>of</strong> selection.<br />
The annual genetic gain for milk yield explained a large part <strong>of</strong> <strong>the</strong>se evolutions.<br />
According to <strong>the</strong> cheese maker demand, <strong>the</strong> <strong>dairy</strong> selection objective was revised at <strong>the</strong><br />
beginning <strong>of</strong> <strong>the</strong> 2000s in order to take into account milk composition (fat and protein contents).<br />
The new goal is to improve <strong>the</strong> cheese quantity, both by improving <strong>the</strong> quantity <strong>of</strong> milk yield and<br />
stabilizing <strong>the</strong> milk composition. In 2002, <strong>the</strong> selection for scrapie resistance was implemented.<br />
2. The Management System<br />
2.1. Breeding system<br />
Like o<strong>the</strong>r Mediterranean <strong>dairy</strong> <strong>sheep</strong> livestock, <strong>the</strong> Pyrenees breeding system is based on<br />
out-<strong>of</strong>-season lambing, from October to January for adult ewes. The ewes are milked after a<br />
suckling period <strong>of</strong> about one month and dried <strong>of</strong>f in July or August, when <strong>dairy</strong> factories stop or<br />
reduce <strong>the</strong>ir activities. During summer, traditional mountain cheese making goes on, particularly<br />
in Béarn. The lambs are slaughtered at weaning (1 month old) for Christmas (traditional period<br />
<strong>of</strong> consumption <strong>of</strong> this type <strong>of</strong> lamb, particularly in Spain). The young ewes lambed in<br />
February/March, and <strong>the</strong> lambs are slaughtered during Easter period. After <strong>the</strong> suckling period,<br />
<strong>the</strong> ewes are milked twice a day. The cooled milk is collected every day, or more <strong>of</strong>ten every 2<br />
days, from November to August.<br />
2.2. Feeding<br />
Sheep graze all through <strong>the</strong> year, but during winter, pasture represents only about 25 % <strong>of</strong> <strong>the</strong><br />
ration. O<strong>the</strong>r forage is given in <strong>the</strong> barn. For a daily production <strong>of</strong> 1.75 liters (early lactation),<br />
example rations are:<br />
Ex1: 1.4 kg dry matter hay + 0.55 kg corn (grain) + pasture<br />
Ex2: 0.35 kg hay + 0.30 kg corn silage + 0.25 alfalfa hay (lucerne)<br />
+ 0.3 corn (grain) + pasture<br />
The amount <strong>of</strong> stored feed for one ewe for <strong>the</strong> year is 210 kg <strong>of</strong> forage and 80 kg <strong>of</strong><br />
concentrate (yc concentrate for <strong>the</strong> young female). We can estimate that pasture represents about<br />
50 % <strong>of</strong> <strong>the</strong> feeding resources. Sheep graze separately from <strong>the</strong> cattle. In general, <strong>the</strong> best forage<br />
<strong>of</strong> <strong>the</strong> farm is given in priority to <strong>the</strong> <strong>sheep</strong>. In May or June, <strong>sheep</strong> and cattle go to collective<br />
pasture (sometimes located in high mountains). The ewes are milked by hand and <strong>the</strong> milk is<br />
23
processed into cheese in mountain huts. Nowadays, <strong>the</strong> transhumance concerns about 70 to 75 %<br />
<strong>of</strong> <strong>the</strong> ewes.<br />
2.3. Economic point <strong>of</strong> view<br />
In 2004, <strong>the</strong> average milk price was about 0.94 €/l (1.19 $/l). The price depends on <strong>the</strong> milk<br />
quality :<br />
- hygienic factors : bacterial count, coliform count, butyric count, presence <strong>of</strong> antibiotic<br />
- milk composition : fat and protein contents<br />
- PDO rules <strong>of</strong> production<br />
The price <strong>of</strong> <strong>the</strong> home cheese, directly sold by <strong>the</strong> producer ranges from 14 €/kg (17.75 $/kg)<br />
to 15 €/kg (19.01 $/kg).<br />
On average in 2004, for <strong>the</strong> farmer’s that sell milk to a processor, <strong>the</strong> total income was about<br />
131 € (166 $)/ewe: <strong>the</strong> portion from milk was 73 % (96 € / 122 $) and <strong>the</strong> portion from lamb was<br />
22 % (29 € / 37 $).<br />
3. Cheese Production<br />
All <strong>the</strong> <strong>dairy</strong> <strong>sheep</strong> milk produced in <strong>the</strong> French Pyrenees is processed into cheese. In 2004, 8<br />
<strong>dairy</strong> factories processed 51 millions liters into 11,000 tons <strong>of</strong> cheese : 91 % pure ewe milk<br />
cheese and 9 % mixed cattle x ewe milk cheese.<br />
The size <strong>of</strong> <strong>the</strong> milk factories varies from 0.7 millions liters (28 producers) to 16.6 millions<br />
liters (700 producers). In addition to <strong>the</strong> two international firms <strong>of</strong> Lactalis and Bongrain, we can<br />
find local cooperatives and private processors. In 2006, <strong>the</strong>re were 1,765 producers that sold<br />
milk.<br />
About 400 farmers make cheese on <strong>the</strong>ir farm. The estimation <strong>of</strong> <strong>the</strong> farmstead production is<br />
1,600 tons <strong>of</strong> cheese (8 million liters <strong>of</strong> milk).<br />
The cheese belongs to <strong>the</strong> family <strong>of</strong> <strong>the</strong> unpasteurized pressed semi-hard cheeses. Full-cream<br />
milk is used. After resetting, <strong>the</strong> curd is separated, stirred and scalded in a vat at between 36 and<br />
44 °C. The curd is moulded and pressed before being salted. The cheese is ripened for at least 90<br />
days. This time allows producers to sell cheese all through <strong>the</strong> year even though <strong>the</strong> production<br />
<strong>of</strong> milk stops from August to November.<br />
PDO Ossau-Iraty cheese represents a third <strong>of</strong> <strong>the</strong> production. The name <strong>of</strong> <strong>the</strong> cheese came<br />
from two areas <strong>of</strong> <strong>the</strong> western Pyrenees: one located in Béarn (valley <strong>of</strong> Ossau) and <strong>the</strong> o<strong>the</strong>r in<br />
<strong>the</strong> Basque region (forest <strong>of</strong> Iraty). While a large part <strong>of</strong> <strong>the</strong> cheese made in <strong>the</strong> Pyrenees is not<br />
Ossau-Iraty cheese, 80 % <strong>of</strong> <strong>the</strong> milk is produced under <strong>the</strong> PDO rules whose <strong>the</strong> main are :<br />
- milk must come from <strong>the</strong> PDO area (<strong>the</strong> western Pyrenees, south <strong>of</strong> <strong>the</strong> river “Gave de<br />
Pau”)<br />
- <strong>the</strong> <strong>dairy</strong> ewe must be a local breed : Manech Black, Red Face, or Basco-Béarnaise<br />
- <strong>the</strong> feed must come from <strong>the</strong> PDO area.<br />
24
The growth <strong>of</strong> <strong>the</strong> market <strong>of</strong> Pyrenees cheese explains <strong>the</strong> evolution <strong>of</strong> <strong>dairy</strong> <strong>sheep</strong><br />
production. From 1992 to 2004, <strong>the</strong> cheese production more than doubled (5,000 tons to 11,000<br />
tons).<br />
In conclusion, <strong>dairy</strong> <strong>sheep</strong> production and cheese making is an important activity for <strong>the</strong><br />
western French Pyrenees. Despite <strong>the</strong>ir moderate size, a large majority <strong>of</strong> farms remain viable<br />
and <strong>the</strong> sector is dynamic.<br />
4. Some Addresses<br />
Interpr<strong>of</strong>ession Lait de Brebis des Pyrénées Atlantiques<br />
124 boulevard Tourasse – 64 000 Pau - France<br />
Association in charge <strong>of</strong> <strong>the</strong> management <strong>of</strong> <strong>the</strong> relationship between <strong>the</strong> milk producers and <strong>the</strong><br />
<strong>dairy</strong> factories<br />
Syndicat de Défense du fromage d’AOC Ossau-Iraty<br />
Baratchartenea Bourg, 64120 Ostabat Asme - France<br />
Association in charge <strong>of</strong> <strong>the</strong> PDO Ossau-Iraty cheese : definition <strong>of</strong> <strong>the</strong> PDO rules, technical<br />
support <strong>of</strong> <strong>the</strong> farm house producers…<br />
Centre Départemental de l’Elevage Ovin (CDEO)<br />
Quartier Ahetzia – 64 130 Ordiarp – France<br />
Cooperative in charge <strong>of</strong> <strong>the</strong> breeding program <strong>of</strong> <strong>the</strong> Pyrenean local breeds Manech and Basco-<br />
Bearnaise : milk recording, artificial insemination, extension services…<br />
GIS ID64<br />
Quartier Ahetzia – 64 130 Ordiarp – France<br />
The objective <strong>of</strong> <strong>the</strong> GIS ID64 is to carry out research and development programs focused on<br />
<strong>dairy</strong> <strong>sheep</strong> production and cheese making in <strong>the</strong> western Pyrenees.<br />
The research or <strong>the</strong> extension programs are conducted with <strong>the</strong> support <strong>of</strong> <strong>the</strong> national institute <strong>of</strong><br />
research like INRA (national agronomical research institute - http://www.inra.fr) and Institut de<br />
l’Elevage (national livestock institute - http://www.inst-elevage.asso.fr). The CNBL (national<br />
<strong>dairy</strong> <strong>sheep</strong> committee – CNBL – Campus INRA de Toulouse – SAGA – BP52627 – 31 326<br />
Castanet-Tolosan Cedex - France) ensures <strong>the</strong> links with <strong>the</strong> national programs and <strong>the</strong> o<strong>the</strong>r<br />
areas <strong>of</strong> production like Roquefort or Corsica.<br />
References<br />
Revue Pâtre n°536. 2006. Numéro Spécial lait de brebis. 126p.<br />
Morin E., Oçafrain M., Millet F., Barrrère C., Arranz JM., 2006. La filière ovin Lait des<br />
Pyrénées-Atlantiques. Document de travail<br />
Barillet F., 1997. Genetics <strong>of</strong> milk production. In: Pipper, I., Ruvinsky, A. (Eds), The Genetics <strong>of</strong><br />
Sheep. CAB International, pp 539-564, Chapter 20.<br />
Astruc JM. 2006. Bilan du contrôle laitier ovin en France. Campagne 2005. Compte rendu<br />
n°010678015. Institut de l'Elevage collection résultats.<br />
25
OVINE PROGRESSIVE PNEUMONIA AND CASEOUS LYMPHADENITIS – YOU<br />
CAN RAISE SHEEP WITHOUT THEM<br />
Holly Neaton, DVM<br />
Watertown, Minnesota, USA<br />
Ovine Progressive Pneumonia – OPP – Maedi Visna Virus<br />
“We bought our 50 Texel Sheep at a livestock auction in 2001. When we got <strong>the</strong>m home, we<br />
noticed some <strong>of</strong> <strong>the</strong>m coughing, but being ignorant about <strong>sheep</strong> thought <strong>the</strong>y just had a cold or<br />
were bo<strong>the</strong>red by <strong>the</strong> dust. The veterinarian said <strong>the</strong> older ones were probably getting pneumonia<br />
so we gave <strong>the</strong>m all LA200 and it did NOTHING! Then we started to notice that some <strong>of</strong> <strong>the</strong><br />
younger ewes in <strong>the</strong> prime <strong>of</strong> <strong>the</strong>ir lives would get this cough, start to lose weight and <strong>the</strong>n die<br />
about a year later. That’s when we started to get serious about this cough! So I started searching<br />
on <strong>the</strong> internet and ran across OPP. The listed symptoms explained o<strong>the</strong>r things we noticed about<br />
<strong>the</strong>se <strong>sheep</strong>. Like <strong>the</strong> hard udders (we called <strong>the</strong>m tennis ball udders) because <strong>the</strong>y would just get<br />
a lump but it wasn’t mastitis. Or <strong>the</strong> way some <strong>of</strong> <strong>the</strong>m would start to go around in circles or<br />
come up limping until <strong>the</strong>y lose weight. But <strong>the</strong> main symptoms are heavy breathing.”-------<br />
quote from a producer in <strong>the</strong> western United States.<br />
Ovine Progressive Pneumonia (OPP or Maedi-Visna) is a wasting disease caused by a slow<br />
growing lentivirus that lives in <strong>the</strong> white blood cells <strong>of</strong> <strong>sheep</strong>. It was recognized in 1915 in <strong>the</strong><br />
United States and has been a brewing problem in <strong>the</strong> <strong>sheep</strong> industry since. It has only been truly<br />
recognized as a threat to <strong>sheep</strong> production in <strong>the</strong> last 10-20 years. OPP is known as Maedi-Visna<br />
(maedi = difficult breathing, visna = wasting) in o<strong>the</strong>r countries <strong>of</strong> <strong>the</strong> world. There are several<br />
countries that claim to be MV free – Iceland, Australia, New Zealand and Finland.<br />
You may be familiar with similar lentivirus caused diseases in o<strong>the</strong>r species:<br />
• CAE in goats (caprine arthritis and encephalitis virus)<br />
• EIA in horses (equine infectious anemia or swamp fever)<br />
• Fe LV in cats (feline leukemia virus)<br />
• BIV in cows (bovine immunodeficiency – like virus)<br />
• HIV in humans (human immunodeficiency virus)<br />
OPP has caused much controversy among <strong>sheep</strong> producers and health pr<strong>of</strong>essionals over <strong>the</strong><br />
years. This virus has become more accepted as a major deterrent to <strong>sheep</strong> producers who work<br />
hard to raise <strong>sheep</strong> that will live up to <strong>the</strong>ir genetic potential. It is possible to eradicate this virus<br />
from a flock – those that have done so will testify to <strong>the</strong> fact that it is economically justified. And<br />
it makes it much more fun to raise <strong>sheep</strong>.<br />
USDA’s NAHMS (National <strong>Animal</strong> Health Monitoring System) 2001 Sheep Study*<br />
Data on <strong>sheep</strong> health and management practices were collected from 682 flocks in 22 states<br />
(US). These producers agreed to have blood drawn from up to 40 ewes from each flock and have<br />
26
<strong>the</strong>m tested for OPP using <strong>the</strong> cElisa test method. 21,369 samples were tested. The results are<br />
eye-opening:<br />
• 36.4% <strong>of</strong> <strong>the</strong> 682 flocks had at least one positive<br />
• 24.2% <strong>of</strong> <strong>the</strong> <strong>sheep</strong> tested were positive<br />
• Open range flocks had highest incidence: 80.7% <strong>of</strong> flocks, 45.1% <strong>of</strong> <strong>sheep</strong><br />
• 36% <strong>of</strong> farm flocks were positive with 17.1% <strong>of</strong> <strong>sheep</strong> positive<br />
• Central region revealed 46.6% flocks positive, 24.4% <strong>of</strong> <strong>sheep</strong><br />
• 31.3% <strong>of</strong> operations had never heard <strong>of</strong> OPP and 92.4% had never tested for <strong>the</strong> disease<br />
* USDA-APHIS Safeguarding American Agriculture; Veterinary Services, Center for<br />
Epidemiology and <strong>Animal</strong> Health: Ovine Progressive Pneumonia: Awareness, Management, and<br />
Seroprevalence Info Sheet December 2003<br />
Signs <strong>of</strong> Infection<br />
• Signs are rarely seen before 2 years <strong>of</strong> age<br />
• Chronic, unresponsive pneumonia – labored breathing, lagging behind <strong>the</strong> flock,<br />
coughing, nasal discharge, fever that may be due to secondary bacterial infection<br />
• Weight loss despite normal appetite<br />
• Hard udder: udder is symmetrically enlarged, meaty and doesn’t collapse when dry. Little<br />
or no milk produced and <strong>the</strong>refore hungry or starving lambs. This progresses with each<br />
lactation.<br />
• Arthritis: swollen hock and knee joints<br />
• Unsteady gait, twitching, stumbling, paralysis due to central nervous system involvement<br />
O<strong>the</strong>r Diseases to Rule Out<br />
• Scrapie<br />
• Paratuberculosis (Johne’s disease)<br />
• Caseous lymphadenitis<br />
• Parasitism<br />
• Dental disease<br />
• Mastitis<br />
• Nutritional deficiency<br />
Transmission and Occurrence<br />
• The virus lives in <strong>the</strong> lymphocytes. The infected cells replace healthy lung, mammary,<br />
joint, CNS tissue causing an almost scar tissue like mass.<br />
• The virus cannot live outside <strong>of</strong> <strong>the</strong> <strong>sheep</strong>’s body for more than a few minutes – an<br />
important fact to remember during eradication<br />
• The virus infects o<strong>the</strong>r <strong>sheep</strong> in 2 ways – through colostrum and milk to lambs and<br />
through respiratory secretions and nasal discharge to everyone else<br />
• Shared taggers, needles, tattooing equipment may possibly cause transmission<br />
• Semen and intra-uterine transmission is doubtful<br />
27
• In my personal experience, I have never diagnosed a Suffolk or Hampshire <strong>sheep</strong> with<br />
OPP though I have had testimony from producers that have purchased positively infected<br />
black-faced rams.<br />
• Certain breeds seem to have a higher rate <strong>of</strong> infection. Note <strong>the</strong> breed alliance list at <strong>the</strong><br />
end <strong>of</strong> this paper.<br />
Diagnosis <strong>of</strong> OPP<br />
Diagnosis <strong>of</strong> this disease is best provided through finding antibodies in <strong>the</strong> blood (serology).<br />
Because <strong>the</strong> virus is slow growing and hides in <strong>the</strong> cells, <strong>the</strong> <strong>sheep</strong> will be slow to make<br />
antibodies to it. The tests available are not perfect but, if used properly, will help in eradication.<br />
Diagnosis with a positive serological test in a clinically affected <strong>sheep</strong> is only a start. Testing to<br />
determine who may be infected and spreading <strong>the</strong> virus is <strong>the</strong> tricky part.<br />
There are two commonly used serological tests available.<br />
• AGID (agar gel immunodiffusion)<br />
- Very specific and rare to get false positives.<br />
- Only about 75% sensitive. The <strong>sheep</strong> has been infected a while before seroconverting.<br />
- May give false negatives early in infection – or suspects.<br />
- Difficult test to read so <strong>the</strong> lab technician reading it is very important.<br />
- Use a lab that runs <strong>the</strong>m regularly and has a record <strong>of</strong> accuracy.<br />
• cELISA (competitive enzyme-linked immunoabsorbent assay)<br />
- More sensitive test <strong>the</strong>refore can detect antibodies earlier in infection (2 weeks?)<br />
- Less specific due to sensitivity. O<strong>the</strong>r factors can trigger false positives.<br />
- Laboratory differences confuse results.<br />
• O<strong>the</strong>r tests available<br />
- PCR (polymerase chain reaction) reads DNA<br />
- Postmortem ID <strong>of</strong> virus<br />
Control <strong>of</strong> OPP<br />
If you decide to embark on an eradication program for your flock, testing every <strong>sheep</strong> over 6<br />
months <strong>of</strong> age will tell you what your incidence is. With this information, you can make<br />
decisions whe<strong>the</strong>r to cull and retest over a series <strong>of</strong> 6 month intervals or keep separate flocks and<br />
orphan raise your replacements. Don’t forget <strong>the</strong> rams.<br />
There are many factors that need to be considered in <strong>the</strong>se decisions – do you have genetics<br />
that you want to save, do you have time to orphan lambs, facilities to keep positive and negative<br />
flocks separate?<br />
• > 50% positive, probably orphan <strong>the</strong> females, maybe some ram lambs for breeding. Need<br />
to catch <strong>the</strong> wet lambs prior to nursing, preferably before <strong>the</strong>y hit <strong>the</strong> ground. Leave <strong>the</strong><br />
we<strong>the</strong>r lambs and feeder ewe lambs on <strong>the</strong> positive dams. The lambs need to be raised in<br />
28
separate facilities and tested at 4 months (?) and before lambing as yearlings to verify<br />
negative status.<br />
• < 50% positive, consider culling and retesting every 6 months. Three 100% negative tests<br />
are comforting. Testing a percentage <strong>of</strong> older ewes annually can be validating.<br />
The choice to eradicate this virus will also:<br />
• Give you <strong>the</strong> chance to choose o<strong>the</strong>r diseases to eradicate – Johne’s and caseous<br />
lymphadenitis for example.<br />
• Breeding stock will have more value (remember scrapie and <strong>the</strong> genotyping requests?).<br />
• Save feed costs.<br />
• Allow your flock to perform to its full potential – you can truly evaluate your genetics.<br />
What Have We Learned About OPP?<br />
• This is a very prevalent virus that is silently passed from <strong>sheep</strong> to <strong>sheep</strong> within a flock<br />
and between flocks through purchases <strong>of</strong> both ewes and rams.<br />
• Through <strong>the</strong> NAHMS study, we see that <strong>the</strong> incidence <strong>of</strong> OPP estimated 20 years ago<br />
was correct.<br />
• Flock owners (and veterinarians) all over <strong>the</strong> United States are ignorant about this virus<br />
• Many shepherds accept <strong>the</strong> signs <strong>of</strong> <strong>the</strong> disease as normal – would <strong>the</strong>y be amazed at how<br />
productive <strong>the</strong>ir flocks would be without <strong>the</strong> virus?<br />
• It is possible and economically prudent to eradicate this virus from a flock – especially a<br />
<strong>sheep</strong> <strong>dairy</strong> flock.<br />
• CAE virus in goats is not known (?) to infect <strong>sheep</strong> but could confuse testing results in an<br />
eradication program if goat colostrum/milk is used from CAE positive goats.<br />
• Possible to pass <strong>the</strong> virus from infected <strong>sheep</strong> in fair and show environments.<br />
Breed Association Alliances<br />
• American Border Leicester Association<br />
• Finn<strong>sheep</strong> Breeders Association, Inc<br />
• Icelandic Sheep Breeders <strong>of</strong> North America<br />
• Jacob Sheep Conservancy<br />
• North American Clun Forest Association<br />
• Texel Sheep Breeders Society<br />
Ovine Progressive Pneumonia Concerned Sheep Breeder’s Society (OPPCSBS)<br />
• Started in 1990 when a group <strong>of</strong> frustrated shepherds wanted more information and<br />
understanding <strong>of</strong> this disease <strong>the</strong>y were trying to eradicate from <strong>the</strong>ir flocks.<br />
• Over 100 members from 27 states, 3 provinces. Flocks range from 10 to >1000 <strong>sheep</strong>.<br />
• Newsletter and website (www.oppsociety.org) includes general information and<br />
guidelines for OPP testing, a membership directory and a Veterinary referral list.<br />
• Videos describing blood collection techniques and handling<br />
• Educational materials available for distribution at events<br />
29
• Good source for purchasing replacement <strong>sheep</strong> as many producer members are interested<br />
in overall health <strong>of</strong> <strong>the</strong>ir flocks.<br />
• Started a pilot program with <strong>the</strong> USDA in Minnesota in 2006 to evaluate an OPP<br />
eradication program for flocks also enrolled in <strong>the</strong> Voluntary Scrapie Control Program.<br />
Testimonials from Producers<br />
♦ 195 ewes (Ile de France, Hamp, Rambouillet cross) “We used testing and culling to rid<br />
<strong>the</strong> flock <strong>of</strong> OPP. The flock tested 100% neg in 12/02 and 4/03. Will continue to test<br />
every o<strong>the</strong>r year and all new <strong>sheep</strong> that enter. We are very glad that we are OPP negative.<br />
Lambing is now a total joy!”<br />
♦ 70 crossbred ewes – “life without OPP is good!”<br />
♦ 750 crossbred ewes – “used whole flock testing and culling to achieve 100% negative<br />
status. Have seen an all around improvement in flock health.”<br />
Caseous Lymphadenitis – CL – Abscesses - Boils<br />
CL is a very common, highly contagious disease seen in <strong>sheep</strong> and goats caused by <strong>the</strong><br />
bacteria Actinomyces (corynebacterium) pseudotuberculosis.<br />
Basic Understanding <strong>of</strong> <strong>the</strong> Disease<br />
• The animal’s body reacts to this bacteria by building thick walls around <strong>the</strong> infection –<br />
abscesses that are usually filled with very thick, white-greenish non-odorous pus.<br />
• Abscesses can be located anywhere in <strong>the</strong> body but most likely in internal or external<br />
lymph nodes around head and chest area.<br />
- parotid lymph nodes under ears<br />
- submandibular lymph nodes in throatlatch<br />
- mediastinal lymph nodes in chest between lungs<br />
- prescapular and prefemoral lymph nodes in front <strong>of</strong> front and rear legs<br />
• The ruptured abscess will shed millions <strong>of</strong> bacteria into <strong>the</strong> environment<br />
• The bacteria is quite stable and will live in organic material for weeks to months.<br />
• Very easy to culture.<br />
• Rare to find abscesses in animals under 6 months <strong>of</strong> age<br />
• This disease is brought on to a farm through purchased infected animals, shows, or<br />
shearing equipment<br />
• Goats and <strong>sheep</strong> most likely infected. Rare cases <strong>of</strong> human infection reported.<br />
Differential Diagnoses<br />
• O<strong>the</strong>r Actinomyces species – be sure to have abscesses cultured before you panic. Sheep<br />
and cows are good at making abscesses to wall <strong>of</strong>f foreign bodies and organisms.<br />
• OPP, Scrapie and Johne’s disease – internal CL abscesses can cause weight loss,<br />
coughing, and rarely CNS signs.<br />
30
• Neoplastic tumors<br />
Treatment<br />
• Cull, cull, cull or at least isolate before abscesses rupture<br />
• When isolated, have DVM lance abscesses (or teach you how to do it properly). Wear<br />
gloves and burn abscess pus and material. Flush with dilute iodine or chlorhexadine.<br />
Keep isolated until totally healed. Disinfect pen and equipment with bleach when done<br />
Sheep are still considered contagious as <strong>the</strong>y may have abscesses internally that are<br />
spread through coughing, etc.<br />
Diagnosis<br />
• Culture – take swab from outer edges <strong>of</strong> abscess. Quite easy to isolate in lab.<br />
• Necropsy – take advantage <strong>of</strong> <strong>the</strong> death <strong>of</strong> older ewes. Especially thin ones that die from<br />
unknown causes. For a reasonable fee, <strong>the</strong>y can be checked for mineral levels in liver and<br />
kidneys, chronic diseases and parasite loads.<br />
• Serology – can be used as a tool for eradication programs or pre-purchase screens. The<br />
serum is tested for <strong>the</strong> <strong>sheep</strong>’s response to toxins that are released by <strong>the</strong> bacteria. The<br />
results give a range <strong>of</strong> results depending on whe<strong>the</strong>r <strong>the</strong> <strong>sheep</strong> is actively abscessing, has<br />
been exposed but not abscessed, or has never been exposed. This test needs interpretation<br />
and knowledge <strong>of</strong> <strong>the</strong> flock history.<br />
Control and Eradication<br />
California <strong>Animal</strong> Health and Food Safety Lab<br />
West Health Sciences Drive<br />
University <strong>of</strong> CA Davis 95616 530-752-7577<br />
• Cull, Cull Cull!<br />
• Vaccinate<br />
- Colorado Serum’s Casebac and Caseous DT work well in eradication schemes.<br />
Vaccinate lambs at weaning (6-8 weeks) with a booster 2-4 weeks later. Repeat<br />
vaccination annually.<br />
• Do not use in pregnant ewes<br />
• Inject subcutaneously behind elbow - will leave permanent knots. Do not inject<br />
anywhere else - Leaves severe swellings.<br />
• Causes lethargy and lameness for 24-48 hours.<br />
• Suggest using at dry-<strong>of</strong>f in ewes – helps to dry-<strong>of</strong>f<br />
- Autogenous vaccines can be made using pure cultures <strong>of</strong> <strong>the</strong> abscess material from<br />
your own <strong>sheep</strong>. I have heard good reports from DVMs who have used Hygieia<br />
Biological Laboratories, California. 888-494-4342. Follow same schedule as<br />
Colorado Serum’s vaccines. Cost is about $1 per dose.<br />
31
Summary<br />
• Be diligent about observing and culling before <strong>the</strong> abscesses rupture and contaminate<br />
environment.<br />
• Remove wood objects that cause splinters, feed that has awns and stickers that can drag<br />
in bacteria.<br />
• Be very careful when purchasing animals and don’t use anyone else’s show equipment.<br />
• Provide your own shearing boards, insist that your shearer disinfects his equipment and<br />
stop to clean equipment if abscess is nicked or ruptured.<br />
References<br />
• Sheep and Goat Medicine, D.G. Pugh DVM, MS. W.B. Saunders Company.<br />
• “Caseous Lymphadenitis (CLA, Boils, Abscesses) in Goats – with supplemental<br />
comments about Sheep”, John Glenn, DVM, PhD, Extension Veterinarian – UC<br />
Davis. January 21, 2003.<br />
32
STRATEGIC CONTROL OF GASTRO-INTESTINAL PARASITES IN SHEEP<br />
Gastro-Intestinal Parasitism in Sheep<br />
D.H.Bliss, Ph.D.<br />
Veterinary Parasitologist<br />
MidAmerica Ag Research<br />
Verona, Wisconsin,USA<br />
Internal parasites <strong>of</strong>ten cause severe problems in <strong>sheep</strong>. If left untreated, <strong>sheep</strong> will suffer<br />
from levels <strong>of</strong> parasitism which not only interferes with efficient production but can also lead to<br />
death. Compared with cattle, clinical parasitic disease is a much <strong>great</strong>er problem with <strong>sheep</strong><br />
although production losses are equally high in both species. From a production stand point,<br />
internal parasites, even in low numbers, cause considerable economic loss from reduced milk<br />
production, reduced breeding efficiency, reduced weight gains, reduced feed efficiency, reduced<br />
carcass quality, reduced hair or wool quality, and reduced immune status <strong>of</strong> <strong>the</strong> infected animals<br />
to fight <strong>of</strong>f o<strong>the</strong>r disease conditions such as coccidiosis.<br />
Sheep develop high levels <strong>of</strong> parasitic worm burdens and suffer from heavy parasitism for a<br />
number <strong>of</strong> reasons:<br />
● First <strong>of</strong> all, <strong>sheep</strong> graze closer to <strong>the</strong> ground than cattle where parasitic larvae are <strong>of</strong>ten<br />
concentrated. Parasitic larvae hatch from eggs passed in <strong>the</strong> fecal material; <strong>the</strong>se larvae<br />
undergo several molts until <strong>the</strong>y reach an infective stage. This infective stage is mobile<br />
and moves with moisture trails onto nearby vegetation to be eaten by its intended host.<br />
Parasitic larvae can build up to very high numbers on summer pasture as <strong>the</strong> animals<br />
constantly re-infect <strong>the</strong>mselves.<br />
● Secondly, fecal material excreted by <strong>sheep</strong> is very concentrated and, <strong>the</strong>refore, worm egg<br />
counts in <strong>sheep</strong> are <strong>of</strong>ten very high. Fecal worm egg counts from <strong>sheep</strong> can be 5 to 10<br />
times <strong>great</strong>er than normal counts found in cattle. A small amount <strong>of</strong> <strong>sheep</strong> feces can<br />
produce a high level <strong>of</strong> parasite contamination. Preventing worm egg shedding during <strong>the</strong><br />
first part <strong>of</strong> <strong>the</strong> grazing season in <strong>sheep</strong> is critical to prevent environmental contamination<br />
later on.<br />
● Thirdly, parasite control programs for <strong>sheep</strong> over <strong>the</strong> years have been more <strong>the</strong>rapeutic,<br />
aimed at controlling high worm burdens after <strong>the</strong>y have occurred ra<strong>the</strong>r than trying to<br />
prevent parasite contamination <strong>of</strong> <strong>the</strong> animal’s environment. Treating <strong>sheep</strong> after heavy<br />
parasite loads are encountered has little impact on reducing future contamination.<br />
Fur<strong>the</strong>rmore, once high worm burdens are encountered, complete control is hard to<br />
achieve and, <strong>of</strong>ten, heavily infected <strong>sheep</strong> continue to shed worm eggs even after<br />
treatment. A commonly recommended practice over <strong>the</strong> years has been to deworm <strong>sheep</strong><br />
every eight weeks while on pasture. The time it takes for adult worms to develop after <strong>the</strong><br />
animals ingest infective larvae is approximately three weeks or less, depending upon <strong>the</strong><br />
particular species <strong>of</strong> parasite ingested. The recommended practice <strong>of</strong> treating every eight<br />
33
weeks has allowed <strong>sheep</strong> to be clean for three weeks, <strong>the</strong>n wormy for five weeks, clean<br />
for three weeks, etc. For an efficient parasite control strategy to work in <strong>sheep</strong>, parasite<br />
challenge needs to be significantly reduced early in <strong>the</strong> grazing season; o<strong>the</strong>rwise, high<br />
burdens will develop as <strong>the</strong> season progresses.<br />
● Fourthly, parasite resistance to dewormers has been reported for over thirty years in<br />
<strong>sheep</strong>. The biggest problem is that resistance causes ineffective treatment and continued<br />
contamination <strong>of</strong> <strong>the</strong> animal’s environment, <strong>of</strong>ten leading to severe parasite problems<br />
later in <strong>the</strong> year. Once parasite resistance occurs, multiple treatments are <strong>of</strong>ten needed<br />
just to keep <strong>the</strong> animals alive.<br />
The Most Common Parasites <strong>of</strong> Sheep<br />
A. Stomach worms<br />
Haemonchus (<strong>the</strong> barber pole worm) is a blood-sucking parasite. This parasite is a very<br />
economically damaging parasite in <strong>sheep</strong> and is becoming one <strong>of</strong> <strong>the</strong> most important causes <strong>of</strong><br />
death in <strong>the</strong>se animals. Larval stages are found in <strong>the</strong> abomasal tissues and are extremely hard to<br />
kill (see section on <strong>the</strong> inhibition <strong>of</strong> Haemonchus). Eggs are easily identified in a fecal exam.<br />
Ostertagia (brown stomach worm) and Trichostrongylus (bankrupt worm) can be important<br />
in <strong>sheep</strong> but mostly low infections are found with <strong>the</strong>se parasites.<br />
B. Intestinal nematode parasites<br />
Cooperia (coopers worm) disrupts digestive functions <strong>of</strong> <strong>the</strong> intestine. Not very prevalent in<br />
<strong>sheep</strong>.<br />
Nematodirus (threadneck worm) is a very important parasite <strong>of</strong> <strong>sheep</strong> and most commonly is<br />
found in young animals but can be found in older animals and adult ewes. Larvae survive well in<br />
cold wea<strong>the</strong>r and can live for two years on pasture or in <strong>the</strong> environment <strong>of</strong> <strong>the</strong> animals. This<br />
parasite survives well <strong>of</strong>f pasture and is considered an important “barnyard” infection. This<br />
parasite is a common cause <strong>of</strong> diarrhea and <strong>of</strong>ten times death in young animals. Because it is<br />
very pathogenic, older animals acquire a strong immunity against this parasite. The egg is very<br />
large and is easily identified in fecal exam.<br />
Trichuris (whipworm) is ano<strong>the</strong>r very important and damaging parasite in <strong>sheep</strong>, especially<br />
in young animals. This parasite is most commonly encountered under “barnyard” conditions in<br />
pens or on dirt lots. Often times symptoms are confused with coccidiosis because <strong>of</strong> <strong>the</strong> bloody<br />
diarrhea associated with this parasite. Several hundred worms can kill a young lamb. The egg is<br />
very characteristic and looks like a small football with polar caps on each end. The female worm<br />
is not prolific and eggs are <strong>of</strong>ten missed in <strong>the</strong> fecal exam unless carefully conducted.<br />
Bunostomum (hookworm) and Oesphagostomum (nodular worm) is becoming more<br />
important in recent years because intestines are <strong>of</strong>ten condemned at slaughter if nodules caused<br />
by <strong>the</strong> nodular worms are found in large numbers. Parasites are most commonly found in ewes<br />
and older yearling animals.<br />
34
C. Intestinal cestode parasites (tapeworms)<br />
The tapeworm (Moniezia) is very common in <strong>sheep</strong>. This parasite undergoes an<br />
intermediate stage when it develops in <strong>the</strong> soil or grain mite, which is <strong>the</strong>n ingested by <strong>sheep</strong> to<br />
keep <strong>the</strong> infection going. The develop time to reach an adult after ingestion is reported to be from<br />
six to eight weeks. The adult tapeworm lives in <strong>the</strong> small intestine and can grow to be 1 inch<br />
wide and six feet long. They absorb nutrition through <strong>the</strong>ir cuticle. In high numbers tapeworms<br />
can block <strong>the</strong> intestine. Tapeworm eggs are distinct and easily picked up on a fecal exam.<br />
D. Lungworms (Dictyocaulus viviparous)<br />
Lungworms are acquired almost exclusively through grazing. Lungworm larvae are not<br />
very mobile and, <strong>the</strong>refore, <strong>of</strong>ten require a heavy rain to move out away from <strong>the</strong> manure<br />
pat. Sheep on rotational and intensive grazing systems are <strong>of</strong>ten exposed to lungworms. Deer<br />
are thought to contribute to lungworm infections in <strong>sheep</strong>. The eggs are coughed up and<br />
hatches as it moves down <strong>the</strong> intestinal tract so lungworm is hard to diagnose through a<br />
general fecal exam but ra<strong>the</strong>r <strong>the</strong> fecal must be subjective to a separate test called a<br />
“baermann test” to find lungworm larvae. Post-mortem check for lungworms entails<br />
removing <strong>the</strong> lungs and trachea intact, filling with warm water with a garden hose and <strong>the</strong>n<br />
pouring <strong>the</strong> contents on a flat surface to look for lungworms which are easily visible with <strong>the</strong><br />
naked eye.<br />
E. Trematodes parasites (liver flukes)<br />
Fascioloides magna (deer fluke) found in <strong>the</strong> Great Lakes region is relatively untreatable in<br />
<strong>sheep</strong>. Diagnosis can be done accurately only upon necropsy. Infections can be spread with deer<br />
with an intermediate snail host. Keeping animals away from wet areas and streams where deer<br />
congregate is currently <strong>the</strong> only method <strong>of</strong> control.<br />
F. Protozoan parasites <strong>of</strong> <strong>sheep</strong><br />
Coccidia are single celled protozoan parasites that all <strong>sheep</strong> are believed to be exposed to<br />
sometime in <strong>the</strong>ir life. Coccidia are very host specific such that coccidia <strong>of</strong> cattle, swine,<br />
dogs, and chickens won’t infect <strong>sheep</strong>. The reverse is also true. Coccidia are ingested<br />
through fecal contaminated feedstuff. Wet muddy conditions usually increase infection<br />
levels. Sheep housed in dirt lots <strong>of</strong>ten become heavily infected with coccidia.<br />
Sheep become infected when <strong>the</strong>y ingest oocysts (egg like structure) containing sporozoites,<br />
which escape <strong>the</strong> oocysts and penetrate <strong>the</strong> intestinal wall. A disease condition called coccidiosis<br />
occurs when coccidia numbers become high and <strong>the</strong> immune system <strong>of</strong> <strong>the</strong> animals becomes<br />
low. Coccidiosis <strong>of</strong>ten occurs when an animal becomes stressed. Sheep shedding high number <strong>of</strong><br />
oocysts indicate cell damage is ongoing. Coccidia oocysts can easily be found in a fecal exam.<br />
35
The Inhibition <strong>of</strong> Haemonchus (Barber Pole Worm)<br />
Once high worm burdens occur in grazing <strong>sheep</strong>, (which usually occurs in mid-spring to latespring<br />
under sou<strong>the</strong>rn climatic conditions and in mid-summer to late-summer under nor<strong>the</strong>rn<br />
climatic conditions), <strong>the</strong> physiology <strong>of</strong> <strong>the</strong> gastrointestinal tract changes. This change, especially<br />
<strong>the</strong> decreased in acid content <strong>of</strong> <strong>the</strong> abomasum (4 th stomach) and an increase in <strong>the</strong> pH levels <strong>of</strong><br />
<strong>the</strong> stomach, causes parasite development to slow down and larvae present in <strong>the</strong> gastrointestinal<br />
wall and gastric glands begin to inhibit or become arrested. These arrested larvae may stay in this<br />
state for six months or longer.<br />
Once larvae become inhibited, <strong>the</strong>y are very difficult to eliminate or remove by conventional<br />
deworming. Thousands <strong>of</strong> <strong>the</strong>se larvae can become inhibited and require repeated dewormings<br />
just to keep <strong>the</strong> animals alive. It is <strong>of</strong>ten thought that some <strong>of</strong> <strong>the</strong> “parasite resistance” to drug<br />
treatment is noted incorrectly because many <strong>of</strong> <strong>the</strong> dewormers used for <strong>sheep</strong> have reduced<br />
efficacy against inhibited parasites but once <strong>the</strong> parasite matures, <strong>the</strong> parasite is easily removed<br />
by <strong>the</strong> dewormer. The best method <strong>of</strong> controlling <strong>the</strong>se parasites is to prevent high levels <strong>of</strong><br />
parasitism from building up on <strong>the</strong> pastures and in <strong>the</strong> animals <strong>the</strong>mselves. Strategic deworming<br />
is designed to prevent parasite build-up on <strong>the</strong> pastures creating “parasite-safe grazing.”<br />
Parasite Diagnosis<br />
Parasite diagnosis is best conducted using a fecal exam. Fecal exams simply float eggs out <strong>of</strong><br />
<strong>the</strong> feces and can provide accurate information regarding <strong>the</strong> types <strong>of</strong> parasites present and <strong>the</strong><br />
level <strong>of</strong> worm-egg shedding by a particular animal or, in <strong>the</strong> case <strong>of</strong> random sampling, by a<br />
particular group <strong>of</strong> animals. The fecal exam used needs to be sufficiently sensitive to detect low<br />
levels <strong>of</strong> egg shedding by Nematodirus or Trichuris (Whipworms) to be effective. High levels <strong>of</strong><br />
Haemonchus eggs (> 300 eggs/sample) in a fecal exam indicated inhibited larvae may be a<br />
problem.<br />
A second method for classifying animals for levels <strong>of</strong> Haemonchus is to test for anemia (a<br />
primary pathologic effect <strong>of</strong> Haemonchus) by observing <strong>the</strong> color <strong>of</strong> ocular mucus membranes<br />
and compare to a laminated card with illustrations <strong>of</strong> eyes from <strong>sheep</strong> with varying levels <strong>of</strong><br />
anemia. This system is called <strong>the</strong> FAMACHA test but is only valuable once animals have<br />
become heavily infected and clinical levels <strong>of</strong> Haemonchus have occurred. Immediate treatment<br />
is usually required once mucus membranes become white (severe anemia is present).<br />
Strategic Parasite Control Strategy<br />
Successful parasite control should include several key goals:<br />
1). Ewes should be free <strong>of</strong> parasites at lambing time.<br />
2). Sheep should be free <strong>of</strong> parasites during periods <strong>of</strong> low or reduced nutrition such as<br />
during <strong>the</strong> wintertime when infectivity is usually low or non-existent.<br />
3). Prevent worm egg shedding on <strong>the</strong> pasture for <strong>the</strong> first three months <strong>of</strong> grazing. All<br />
animals should be parasite free at <strong>the</strong> time <strong>of</strong> turn-out.<br />
4). All purchased animals or animals arriving from ano<strong>the</strong>r operation should be thoroughly<br />
dewormed to insure parasite-free status.<br />
36
Strategic Timing <strong>of</strong> Treatment<br />
Phase I: A late fall deworming (given after <strong>the</strong> first <strong>of</strong> November or after <strong>the</strong> first heavy<br />
frost) will reduce <strong>the</strong> chance <strong>of</strong> winter parasitism. Depending on location in <strong>the</strong> country, this<br />
treatment should also help ensure that <strong>the</strong> ewes are clean at <strong>the</strong> time <strong>of</strong> lambing. If it is<br />
determined that <strong>the</strong> ewe is not clean at lambing time, <strong>the</strong> ewe should be retreated just prior to<br />
lambing.<br />
Phase II: The next phase <strong>of</strong> strategic deworming is to instigate a spring deworming schedule<br />
to eliminated worm egg shedding during <strong>the</strong> first three months <strong>of</strong> grazing. Since <strong>the</strong> life cycle <strong>of</strong><br />
gastrointestinal parasites is 18-21 days from <strong>the</strong> time <strong>the</strong> animal ingests <strong>the</strong> infective larvae until<br />
an egg laying adult parasite is present in <strong>the</strong> animal, <strong>the</strong> treatment interval should be no more<br />
than 21-days. The treatment clock starts ticking as soon as grass growth begins in <strong>the</strong> spring. To<br />
make <strong>the</strong> program work, all animals need to be free <strong>of</strong> parasites at <strong>the</strong> beginning <strong>of</strong> <strong>the</strong> season.<br />
Depending upon location in <strong>the</strong> country, <strong>the</strong> animals treated in <strong>the</strong> fall or at lambing should still<br />
be parasite-free. If winter grazing takes place, <strong>the</strong> animals should be checked in <strong>the</strong> spring, if<br />
positive, all animals should be treated prior to <strong>the</strong> beginning <strong>of</strong> spring grazing.<br />
0-3-6-9 Spring Treatment Schedule: Once grazing starts, all <strong>sheep</strong> grazing <strong>the</strong> same pasture<br />
should be dewormed every three weeks for a minimum <strong>of</strong> three times beginning three weeks<br />
after <strong>the</strong> start <strong>of</strong> spring grazing. If, for example, <strong>the</strong> animals are parasite-free when grazing starts<br />
around <strong>the</strong> middle <strong>of</strong> April, <strong>the</strong> first spring treatment would be given <strong>the</strong> first week <strong>of</strong> May,<br />
followed by a second deworming given <strong>the</strong> last week <strong>of</strong> May followed by a third treatment given<br />
<strong>the</strong> middle <strong>of</strong> June, leaving <strong>the</strong> animals free from shedding parasitic worm eggs until at least to<br />
<strong>the</strong> first <strong>of</strong> July.<br />
Strategic deworming works because <strong>the</strong> parasitic larvae that survived <strong>the</strong> winter and are<br />
present on <strong>the</strong> pasture in early spring naturally die <strong>of</strong>f if <strong>the</strong>y're not eaten by <strong>the</strong> animals grazing<br />
<strong>the</strong> pasture during <strong>the</strong> first 90-days <strong>of</strong> grazing. If <strong>the</strong> animals grazing spring pastures can be<br />
prevented from shedding additional worm eggs and re-contaminating <strong>the</strong> pastures during this<br />
time (approximate three month period), parasite safe grazing can be maintained and parasite<br />
burden developing in <strong>the</strong> animals over <strong>the</strong> summer grazing season can be <strong>great</strong>ly reduced.<br />
Strategic deworming is designed simply to time <strong>the</strong> treatments to kill <strong>the</strong> parasites after<br />
development in <strong>the</strong> animal has occurred but before <strong>the</strong> parasites have developed sufficiently to<br />
an adult stage and before <strong>the</strong>y begin laying eggs, which would pass back on <strong>the</strong> pasture. The<br />
animals work like vacuum cleaners eating <strong>the</strong> parasitic larvae present on <strong>the</strong> herbage. The<br />
animals pick up larvae; <strong>the</strong> treatment kills <strong>the</strong>se larvae before <strong>the</strong>y develop into adults. This<br />
process is repeated three times thus allowing <strong>the</strong> pastures to naturally become “parasite-safe<br />
pastures. Over time with strategic deworming, pasture contamination can be significantly<br />
reduced.<br />
37
SOMATIC CELL COUNTS IN DAIRY SHEEP MILK<br />
G. Lagriffoul 1 , F. Barillet 2 , R. Rupp 2 , X. Ber<strong>the</strong>lot 3 , D. Bergonier 3<br />
1 Institut de l’Elevage - Comité National Brebis Laitières<br />
Campus INRA de Toulouse, France<br />
2 INRA-SAGA, Toulouse, France<br />
3 ENVT, Toulouse, France<br />
Special attention is given to intramammary infections (IMI) <strong>of</strong> <strong>dairy</strong> <strong>sheep</strong> due to economic<br />
consequences (loss <strong>of</strong> milk production, price penalties for milk, costs <strong>of</strong> involuntary culling…),<br />
decreases <strong>of</strong> hygienic quality <strong>of</strong> milk (contaminants in milk as S. aureus, salmonella…) and legal<br />
control (as established for instance in Europe by EU directives defining <strong>the</strong> bacteriological<br />
quality <strong>of</strong> milk). In <strong>dairy</strong> <strong>sheep</strong>, IMI are characterised by a low percentage <strong>of</strong> clinical IMI,<br />
generally lower than 5 %, and a <strong>great</strong>er percentage <strong>of</strong> subclinical IMI in <strong>the</strong> range <strong>of</strong> 10 to 50 %<br />
or more. 80 % <strong>of</strong> <strong>the</strong> subclinical IMI are due to Coagulase Negative Staphylococci (CNS) which<br />
cannot be considered as minor pathogens in <strong>dairy</strong> <strong>sheep</strong> as it is <strong>the</strong> case in <strong>dairy</strong> cattle. Some <strong>of</strong><br />
<strong>the</strong>m cause a high increase <strong>of</strong> somatic cell counts (SCC) and <strong>the</strong>re is accumulative evidence<br />
showing that IMI constitute <strong>the</strong> major cause <strong>of</strong> SCC. It is well established that SCC are <strong>the</strong> best<br />
indirect test <strong>of</strong> bacterial status <strong>of</strong> a gland. As a consequence, <strong>the</strong> control <strong>of</strong> udder health (in<br />
particular subclinical IMI) may focus on <strong>the</strong> control <strong>of</strong> SCC. But such plans <strong>of</strong> SCC control have<br />
to take into account specificities <strong>of</strong> <strong>dairy</strong> <strong>sheep</strong> production, as <strong>the</strong> size <strong>of</strong> <strong>the</strong> flocks, <strong>the</strong> milking<br />
routine and throughput, <strong>the</strong> costs <strong>of</strong> <strong>the</strong> analysis and <strong>the</strong> control measures… Recent advances<br />
make it possible to control <strong>the</strong> somatic cells <strong>of</strong> <strong>dairy</strong> <strong>sheep</strong> milk. However, knowledge for some<br />
critical points needs to be improved in order to make <strong>the</strong> plans more efficient and less expensive.<br />
The aim <strong>of</strong> this article is to make a rapid review <strong>of</strong> <strong>the</strong> knowledge <strong>of</strong> somatic cells in <strong>dairy</strong><br />
<strong>sheep</strong> milk. After some general background regarding <strong>the</strong> origin and <strong>the</strong> counting methods <strong>of</strong><br />
somatic cells in <strong>sheep</strong> milk, we will focus on <strong>the</strong> consequences <strong>of</strong> high somatic cell counts on <strong>the</strong><br />
cheese making properties and finally conclude with mammary gland disease control.<br />
1 – Origin <strong>of</strong> Somatic Cells in <strong>the</strong> Milk<br />
1.1. Somatic cells composition for normal milk<br />
For <strong>sheep</strong> as for <strong>the</strong> o<strong>the</strong>r <strong>dairy</strong> species, somatic cells are a natural component <strong>of</strong> <strong>the</strong> milk.<br />
Ewe’s milk contains <strong>the</strong> same types <strong>of</strong> cells as cow’s milk. For normal milk (from an udder<br />
without any intra mammary infection), <strong>the</strong> range <strong>of</strong> <strong>the</strong> percentage <strong>of</strong> <strong>the</strong> different types <strong>of</strong><br />
somatic cells are <strong>the</strong> following (Bergonier et al, 2003) :<br />
- epi<strong>the</strong>lial cells, less than 5%,<br />
- polymorphonuclear neutrophil leukocytes (PMNL), 10-35 %,<br />
- macrophages, 45-85 %,<br />
- lympocytes, 10-17 %.<br />
38
1.2. IMI is <strong>the</strong> main factor influencing SCC<br />
The inflammation caused by an infection is responsible for <strong>the</strong> increase <strong>of</strong> SCC, particularly<br />
<strong>the</strong> PMNL cells. The increase <strong>of</strong> <strong>the</strong> SCC depends on several factors like <strong>the</strong> virulence <strong>of</strong> <strong>the</strong><br />
pathogen, <strong>the</strong> host, i.e. <strong>the</strong> <strong>sheep</strong>…<br />
1.2.1. Clinical IMI<br />
In case <strong>of</strong> clinical IMI, SCC are in general very high, usually over several million cells/ml.<br />
But in this situation, SCC have no practical interest for <strong>the</strong> diagnosis since it can be based on a<br />
clinical examination <strong>of</strong> <strong>the</strong> gland or <strong>the</strong> milk. Due to <strong>the</strong> gravity <strong>of</strong> <strong>the</strong> IMI, <strong>the</strong> first objective<br />
would be <strong>the</strong> survival <strong>of</strong> <strong>the</strong> ewe. The prevalence <strong>of</strong> such clinical IMI is about 5%.<br />
Staphylococus aureus is <strong>the</strong> major etiologic agent in more than 50 % <strong>of</strong> <strong>the</strong> samples in case <strong>of</strong><br />
clinical IMI. In an epiomiological survey carried out in France on 302 clinical mastitis cases in<br />
72 flocks, <strong>the</strong> prevalence <strong>of</strong> Staphylococus aureus was 62 % (Fig. 1). On <strong>the</strong> o<strong>the</strong>r hand, with a<br />
prevalence in <strong>the</strong> range <strong>of</strong> 14 % in <strong>dairy</strong> <strong>sheep</strong>, Coagulase-negative staphylococcus species<br />
(CNS) cannot be considered as minor pathogens.<br />
Figure 1. Aetiology <strong>of</strong> <strong>dairy</strong> <strong>sheep</strong> clincal IMI (Bergonier et al. 2006)<br />
8<br />
14<br />
7<br />
4<br />
4 2<br />
Taking into account <strong>the</strong>se results (low % <strong>of</strong> clinical IMI + high prevalence <strong>of</strong> S. aureus +<br />
gravity <strong>of</strong> <strong>the</strong> infection + antibiotic treatment), <strong>the</strong> hygienic guidelines (in France) recommend<br />
isolation <strong>of</strong> <strong>the</strong> ewe, stop milking this ewe with <strong>the</strong> rest <strong>of</strong> <strong>the</strong> flock, and if possible, cull <strong>the</strong><br />
animal.<br />
In some rare cases, clinical IMI outbreaks are reported, and <strong>the</strong> prevalence may reach 50 %<br />
<strong>of</strong> <strong>the</strong> flock. These outbreaks are due to S. aureus (or o<strong>the</strong>r S. uberis, agalactiae, suis…) or to<br />
opportunistic pathogens such as Aspergillus fumigatus and Pseudomonas aerigunisa.<br />
39<br />
62<br />
S. aureus<br />
CNS<br />
Mannheimia spp.<br />
Streptococcaceae<br />
Enterobacteria<br />
O<strong>the</strong>r<br />
Contaminated
1.2.2. Subclinical IMI<br />
It is now well documented that CNS are <strong>the</strong> most prevalent agents responsible for subclinical<br />
IMI: 80 % <strong>of</strong> subclinical IMI in <strong>dairy</strong> <strong>sheep</strong> are due to CNS (Fig. 2).<br />
Figure 2. Aetiology <strong>of</strong> <strong>dairy</strong> <strong>sheep</strong> subclinical IMI (Bergonier et al. 2003 and 2006)<br />
The increase <strong>of</strong> SCC depends basically on <strong>the</strong> gravity <strong>of</strong> <strong>the</strong> inflammation / infection and its<br />
persistence. An illustration is shown on <strong>the</strong> Figure 3: for healthy ewes, <strong>the</strong> geometric mean <strong>of</strong><br />
SCC during all <strong>the</strong> lactation is about 250,000 cells/ml, while it reaches 800,000 cells/ml for longterm<br />
infected <strong>sheep</strong> and is 1,400,000 cells/ml for both glands long-term infected <strong>sheep</strong>.<br />
Figure 3. Annual geometric mean <strong>of</strong> SCC from 346 ewes according to <strong>the</strong> level <strong>of</strong> infection <strong>of</strong><br />
<strong>the</strong> 2 glands: both glands healthy or briefly infected (1+1, 1+2, 2+2), one gland long-term<br />
infected (1+3, 2+3), long-term infected for both glands (3+3)<br />
1600<br />
1400<br />
1200<br />
1000<br />
800<br />
600<br />
400<br />
200<br />
0<br />
6<br />
7<br />
3 3<br />
6<br />
5<br />
79<br />
40<br />
S. aureus<br />
CNS<br />
Streptococci<br />
Streptococcaceae<br />
Corynebacteria<br />
Gram negative<br />
O<strong>the</strong>r<br />
1+1 1+2 1+3 2+2 2+3 3+3
1.3. Use <strong>of</strong> SCC in order to detect subclinical IMI in <strong>sheep</strong><br />
Various thresholds <strong>of</strong> individual SCC have been proposed to determine <strong>the</strong> healthy or<br />
infected status <strong>of</strong> <strong>the</strong> udder, depending on <strong>the</strong> approach carried out.<br />
1.3.1. Punctual approach and single threshold<br />
Some authors have proposed a punctual approach, thus a single threshold. The cut-<strong>of</strong>f point<br />
is based on <strong>the</strong> punctual comparison <strong>of</strong> SCC <strong>of</strong> infected and uninfected udder halves. The choice<br />
may take into account <strong>the</strong> best compromise between sensitivity and specificity. As shown in<br />
Figure 4, <strong>the</strong> level <strong>of</strong> somatic cell score (SCS) <strong>of</strong> <strong>the</strong> three IMI statuses are partly overlapping. In<br />
<strong>the</strong> ewe, <strong>the</strong> most common level proposed is below or over 500,000 cells/ml (SCS =2.7 on <strong>the</strong><br />
Figure 4) to distinguish between healthy and infected udders (Bergonier et al. 2003, Ber<strong>the</strong>lot et<br />
al. 2006).<br />
Figure 4. Distribution <strong>of</strong> <strong>the</strong> punctual SCS from 346 ewes according to <strong>the</strong> IMI status : 1 -<br />
healthy, 2 - briefly infected, 3 – long-term infected<br />
%<br />
25<br />
20<br />
15<br />
10<br />
5<br />
0<br />
1,5<br />
1 2 3<br />
1,7<br />
1,9<br />
2,1<br />
2,3<br />
2,5<br />
2,7<br />
2,9<br />
This approach has <strong>the</strong> advantage to be simple. But it is necessary to modulate its use<br />
depending on <strong>the</strong> objective: detection <strong>of</strong> infected <strong>sheep</strong> to be confirmed by a second analysis,<br />
detection <strong>of</strong> infected <strong>sheep</strong> to be treated at drying-<strong>of</strong>f, or to be culled. Moreover, according to <strong>the</strong><br />
chosen cut-<strong>of</strong>f point, <strong>the</strong> power <strong>of</strong> detection <strong>of</strong> <strong>the</strong> truly infected (or uninfected) <strong>sheep</strong> could<br />
change, which is a drawback <strong>of</strong> this punctual approach.<br />
1.3.2. Dynamical approach and multiple thresholds<br />
An important reason for <strong>the</strong> utilisation <strong>of</strong> such dynamic approaches is that staphylococcal<br />
IMI are characterised by dynamic fluctuations and consequently SCC cyclic variations (Fig. 5.).<br />
41<br />
3,1<br />
3,3<br />
3,5<br />
3,7<br />
4<br />
SCS
Figure 5. Example <strong>of</strong> daily fluctuations <strong>of</strong> SCC (——) and bacterial count (----) for an infected<br />
udder-half (Bergonier et al. 2006).<br />
Number <strong>of</strong> UFC<br />
or SCC *1 000 cells/ml<br />
35000<br />
30000<br />
25000<br />
20000<br />
15000<br />
10000<br />
5000<br />
0<br />
0 5 10 15 20 25 30 35 40 45 50<br />
The use <strong>of</strong> a combination <strong>of</strong> several successive individual SCC (iSCC) or a lactation<br />
geometric mean <strong>of</strong> all <strong>the</strong> iSCC may give better results than a punctual approach leading to about<br />
75/80 % <strong>of</strong> sensitivity and specificity. Such an approach results in <strong>the</strong> definition <strong>of</strong> a third class<br />
<strong>of</strong> udders: doubtful udders which are note truly infected or truly healthy.<br />
At <strong>the</strong> lactation level, <strong>the</strong> thresholds <strong>of</strong> 250,000 cells/ml and 500,000 cells/ml geometric<br />
means could allow to distinguish healthy and infected ewes.<br />
Using such a dynamic approach, results in <strong>the</strong> following rules: an udder will be considered as<br />
healthy if every iSCC is below 500,000 cells/ml (possibly allow two iSCC <strong>great</strong>er than 500,000<br />
cells/ml), or infected when at least two iSCC are over 1,000,000 cells/ml, and doubtful in o<strong>the</strong>r<br />
cases (Ber<strong>the</strong>lot et al. 2006).<br />
This approach has <strong>the</strong> advantage to take into account <strong>the</strong> dynamics <strong>of</strong> <strong>the</strong> inflammation due<br />
to straphylococcal IMI. But it is necessary to have several iSCC per lactation to define <strong>the</strong> status<br />
<strong>of</strong> <strong>the</strong> ewe. These rules were developed from an experimental milk recording flock where <strong>the</strong><br />
ewes were monthly sampled throughout lactation. In practice, <strong>the</strong> rules must be adapted to <strong>the</strong><br />
information available (i.e. iSCC or California Mastitis Test).<br />
1.4. Non-pathological variation factors for SCC<br />
Days<br />
Bacterial IMI is <strong>the</strong> main factor influencing SCC, but many non-pathological factors also will<br />
elevate SCC <strong>of</strong> a healthy udder. In order <strong>of</strong> decreasing importance, <strong>the</strong> main known factors are<br />
<strong>the</strong> following: day in milk (increase at <strong>the</strong> end <strong>of</strong> lactation), parity (increase with <strong>the</strong> parity),<br />
42
within-day fluctuation (SCC level at <strong>the</strong> evening milking is higher than <strong>the</strong> morning one), milk<br />
fractions (increase with <strong>the</strong> milk fractions), flock, year…<br />
The range <strong>of</strong> variation <strong>of</strong> <strong>the</strong> non pathological factors are:<br />
Flock * year effect: 130,000 cells/ml<br />
Day in milk effect: 60,000 to 100,000 cells/ml<br />
Age, lactation number effect: 40,000 cells/ml (from parity 1 to parity 5 or more)<br />
Evening/morning milking effect: 60,000 to 90,000 cells/ml (depending on <strong>the</strong> interval<br />
between <strong>the</strong> two milkings)<br />
Some o<strong>the</strong>r minor or punctual SCC factors <strong>of</strong> variation may exist depending on <strong>the</strong><br />
management <strong>of</strong> <strong>the</strong> flock: suckling/milking period, number <strong>of</strong> suckled lambs, <strong>the</strong> milking<br />
routine, <strong>the</strong> type <strong>of</strong> milking (by machine or by hand ), sudden dietary transitions cause punctual<br />
fluctuation <strong>of</strong> SCC…<br />
1.5. Conclusion<br />
Dairy <strong>sheep</strong> IMI are mainly due to staphylococci. This fact has 2 main consequences:<br />
1) The primary sources <strong>of</strong> IMI are carried by <strong>the</strong> animal (teat cutaneous infection, skin…)<br />
and subclinical IMI. Thus, milking is <strong>the</strong> principal vector for <strong>the</strong> spread <strong>of</strong> IMI in <strong>dairy</strong> <strong>sheep</strong>.<br />
Despite this key role, additional work is needed to clearly identify <strong>the</strong> effect <strong>of</strong> milking<br />
equipment, routine, management… In France, in a survey carried out in 2003, it was pointed out<br />
that bulk SCC <strong>of</strong> flocks milked by machine with major defaults was higher (+100,000 cells/ml)<br />
throughout <strong>the</strong> year (Fig. 6). In Spain, C. Gonzalo in 2005 and 2006, established that machine<br />
milking in a parlour was associated with better udder health than using a bucket-milking machine<br />
or milking by hand.<br />
Figure 6. Monthly evolution <strong>of</strong> <strong>the</strong> geometric mean <strong>of</strong> bulk tank SCC <strong>of</strong> flocks milked by<br />
machine with 2 majors defaults (——) or no default (----) (Bergonier et al. 2005, Billon et al.<br />
2003).<br />
SCC (*1 000 cells/ml)<br />
800<br />
750<br />
700<br />
650<br />
600<br />
550<br />
500<br />
450<br />
400<br />
Month<br />
43
2) The persistence <strong>of</strong> subclinical IMI during lactation may be high. In a survey carried out in<br />
France in 6 flocks (768 udder-halves), <strong>the</strong> average duration <strong>of</strong> a pathogen was 3 to 4 months<br />
(Bergonier et al. 2003).<br />
It is clearly established that IMI is <strong>the</strong> major cause <strong>of</strong> variation for SCC in <strong>dairy</strong> <strong>sheep</strong>:<br />
- with all SCC (or geometric mean) below 250,000 or 500,000 cells/ml an udder may be<br />
considered as healthy,<br />
- with two SCC over 1,000,000 cells/ml, an udder may be considered as infected,<br />
- in <strong>the</strong> o<strong>the</strong>r cases, an udder may be classified as doubtful<br />
Sometime, it would be interesting to take into account <strong>the</strong> non-pathological variation factors<br />
for <strong>the</strong> interpretation or <strong>the</strong> comparison <strong>of</strong> <strong>the</strong> SCC. For example, we can observe large<br />
fluctuations <strong>of</strong> SCC (at <strong>the</strong> individual level but also at <strong>the</strong> bulk milk level) during <strong>the</strong> suckling x<br />
milking period, or some days just after <strong>the</strong> weaning <strong>of</strong> <strong>the</strong> lambs, or at <strong>the</strong> beginning <strong>of</strong> a grazing<br />
period after a barn period…<br />
2 – Somatic Cell Counting<br />
2.1. Direct method<br />
The principal methods for somatic cell counting are:<br />
- counter coulter method: <strong>the</strong> principle is based on <strong>the</strong> count <strong>of</strong> <strong>the</strong> particles in <strong>the</strong> milk.<br />
The count may be influenced by <strong>the</strong> size <strong>of</strong> <strong>the</strong> particles, <strong>the</strong> presence <strong>of</strong> grass<br />
globules…<br />
- fluoro-opto-elecronic method: <strong>the</strong> principle is based on <strong>the</strong> count <strong>of</strong> <strong>the</strong> DNA nucleus in<br />
<strong>the</strong> milk after coloration. It is <strong>the</strong> method currently used now. Due to <strong>the</strong> high level <strong>of</strong><br />
SCC found in <strong>dairy</strong> <strong>sheep</strong>, <strong>the</strong> counter should be calibrated using samples from 0 to<br />
2,000,000 cells/ml.<br />
- <strong>the</strong> reference method (International IDF standard 148A/1995) is based on a DNA<br />
coloration and microscopic counting.<br />
The influence <strong>of</strong> sample conservation on <strong>the</strong> counting results has been well established by<br />
Gonzalo and Martinez (Gonzalo et al. 2003, Martinez et al. 2003):<br />
- for unpreserved milk (temperature <strong>of</strong> conservation 4°C): <strong>the</strong> first 2 days <strong>of</strong> conservation<br />
have little quantitative influence on SCC.<br />
- for preserved milk (temperature <strong>of</strong> conservation 4°C): <strong>the</strong> age <strong>of</strong> <strong>the</strong> milk has little<br />
quantitative influence on SCC within <strong>the</strong> first week <strong>of</strong> conservation.<br />
- frozen milk: on average SCC is lower after freezing compared to refrigeration. But<br />
using a good analytical temperature (40°C), <strong>the</strong> Fossomatic device can be used for<br />
frozen samples over 60 days <strong>of</strong> conservation.<br />
2.2. Indirect method<br />
The California Mastitis Test (CMT) is based on <strong>the</strong> following principle: a reagent destroys<br />
<strong>the</strong> milk cells and reacts with DNA. The gelling <strong>of</strong> <strong>the</strong> milk is correlated with <strong>the</strong> quantity <strong>of</strong><br />
DNA. CMT is an on-farm method, easy to be performed for trained people and not very<br />
44
expensive. But it is necessary to be well organized to carry out regular CMT in suitable<br />
conditions for large flocks <strong>of</strong> <strong>sheep</strong>.<br />
In France, we proposed <strong>the</strong> following interpretation for <strong>the</strong> results:<br />
CMT reaction (CMT score) Interpretation SCC equivalence<br />
No reaction (0) Healthy or briefly infected Below 500,000 cells/ml<br />
Small amounts <strong>of</strong> gel Small inflammation, briefly Below 800,000 cells/ml<br />
disappearing after 10 seconds<br />
(1)<br />
infected<br />
Small persistent amounts <strong>of</strong> Subclinical mastitis; long 500,000 to 1,000,000 cells/ml<br />
gel (2)<br />
term infection<br />
Significant gel, deep, sticking Idem 1,000,000 to 5,000,000<br />
to paddle (3)<br />
cells/ml<br />
Very deep gel, looking like Idem<br />
Over 5,000,000 cells/ml<br />
egg white (4)<br />
Acute subclinical mastitis<br />
If we take into account that CMT is a subjective test, <strong>the</strong>re is a good correlation between<br />
CMT and SCC as shown on figure 7. The distribution <strong>of</strong> CMT and SCC are in agreement.<br />
Figure 7. Relationship between CMT and SCC for 320 udder-halves in 4 flocks (Lagriffoul 2001,<br />
unpublished result)<br />
SCC (* 1 000 cells/ml) cells/ml) cells/ml) cells/ml) cells/ml)<br />
100000<br />
10000<br />
1000<br />
100<br />
10<br />
1<br />
0 1 2 3 4 5<br />
CMT score<br />
O<strong>the</strong>r indirect methods like conductivity <strong>of</strong> <strong>the</strong> milk have been proposed. In general, <strong>the</strong>re<br />
are few available results in <strong>dairy</strong> <strong>sheep</strong> regarding <strong>the</strong>se o<strong>the</strong>r indirect methods, and <strong>the</strong>ir<br />
relationships with SCC are not yet as well validated as <strong>the</strong> CMT.<br />
45
2.3. Conclusion<br />
The SC methods <strong>of</strong> counting are validated in <strong>dairy</strong> <strong>sheep</strong>. With <strong>the</strong> Fossomatic method and<br />
good conditions <strong>of</strong> conservation, it appears possible to perform analysis several days after <strong>the</strong><br />
sampling date. For frozen milk, <strong>the</strong> analysis may be done over 60 days after <strong>the</strong> sampling date<br />
provided that a suitable analysis temperature is respected.<br />
For <strong>the</strong>se direct methods, representative samples <strong>of</strong> milk are required. Depending on <strong>the</strong><br />
milking routine, <strong>the</strong> milking throughput, <strong>the</strong> size <strong>of</strong> <strong>the</strong> flock, and <strong>the</strong> milk recording device, <strong>the</strong><br />
collection <strong>of</strong> milk samples for analysis may be difficult or easy to perform and may require an<br />
increase in <strong>the</strong> number <strong>of</strong> technicians in <strong>the</strong> milking parlour.<br />
With an appropriate subjective interpretation, CMT is well correlated with SCC in <strong>dairy</strong><br />
<strong>sheep</strong>. CMT is less expensive than SCC (no analytical cost) to be performed, but its practical<br />
realisation may be very time consuming in large <strong>dairy</strong> <strong>sheep</strong> flocks. Taking into account <strong>the</strong><br />
persistence <strong>of</strong> <strong>the</strong> subclinical IMI in <strong>dairy</strong> <strong>sheep</strong>, it is <strong>the</strong>refore useful to get several results per<br />
ewe at relevant days in milk (i.e. dynamic <strong>of</strong> <strong>the</strong> infections). In that way, CMT results can be<br />
combined with previous SCC results, or vice versa, to confirm <strong>the</strong> “infected” udders.<br />
3 – Phenotypic Relationships Between SCC and O<strong>the</strong>r Traits<br />
3.1. Relationships between SCC and milk production<br />
The phenotypic correlation between SCC and milk production is negative, about –0.1 to –0.2:<br />
IMI causes a reduction <strong>of</strong> <strong>the</strong> milk yield secretion ability <strong>of</strong> <strong>the</strong> udder. Some authors report a<br />
reduction <strong>of</strong> milk production over 20 to 30 %. At <strong>the</strong> INRA La Fage flock (Lacaune breed), <strong>the</strong><br />
estimation <strong>of</strong> loss <strong>of</strong> milk production was about 10 % to 15 % for <strong>the</strong> <strong>sheep</strong> with SCC over<br />
500,000 to 700,000 cells/ml. C. Gonzalo in 2002 found <strong>the</strong> same range <strong>of</strong> loss <strong>of</strong> production:<br />
between 9 to 10 % for Churra ewe with a pathogen and high SCC (1,000,000 cells/ml).<br />
3.2. Relationship between SCC, milk composition and technological properties <strong>of</strong> milk<br />
The relationships between SCC and milk composition can be summarized as follows (Pirisi<br />
et al. 2000, Albenzio et al. 2002, Bianchi et al. 2004, Leitner et al. 2003., Vivar-Quintana et al.<br />
2006):<br />
- <strong>the</strong> pH value <strong>of</strong> <strong>the</strong> milk increases with SCC<br />
- <strong>the</strong> lactose content falls with SCC<br />
- An increase <strong>of</strong> soluble proteins with SCC. The whey protein content <strong>of</strong> high SCC milks<br />
may induce an increase in <strong>the</strong> protein content <strong>of</strong> <strong>the</strong> milk, but <strong>the</strong> casein/protein ratio will<br />
tend to be lower in such high SCC milks. SCC has no significant incidence on nonprotein<br />
nitrogen and urea values.<br />
- SCC seems to have no significant influence on total calcium and phosphorus contents,<br />
while <strong>the</strong> modification in <strong>the</strong> filtration system <strong>of</strong> <strong>the</strong> infected udder modifies soluble<br />
calcium, soluble phosphorus and potassium.<br />
- SCC does not affect <strong>the</strong> milk fat content.<br />
46
The influence <strong>of</strong> high SCC on cheese making properties <strong>of</strong> <strong>the</strong> milk depends on <strong>the</strong> cheese<br />
technology. However, <strong>the</strong> relationships between SCC and rheological properties (Pirisi et al.<br />
2000, Vivar-Quintana et al. 2006, Bianchi et al. 2004.) are mainly due to <strong>the</strong> change in native<br />
pH. Indeed, pH has a strong influence on <strong>the</strong> rheological parameters. Milk with a high SCC and a<br />
high native pH value displays a significant leng<strong>the</strong>ning in milk clotting time, and <strong>the</strong> curd<br />
firming time is significantly higher. The hardness is decreasing with SCC level. Pirisi in 2000<br />
demonstrated that standardization <strong>of</strong> <strong>the</strong> milk’s pH provides in practice milks with identical<br />
rheological characteristics whatever <strong>the</strong> SCC level. Thus, for an unpasteurized cheese type, it<br />
shows that milk SCC does not have significant effect on <strong>the</strong> qualitative characteristics <strong>of</strong> <strong>the</strong><br />
final product.<br />
For yoghurt production, Vivar-Quintana in 2006 recommends that <strong>the</strong> SCC <strong>of</strong> <strong>the</strong> milk<br />
should not exceed 1,500,000 cells/ml. From 0 to 1,500,000, SCC does not influence <strong>the</strong> texture<br />
and <strong>the</strong> quality <strong>of</strong> <strong>the</strong> yogurt. But yoghurts made with high SCC milk (more than 3,000,000<br />
cells/ml) have a very s<strong>of</strong>t consistency and a reduced ability to retain serum and flavours are<br />
described as piquant and bitter.<br />
3.3. Relationship between SCC, udder morphology and machine milking ability<br />
There are few results describing <strong>the</strong> phenotypic relationships between SCC, udder<br />
morphology and machine milking ability. The recent results obtained in France in <strong>the</strong> Lacaune<br />
breed indicated negative correlations (-0.04 to -0.10) thus slightly favourable relationships<br />
between udder (teat angle, udder cleft, udder depth) and SCS, while <strong>the</strong> relationship between<br />
SCC and machine milking ability (milking speed) is in <strong>the</strong> same range but slightly unfavourable.<br />
3.4. Conclusion<br />
If <strong>the</strong> relationships between SCC and milk production (milk yield and composition) are now<br />
established, it is not <strong>the</strong> case for <strong>the</strong> relationships between SCC and o<strong>the</strong>r traits like machine<br />
milking ability estimated for a few breeds. The cheese properties <strong>of</strong> <strong>the</strong> milk are negatively<br />
influenced by high levels <strong>of</strong> SCC. For this reason, plus possible human health problems linked to<br />
pathogenic contaminants in high SCC milk, it is recommended to limit <strong>the</strong> SCC level in <strong>dairy</strong><br />
<strong>sheep</strong> milk below 1,500,000 cells/ml.<br />
4 – Control <strong>of</strong> SCC<br />
4.1. Bulk milk SCC<br />
In <strong>dairy</strong> <strong>sheep</strong>, <strong>the</strong> bulk milk SCC is an important tool in <strong>the</strong> control <strong>of</strong> SCC, since it is, first -<br />
<strong>the</strong> main available information to define a given control strategy, and second - this control<br />
strategy must be adapted to <strong>the</strong> level <strong>of</strong> bulk SCC.<br />
47
4.1.1. Annual level<br />
There is a strong relationship between <strong>the</strong> annual geometric mean <strong>of</strong> <strong>the</strong> bulk SCC and <strong>the</strong><br />
estimated prevalence <strong>of</strong> infected ewes, based on a decision rule considering an udder as infected<br />
if at least two individual SCC (iSCC) are higher than 1.2 million cells/ml.<br />
As shown in Figure 8, an annual bulk SCC <strong>of</strong> 650,000 cells/ml corresponds to a prevalence<br />
<strong>of</strong> 15 %. A change <strong>of</strong> 100,000 cells/ml <strong>of</strong> <strong>the</strong> annual bulk SCC reflects a 2 to 3% change in<br />
prevalence <strong>of</strong> infected ewes.<br />
Figure 8. Relationship between <strong>the</strong> annual geometric mean <strong>of</strong> bulk SCC and <strong>the</strong> estimated<br />
prevalence <strong>of</strong> IMI (from Ber<strong>the</strong>lot et al. 2006)<br />
Estimated prelavence <strong>of</strong><br />
infected ewes<br />
60<br />
55<br />
50<br />
45<br />
40<br />
35<br />
30<br />
25<br />
20<br />
15<br />
10<br />
5<br />
0<br />
4.1.2. Punctual level<br />
y = 0.0201x<br />
r2 = 0.7951<br />
0.0 500.0 1000.0 1500.0 2000.0<br />
Annual geometric mean <strong>of</strong> bulk SCC (x 1000 per ml)<br />
As shown in <strong>the</strong> Figure 9, <strong>the</strong> punctual SCC <strong>of</strong> <strong>the</strong> bulk milk reflects <strong>the</strong> repartition <strong>of</strong> SCC<br />
<strong>of</strong> <strong>the</strong> ewes:<br />
- for a tank SCC equal to 900,000 cells/ml, ewes with more than 1,000,000 cells/ml represent<br />
more than 75 % <strong>of</strong> <strong>the</strong> bulk cells but only 17 % <strong>of</strong> <strong>the</strong> production <strong>of</strong> milk,<br />
- for a tank SCC equal to 400,000 cells/ml, <strong>the</strong> SCC contribution is comparable but <strong>the</strong> milk<br />
contribution <strong>of</strong> <strong>the</strong> high SCC ewes is limited to 7% <strong>of</strong> <strong>the</strong> <strong>dairy</strong> production.<br />
Thus it is obvious that control <strong>of</strong> SCC has to focus on <strong>the</strong>se “infected” ewes which are not so<br />
numerous (have a limited contribution to <strong>the</strong> milk production <strong>of</strong> <strong>the</strong> flock), but have a <strong>great</strong><br />
contribution to bulk tank SCC and are an important source <strong>of</strong> IMI and reservoir <strong>of</strong> bacterial<br />
infections for healthy ewes.<br />
48
Figure 9. Contribution to bulk tank milk or bulk tank cells from ewes with iSCC over 1,000,000,<br />
2,500,000, 5,000,000 or 7,500,000 cells/ml when bulk tank SCC is 400,000 cells/ml or 900,000<br />
cells/ml.<br />
% <strong>of</strong> ewe in <strong>the</strong> flock<br />
Bulk tank SCC : 400 000 cells/ml<br />
60<br />
50<br />
40<br />
30<br />
20<br />
10<br />
0<br />
4.2. Is it possible to control SCC?<br />
In France, <strong>the</strong> comparison <strong>of</strong> <strong>the</strong> evolution <strong>of</strong> annual SCC between Roquefort and Pyrenees<br />
areas gives an indirect positive answer to this question (Fig. 10).<br />
Figure 10. Evolution <strong>of</strong> <strong>the</strong> annual arithmetic mean <strong>of</strong> bulk SCC in <strong>the</strong> Pyrenees and <strong>the</strong><br />
Roquefort area (Lagriffoul, 2005)<br />
SCC (*1 000 cells/ml )<br />
900<br />
850<br />
800<br />
750<br />
700<br />
650<br />
600<br />
550<br />
500<br />
802<br />
741<br />
00<br />
00<br />
200 200 200 200<br />
400 400 400 400<br />
600 600 600 600<br />
800 800 800 800<br />
1000 1000 1000 1000<br />
2000 2000 2000 2000<br />
3000 3000 3000 3000<br />
4000 4000 4000 4000<br />
5000 5000 5000 5000<br />
6000 6000 6000 6000<br />
7000 7000 7000 7000<br />
CCSi (*1 1 % 000 <strong>of</strong> <strong>the</strong> cel/ml) milk 22 % <strong>of</strong> <strong>the</strong> cells<br />
734<br />
674<br />
7 % <strong>of</strong> <strong>the</strong> milk<br />
70 % <strong>of</strong> <strong>the</strong> cells<br />
3 % <strong>of</strong> <strong>the</strong> milk<br />
52 % <strong>of</strong> <strong>the</strong> cells<br />
768<br />
1.5 % <strong>of</strong> <strong>the</strong> milk<br />
35 % <strong>of</strong> <strong>the</strong> cells<br />
762<br />
831<br />
736<br />
% <strong>of</strong> ewein % brebis <strong>the</strong> flock<br />
848<br />
707<br />
1995 1996 1997 1998 1999 2000 2001 2002 2003 2004 2005<br />
During <strong>the</strong> period 1995/1997, <strong>the</strong> level <strong>of</strong> SCC was comparable in <strong>the</strong> two areas <strong>of</strong><br />
production. During <strong>the</strong> last 10 past years, <strong>the</strong> average SCC <strong>of</strong> <strong>the</strong> Roquefort flocks dropped from<br />
750,000 cells/ml to 500,000 cells/ml; a 33 % reduction. In <strong>the</strong> same time, <strong>the</strong>re is no clear<br />
evolution <strong>of</strong> <strong>the</strong> average SCC in Pyrenees flocks. In <strong>the</strong> Roquefort area, SCC is one <strong>of</strong> <strong>the</strong><br />
49<br />
Bulk tank SCC : 900 000 cells/ml<br />
35<br />
30<br />
25<br />
20<br />
15<br />
10<br />
5<br />
0<br />
803<br />
647<br />
779<br />
595<br />
Pyrenees Roquefort area<br />
778<br />
556<br />
17 % <strong>of</strong> <strong>the</strong> milk<br />
78 % <strong>of</strong> <strong>the</strong> cells<br />
00<br />
00<br />
00<br />
200 200 200 200 200 200<br />
400 400 400 400 400 400<br />
600 600 600 600 600 600<br />
800 800 800 800 800 800<br />
1000 1000 1000 1000 1000 1000<br />
2000 2000 2000 2000 2000 2000<br />
3000 3000 3000 3000 3000 3000<br />
4000 4000 4000 4000 4000 4000<br />
5000 5000 5000 5000 5000 5000<br />
6000 6000 6000 6000 6000 6000<br />
7000 7000 7000 7000 7000 7000<br />
CCSi (*1<br />
3 %<br />
000<br />
<strong>of</strong> <strong>the</strong><br />
cel/ml)<br />
milk 35 % <strong>of</strong><strong>the</strong> cells<br />
832<br />
566<br />
9 % <strong>of</strong> <strong>the</strong> milk<br />
63 % <strong>of</strong> <strong>the</strong> cells<br />
5 % <strong>of</strong> <strong>the</strong> milk<br />
48 % <strong>of</strong> <strong>the</strong> cells<br />
824<br />
590<br />
858<br />
516
criteria with high penalties (over a given threshold) to determine milk price since 1993.<br />
Therefore producer organizations and <strong>dairy</strong> plants have implemented a control plan for<br />
subclinical mastitis in <strong>the</strong> Roquefort area. In Pyrenees mountains, <strong>the</strong> producers (except for <strong>the</strong><br />
home cheese makers) and <strong>the</strong> <strong>dairy</strong> industry give no particular attention to SCC.<br />
4.3. Definition <strong>of</strong> a control program<br />
To be efficient, a control plan has to combine preventive and curative action. Efficiency <strong>of</strong><br />
vaccination to control IMI is not yet clearly established and large scale controlled trials are still<br />
needed on this topic. Therefore, we will not consider vaccination as an operating control tool in<br />
<strong>the</strong> presentation.<br />
4.3.1. Preventative actions<br />
Since mastitis in <strong>dairy</strong> <strong>sheep</strong> results mainly from bacterial infections whose reservoir is<br />
generally in <strong>the</strong> udder or teat and transmission between ewes is favoured by milking, <strong>the</strong> first<br />
objective, both preventative and curative actions, is control <strong>of</strong> <strong>the</strong> reservoir, i.e. <strong>the</strong> infected<br />
ewes.<br />
The control <strong>of</strong> environmental sources consists in applying good housing recommendations<br />
mainly to reduce staphylococcal pressure (density, air humidity…). This may be an important<br />
feature during <strong>the</strong> lambing period characterized by a high concentration <strong>of</strong> animals.<br />
Bacteriological transmission during milking is a key point for control actions. Thus <strong>the</strong><br />
milking machine must be cleaned and controlled regularly (once a year). The liners must be<br />
replaced every year for rubber ones and every two years for silicone ones. The milking technique<br />
must avoid teat impacts (and air inlets in general): brutal stripping, removal <strong>of</strong> <strong>the</strong> cluster without<br />
cutting <strong>of</strong>f <strong>the</strong> vacuum… The milking time must be adapted to avoid over or under-milking.<br />
Teat-dipping or spraying is an efficient tool for reducing IMI incidence. But this technique is<br />
antagonistic to a high milking throughput, specially for large flocks. Therefore, it can be<br />
promoted, in a high prevalence situation, during a limited period, to deal with an unfavourable<br />
situation with <strong>the</strong> aim <strong>of</strong> reducing IMI incidence.<br />
To implement a milking order may also reduce <strong>the</strong> infection pressure, i.e. to first milk <strong>the</strong><br />
primiparous ewes, since <strong>the</strong>y are less infected, and <strong>the</strong>n <strong>the</strong> adult healthy ewes, followed by<br />
groups <strong>of</strong> ewes <strong>of</strong> increasing IMI or SCC.<br />
4.3.2. Curative action<br />
The main curative action corresponds to <strong>the</strong> reduction <strong>of</strong> animals carrying infection can be<br />
achieved in two ways :<br />
1. culling <strong>of</strong> “infected” ewes<br />
To reach this goal, <strong>the</strong> practical question is how to select <strong>the</strong> ewes to be culled?<br />
50
Regarding <strong>the</strong> dynamics <strong>of</strong> <strong>the</strong> infection, <strong>the</strong> decision can be taken using several possible<br />
criteria, as for instance :<br />
- ewes with several iSCC over 1,000,000 or 1,500,000 cells/ml during <strong>the</strong> lactation;<br />
- ewes who experienced acute or severe chronic IMI : strong udder asymmetry, diffuse<br />
hardness, abscesses… (caution : abscesses must be differentiated from cysts)<br />
- a combination <strong>of</strong> iSCC results and udder indicators.<br />
2. antibiotic treatment at drying-<strong>of</strong>f<br />
The implementation <strong>of</strong> a dry <strong>the</strong>rapy significantly reduced <strong>the</strong> bulk tank milk SCC (Gonzalo<br />
et al. 2005 and 2006). In <strong>dairy</strong> <strong>sheep</strong>, <strong>the</strong> cure rate <strong>of</strong> drying-<strong>of</strong>f intramammary antibio<strong>the</strong>rapy<br />
ranged from 65 to 96 %. Considering <strong>the</strong> length <strong>of</strong> <strong>the</strong> dry period in <strong>dairy</strong> <strong>sheep</strong>, <strong>the</strong> preventative<br />
interest <strong>of</strong> <strong>the</strong> drying <strong>of</strong>f treatment can be discussed. Without drying-<strong>of</strong>f treatment, <strong>the</strong> dynamic<br />
<strong>of</strong> infection during <strong>the</strong> dry period would be (Bergonnier et al 2003):<br />
For infected udders:<br />
- cure rate: 45 %<br />
- rate <strong>of</strong> new infection (substitution): 23 %<br />
- persistence <strong>of</strong> <strong>the</strong> IMI: 32 %<br />
For uninfected udders:<br />
- rate <strong>of</strong> new infection: 10 to 25 %<br />
Taking into account all <strong>the</strong> above parameters, a selective drying-<strong>of</strong>f antibiotic treatment<br />
(devoted to infected and doubtful udders only) may be preferred to a systematic one. Limiting<br />
<strong>the</strong> number <strong>of</strong> treatments may cover <strong>the</strong> cost <strong>of</strong> iSCC or CMT which are needed to select <strong>the</strong><br />
candidate ewes for such a selective treatment.<br />
In <strong>dairy</strong> <strong>sheep</strong>, <strong>the</strong> use <strong>of</strong> drying-<strong>of</strong>f intramammary antibio<strong>the</strong>rapy may be associated, in a<br />
few cases, to acute mastitis caused by opportunistic pathogens (P. aeruginosa or A. fumigatus).<br />
Hygienic precautions may reduce this risk: before <strong>the</strong> treatment (for example P. aeruginosa in<br />
<strong>the</strong> water), during <strong>the</strong> treatment but also at lambing (contact with moldy forage).<br />
At last, but not least, considering <strong>the</strong> dry period duration, it can be assumed that <strong>the</strong> risk <strong>of</strong><br />
residues in <strong>the</strong> milk after lambing is very low. If <strong>the</strong> drying-<strong>of</strong>f treatment is made by waves, <strong>the</strong><br />
treated ewes must be clearly marked to avoid <strong>the</strong> risk <strong>of</strong> milking <strong>the</strong>m (i.e. antibiotic in <strong>the</strong> milk).<br />
4.3.3. Genetic control<br />
Contrary to cattle, no genetic antagonism between milk yield and clinical mastitis has been<br />
demonstrated for <strong>sheep</strong> (Barillet et al., 2001a). Thus in practice, improving udder health in <strong>dairy</strong><br />
<strong>sheep</strong> could be limited, in a first approach, to selection against subclinical mastitis using milk<br />
somatic cell count (SCC). Estimates <strong>of</strong> heritability <strong>of</strong> <strong>the</strong> lactation somatic cell score (LSCS)<br />
computed as in Wiggans and Shook (1987) ranged for <strong>sheep</strong> between 0.10 to 0.18 (El Saied et<br />
al., 1999, Mavrogenis et al., 1999, Barillet et al., 2001a, Othmane et al., 2002, Rupp et al., 2003,<br />
Serrano et al., 2003, Legarra and Ugarte, 2005). Relationships between milk yield and LSCS<br />
were close to zero, from slightly favourable (-0.29) to slightly antagonistic (0.20). It can be<br />
pointed out that several estimates in <strong>the</strong> Lacaune breed always showed a moderate antagonism;<br />
confirmed in addition by a selection experiment with divergent selection for milk yield (Barillet<br />
51
et al., 2001b), <strong>the</strong>se results being in agreement with <strong>the</strong> <strong>dairy</strong> cattle literature (Rupp and<br />
Boichard, 2003). Moreover, <strong>the</strong> genetic correlations between LSCS and several udder-type traits<br />
such as teat placement or udder depth were moderately favourable as already shown in cattle and<br />
ranged from -0.10 to -0.32 (Legarra and Ugarte, 2005, Barillet et al., 2006). There is evidence<br />
that selection on milk traits only would lead in <strong>the</strong> long term to “baggy” udders more difficult to<br />
milk by machine and more susceptible to mastitis. Therefore it is relevant to include in <strong>the</strong><br />
breeding objective functional traits related to udder morphology (udder scores) and udder health<br />
(SCS) for <strong>dairy</strong> <strong>sheep</strong> breeds pr<strong>of</strong>iting for several decades from efficient selection on milk traits<br />
only. Since 2005, <strong>the</strong> Lacaune breed has been selected on a total merit index giving <strong>the</strong> same<br />
relative weights to milk production and udder morphology and health (Barillet et al., 2006). It is<br />
expected that SCC <strong>of</strong> <strong>the</strong> ewes will decrease by 54 % in 10 years, corresponding roughly to a<br />
genetic decrease <strong>of</strong> about a third <strong>of</strong> <strong>the</strong> bulk milk SCC.<br />
Currently <strong>the</strong> selection for mastitis resistance is based on a linear decrease <strong>of</strong> milk SCC. To<br />
validate this strategy, in <strong>the</strong> INRA Lacaune flock, an experiment based on SCC divergent lines<br />
has been in progress since 2003 (Rupp et al., 2006) to study <strong>the</strong> consequences <strong>of</strong> such a SCC<br />
selection on different components <strong>of</strong> <strong>the</strong> host’s resistance to IMI . The preliminary results are<br />
promising: in 2005, <strong>the</strong> production during <strong>the</strong> first lactation <strong>of</strong> <strong>the</strong> two SCC lines was similar:<br />
closed to 0.9 liters per milking, while <strong>the</strong> SCS difference was 1.6, i.e. 400,000 cells/ml for <strong>the</strong><br />
low SCC line versus 850,000 cells/ml for <strong>the</strong> high SCC line. Moreover, low SCC line ewes<br />
showed no clinical cases <strong>of</strong> mastitis, lower infection rate and better ability to recover from<br />
infections during lactation.<br />
4.4. Conclusion<br />
At <strong>the</strong> flock level, <strong>the</strong> control <strong>of</strong> SCC has to be based on several complementary approaches:<br />
- lessening <strong>of</strong> <strong>the</strong> infection pressure: decrease <strong>of</strong> <strong>the</strong> new infections by culling <strong>the</strong> most<br />
infected ewes (if possible) or carrying out a “selective” drying-<strong>of</strong>f treatment. An<br />
“exhaustive individual SCC picture” by sampling all <strong>the</strong> milked ewes would be<br />
recommended to select <strong>the</strong> <strong>sheep</strong> to be culled or treated. The Figure 11 illustrates <strong>the</strong><br />
evolution <strong>of</strong> bulk tank SCC between 2001 and 2002 for flocks involved in a control<br />
program in 2001. There were 2 levels <strong>of</strong> “control”: normal or simplified differing from<br />
<strong>the</strong> realization or not <strong>of</strong> an exhaustive SCC (all <strong>the</strong> o<strong>the</strong>r actions being comparable). It<br />
can easily be noticed <strong>the</strong> decrease <strong>of</strong> SCC after <strong>the</strong> iSCC results: <strong>the</strong> <strong>sheep</strong> with high<br />
SCC had been dried <strong>of</strong>f (or culled) during <strong>the</strong> year 2001. For <strong>the</strong> year 2002, a better SCC<br />
bulk level was noticed for <strong>the</strong> flocks involved on <strong>the</strong> normal action, <strong>the</strong> decrease <strong>of</strong> SCC<br />
being about 100,000 cells/ml or minus 20 %.<br />
- <strong>the</strong> limitation <strong>of</strong> new infections using all <strong>the</strong> preventive possible actions, at a reasonable<br />
cost, in accordance with <strong>the</strong> management <strong>of</strong> <strong>the</strong> flock.<br />
- <strong>the</strong> genetic control for <strong>the</strong> breeds pr<strong>of</strong>iting for several decades from an efficient selection<br />
on milk traits only.<br />
52
Figure 11. Evolution <strong>of</strong> <strong>the</strong> average bulk SCC <strong>of</strong> <strong>the</strong> 3 types <strong>of</strong> flocks according to <strong>the</strong> level <strong>of</strong><br />
control : simplified, normal, control = not involved in <strong>the</strong> program) (Lagriffoul G., 2003)<br />
SCC (mensual geometric means *1 000 cells/ml)<br />
900.0<br />
800.0<br />
700.0<br />
600.0<br />
500.0<br />
400.0<br />
300.0<br />
5 – Final Conclusions<br />
2001_2 2001_2 2001_2<br />
2001_3 2001_3 2001_3<br />
2001_4 2001_4 2001_4<br />
2001_5 2001_5 2001_5<br />
2001_6 2001_6 2001_6<br />
2001_7 2001_7 2001_7<br />
2001_8 2001_8 2001_8<br />
The results obtained during <strong>the</strong> past years have increased <strong>the</strong> knowledge on somatic cell<br />
counts in <strong>dairy</strong> <strong>sheep</strong> in several areas:<br />
- <strong>the</strong> improvement <strong>of</strong> rapid animal-side tests<br />
- <strong>the</strong> assessment <strong>of</strong> bacteriological cure and new infection rates<br />
- <strong>the</strong> estimation <strong>of</strong> true efficiency <strong>of</strong> preventative actions<br />
- <strong>the</strong> relationships with milk flow kinetics<br />
- <strong>the</strong> development <strong>of</strong> vaccines<br />
The lack <strong>of</strong> statistics for <strong>dairy</strong> <strong>sheep</strong> does not allow relevant comparisons <strong>of</strong> <strong>the</strong> SCC<br />
situation in different countries. At a large scale (country or area <strong>of</strong> production), <strong>the</strong> average value<br />
<strong>of</strong> bulk SCC ranges from 400,000/500,000 to 1,000,000/1,200,000 cells/ml, and sometimes<br />
more.<br />
But <strong>the</strong> control <strong>of</strong> SCC is now being effective in several countries and “low” levels <strong>of</strong><br />
average SCC are being described. For example, in 2005, <strong>the</strong> average SCC in Roquefort area<br />
(2,500 flocks – 180 millions liters) was about 500,000 cells/ml, corresponding to a 33 %<br />
decrease during <strong>the</strong> last 10 years based on preventative and curative actions; not yet including<br />
genetic control which just started in 2005.<br />
53<br />
2002-1 2002-1 2002-1<br />
2002-2 2002-2 2002-2<br />
2002-3 2002-3 2002-3<br />
2002-4 2002-4 2002-4<br />
2002-5 2002-5 2002-5<br />
2002-6 2002-6 2002-6<br />
2002-7 2002-7 2002-7<br />
2002-8 2002-8 2002-8<br />
simplified normal control
6 – References<br />
Albenzio M., Taibi L., Muscio A., Sevi A., 2002. Prevalence and etiology <strong>of</strong> subclinical mastitis<br />
in intensively managed flocks and related changes in <strong>the</strong> yield and quality <strong>of</strong> ewe milk. Small<br />
Ruminant Research 43 (2002) 219-226.<br />
Barillet F., Astruc J.M., Lagriffoul G., 2006. Functional traits in small <strong>dairy</strong> ruminants: genetic<br />
variation and relationships with milk production. Proc. 8 th World Congres. Genet. Appl.<br />
Livest. Prod., Belo-Horizonte, 13-18 August 2006, Brazil. CD-ROM communication 2-01.<br />
Barillet, F., Rupp, R., Mignon-Grasteau, S., Astruc J. M., Jacquin M. ,2001a. Genetic analysis<br />
for mastitis resistance and milk somatic cell score in French Lacaune <strong>dairy</strong> <strong>sheep</strong>. Genet. Sel.<br />
Evol. 33 : 297-415.<br />
Barillet F., Marie C., Jacquin M., Lagriffoul G., Astruc J. M. ,2001b. The French Lacaune <strong>dairy</strong><br />
<strong>sheep</strong> breed: use in France and abroad in <strong>the</strong> last 40 years., Livest. Prod. Sci. 71: 17-29.<br />
Bergonier D., Lagriffoul G., Ber<strong>the</strong>lot X., 2006. Etiologie, épidémiologie et diagnostic des<br />
mammites ovines. Bulletin des GTV n°36-octobre 2006:98-108.<br />
Bergonier D., de Cremoux R., Rupp R., Lagriffoul G., Ber<strong>the</strong>lot X., 2003. Mastitis <strong>of</strong> <strong>dairy</strong> small<br />
ruminants. Vet. Res. 34:689-716.<br />
Bergonier D. 2005. Les mammites de la brebis laitière : étiologie et épidémiologie. In "Actualités<br />
sur la maîtrise des infections mammaires des brebis laitières", Intervet édit., 13-26.<br />
Bergonier D. 2005. Les mammites de la brebis laitière : diagnostic et maîtrise. In "Actualités sur<br />
la maîtrise des infections mammaires des brebis laitières », Intervet édit., 27-44.<br />
Ber<strong>the</strong>lot X., Lagriffoul G., Concordet D., Barillet F., Bergonier D., 2006. Physiological and<br />
pathological thresholds <strong>of</strong> somatic cell counts in ewe milk. Small Ruminant Research 62 :<br />
27-31.<br />
Bianchi L., Bolla A., Budelli E., Caroli A. Casoli C., Pauselli M., Duranti E., 2004. Effect <strong>of</strong><br />
udder health status and lactation phase on <strong>the</strong> characteristics <strong>of</strong> Sardinian ewe milk. J. Dairy<br />
Sci. 87:2401-2408.<br />
Billon P., Lagriffoul G., Maraval E., 2003. La traite mécanique des brebis : état du parc des<br />
machines à traire et relation avec la qualité du lait., CR 2033101, Institut de l’Elevage,<br />
janvier 2003 25p.<br />
El Saied U.M., Carriero J.A., De La Fuente L.F., San Primitivo F. ,1999. Genetic parameters <strong>of</strong><br />
lactation cell counts and milk and protein yield in <strong>dairy</strong> ewes. J. Dairy Sci. 81: 2956-2961.<br />
Gonzalo C., Carriedo J.A., Blanco M.A., Beneitez E., Juarez M.T., De La Fuente L.F. and San<br />
Primitivo F. 2005. Factors <strong>of</strong> variation influencing bulk tank somatic cell count in <strong>dairy</strong><br />
<strong>sheep</strong>. J. Dairy Sci. 88:969-974.<br />
Gonzalo C., Carriedo J.A., Beneitez E., Juarez M.T., Fuente L.F de la. and San Primitivo F.<br />
2006. Bulk tank total bacterial count in <strong>dairy</strong> <strong>sheep</strong>: factors <strong>of</strong> variation and relationship with<br />
somatic cell count. J. Dairy Sci. 88:969-974.<br />
Gonzalo C., Martinez J.R., Carriedo J.A. and San Primitivo F., 2003. Fossomatic cell-counting<br />
on ewe milk : comparison with direct microscopy and study <strong>of</strong> variation factors. J.Dairy Sci.<br />
86:138-145.<br />
Gonzalo C., Ariznabarreta A., Carriedo J.A., San Primitivo F., 2002. Mammary pathogens and<br />
<strong>the</strong>ir relationship to somatic cell count and milk yield losses in <strong>dairy</strong> ewes. J. Dairy Sci.<br />
85:1460-1467.<br />
IDF, 1995. Enumeration <strong>of</strong> somatic cells. International Dairy Federation (FIL-IDF Standard N°<br />
148A), Brussels, Belgium.<br />
54
Lafi S.Q. 2005. Use <strong>of</strong> somatic cell counts and California Mastitis Test results from udder halves<br />
milk samples to detect subclinical intramammary infection in Awassi <strong>sheep</strong>. Small Ruminant<br />
Research 62(2006) 83-86.<br />
Lagriffoul G. 2005. La maîtrise des infections mammaires : un enjue de filière. In "Actualités sur<br />
la maîtrise des infections mammaires des brebis laitières », Intervet édit., 27-44.<br />
Lagriffoul G. 2003. Evalutation de l’action ” maîtrise en élevage des comptages de cellules<br />
somatiques”. Document de travail.<br />
Legarra A., Ugarte E. ,2005. Genetic parameters <strong>of</strong> udder traits, somatic cell score and milk yield<br />
in Latxa <strong>sheep</strong> J. Dairy Sci. 88: 2238-2245.<br />
Leitner G., Chaffer M., Caraso Y., Ezra E., Kababea D., Winkler M., Glickman A. Saran A.,<br />
2003. Udder infection and milk somatic cell count, NAGase activity and milk compositionfat,<br />
protein and lactose-in Israleli-Assaf and Awassi <strong>sheep</strong>. Small Ruminant Research<br />
49(2003) 157-164.<br />
Martinez J.R., Gonzalo C., Carriedo J.A., San Primitivo F. 2003., Effect <strong>of</strong> freezing on<br />
Fossomatic cell counting in ewe milk. J. Dairy Sci. 86:2583-2587.<br />
Mavrogenis A.P., Koumas A., Gavrielidis G. ,1999. The inheritance <strong>of</strong> somatic cell counts in<br />
Chios <strong>sheep</strong>. EAAP Publication N° 95, pp 389-392.<br />
McDougall S., Murdough P., Pankey W., Delaney C., Barlow J., Scruton D., 2001. Relationship<br />
among somatic cell count, California mastitis test, impedance and bacteriological status <strong>of</strong><br />
milk in goasts and <strong>sheep</strong> early lactation. Small Ruminant Research 40(2001) 245-254.<br />
Othmane M.H., Carriedo J.A., San Primitivo F., de la Fuente J.A. ,2002. Genetic parameters for<br />
lactation traits <strong>of</strong> milking ewes: protein content and composition, fat, somatic cells and<br />
individual laboratory cheese yield. Genet. Sel. Evol. 34 : 581-596.<br />
Pirisi A. Piredda G. Corona M., Pes M., Pintus S. Ledda A. 2000. Influence <strong>of</strong> somatic cell count<br />
on ewes milk composition, cheese yield and cheese quality. 6th Great <strong>lakes</strong> <strong>dairy</strong> <strong>sheep</strong><br />
<strong>symposium</strong>. Nov 2-4. 2000.<br />
Rupp R., Boichard D. ,2003. Genetics <strong>of</strong> resistance to mastitis in <strong>dairy</strong> cattle. Vet. Res. 34: 671-<br />
688.<br />
Rupp R., Lagriffoul G., Astruc J.M., Barillet F. ,2003. Genetic parameters for milk somatic cell scores and<br />
relationships with production traits in French Lacaune <strong>dairy</strong> <strong>sheep</strong> J. Dairy Sci. 86: 1476-1481.<br />
Rupp R., Bergonier D., Dion S., Hygonenq M.C., Aurel M.R., Foulon E., Foucras G. ,2006.<br />
Effects <strong>of</strong> SCC-based selection for mastitis resistance: first results from a divergent selection<br />
experiment in <strong>sheep</strong>. Proc. 8 th World Congres. Genet. Appl. Livest. Prod., Belo-Horizonte,<br />
13-18 August 2006, Brazil. CD-ROM communication 15-16.<br />
Serrano M., Perez-Guzman M.D., Montoro V., Jurado J.J. ,2003. Genetic analysis <strong>of</strong> somatic cell<br />
count and milk traits in Manchega ewes : Mean lactation and test-day approaches Livest.<br />
Prod. Sci. 84: 1-10.<br />
Vivar-Quintana A.M., Beneitez De La Mano E., Revilla I., 2006. Relationship between somatic<br />
cell counts and <strong>the</strong> properties <strong>of</strong> yoghurt made from ewes’ milk. Int. Dairy Journal 16(2006)<br />
262-267.<br />
Wiggans G.R., Shook G.E. ,1987. A lactation measure <strong>of</strong> somatic cell count J. Dairy Sci. 77:<br />
2666-2672.<br />
55
EFFECT OF SUPPLEMENTATION AND STAGE OF LACTATION ON<br />
PERFORMANCE OF GRAZING DAIRY EWES<br />
Claire M. Mikolayunas 1,2 , David L. Thomas 1 , Kenneth A. Albrecht 2 , David K. Combs 3 , and<br />
Yves M. Berger 4<br />
1 <strong>Department</strong> <strong>of</strong> <strong>Animal</strong> Sciences, 2 <strong>Department</strong> <strong>of</strong> Agronomy, 3 <strong>Department</strong> <strong>of</strong> Dairy<br />
Science, 4 Spooner Agricultural Research Station, University <strong>of</strong> Wisconsin-Madison,<br />
Madison, Wisconsin, USA<br />
Summary<br />
A study was conducted in <strong>the</strong> summer <strong>of</strong> 2005 to determine <strong>the</strong> effect <strong>of</strong> stage <strong>of</strong> lactation<br />
and supplementation on <strong>the</strong> performance <strong>of</strong> <strong>dairy</strong> ewes grazing kura clover-orchardgrass<br />
pastures. Fifty-six three-yr-old ewes in early (21 ± 10 d in milk (DIM)) or late (136 ± 9 DIM)<br />
lactation and were fed 0 or 0.80 kg DM/d <strong>of</strong> supplement (18 % CP mixture <strong>of</strong> corn and a high<br />
protein pellet) in a 2 x 2 factorial arrangement <strong>of</strong> treatments. Average daily milk production and<br />
daily milk protein percentage was higher in early lactation ewes than late lactation ewes (1.74 vs.<br />
1.21 kg/d and 5.02 vs. 4.86 %, respectively). Supplemented ewes had higher average daily milk<br />
production (1.59 vs. 1.36 kg/d respectively), lower milk fat percentage (5.75 vs. 6.00 %,<br />
respectively), and lower milk protein percentage (4.84 vs. 5.04 %, respectively) than<br />
unsupplemented ewes. Trial milk urea nitrogen (MUN) levels in all treatments (18 to 34 mg/dl)<br />
tended to be higher than recommended levels for <strong>sheep</strong> (14 to 22 mg/dl), indicating an excess <strong>of</strong><br />
protein intake. This can be explained by high quality pastures, which ranged in crude protein<br />
from 16 to 30 %. Based on estimates <strong>of</strong> dry matter intake using <strong>the</strong> external marker titanium<br />
dioxide and <strong>the</strong> internal marker acid detergent lignin, <strong>the</strong>re was no significant difference in<br />
pasture dry matter intake between supplementation or stage <strong>of</strong> lactation treatments.<br />
Background<br />
The United States <strong>dairy</strong> <strong>sheep</strong> industry has grown over <strong>the</strong> past 25 years and in 2003 <strong>the</strong>re<br />
were approximately 75 farms in North America producing over 1.5 million kg <strong>of</strong> <strong>sheep</strong> milk<br />
annually (Thomas, 2004). Despite this growth, <strong>the</strong> United States imported 33.2 million kg <strong>of</strong><br />
<strong>sheep</strong> milk cheese worth over $184 million in 2004 (FAO, 2006), indicating room for <strong>the</strong><br />
domestic market to expand.<br />
The United States <strong>dairy</strong> <strong>sheep</strong> industry has developed in two main regions, New England and<br />
<strong>the</strong> Upper Midwest, both well suited to pasture production. The development <strong>of</strong> flocks in <strong>the</strong>se<br />
areas may be attributed to <strong>the</strong> <strong>sheep</strong>’s ability to effectively utilize improved pasture along with a<br />
market and infrastructure for artisan cheeses and <strong>sheep</strong>-milk products. Since <strong>dairy</strong> <strong>sheep</strong> are<br />
relatively new to <strong>the</strong> United States, information regarding supplementation on pasture and<br />
pasture utilization remains inadequate. While supplementation had a positive effect on milk<br />
production <strong>of</strong> grazing lactating cows (Reis and Combs, 2000) and commercial <strong>sheep</strong> (D’Urso et<br />
al., 1993), little information is available regarding <strong>the</strong> supplementation <strong>of</strong> <strong>dairy</strong> <strong>sheep</strong> on high<br />
quality, temperate pastures. In a study <strong>of</strong> nursing ewes receiving low or high levels <strong>of</strong><br />
supplementation while grazing, lamb growth was <strong>great</strong>er when dam supplementation was high<br />
56
(Penning et al., 1988). Ano<strong>the</strong>r study <strong>of</strong> lactating ewes grazing different pasture allowances (500<br />
or 750 kg organic matter/ha) with three levels <strong>of</strong> cereal supplement (0, 0.48 or 0.96 kg organic<br />
matter/d) found no effect <strong>of</strong> ewe supplementation on lamb growth. There was an effect <strong>of</strong><br />
herbage allowance on lamb growth; ewes grazing paddocks with high herbage allowance<br />
supported faster growing lambs (Milne et al., 1981). Therefore, forage availability has an<br />
important effect on animal intake and performance. This study was conducted to determine <strong>the</strong><br />
effect <strong>of</strong> supplementation on milk production and milk composition <strong>of</strong> grazing <strong>dairy</strong> ewes at<br />
different stages <strong>of</strong> lactation. In addition, <strong>the</strong> study measured dry matter intake on pasture using<br />
titanium dioxide as an external marker and estimated protein utilization by monitoring milk urea<br />
nitrogen levels.<br />
Materials and Methods<br />
Ewes and pasture. The study was conducted at <strong>the</strong> University <strong>of</strong> Wisconsin-Madison,<br />
Spooner Agricultural Research Station from May 25 to August 15, 2005. Twenty acres <strong>of</strong><br />
pasture were divided into 1.5 acre paddocks and <strong>the</strong>y ranged in composition from a mixture <strong>of</strong><br />
approximately 60% kura clover (Trifolium ambiguum Bieb.) and 40% orchardgrass (Dactylis<br />
glomerata L.) and perennial ryegrass (Lolium perenne L.) to 5% kura clover and 95%<br />
orchardgrass, Kentucky bluegrass (Poa pratensis L.) and quackgrass (Agropyron repens L.).<br />
Ewes were moved to a new paddock at two to four day intervals, depending on forage<br />
availability. The interval between grazing events in each paddock was approximately three<br />
weeks. After grazing, each paddock was clipped to a height <strong>of</strong> 7.5 cm to allow for consistent<br />
regrowth.<br />
Fifty-six three-yr-old ewes were arranged in a 2 x 2 factorial treatment design; in early or late<br />
lactation and receiving 0 or 0.80 kg DM/d <strong>of</strong> supplement. All ewes were weaned from <strong>the</strong>ir<br />
lambs at 36 to 48 h postpartum and machine milked twice per day in a double-twelve parlor from<br />
weaning and fed 0.80 kg DM/d <strong>of</strong> supplement and 1.9 kg DM/d <strong>of</strong> alfalfa silage in drylot until<br />
grazing began on May 25, when supplementation treatments were applied. The ingredient and<br />
nutrient composition <strong>of</strong> <strong>the</strong> supplement is reported in Table 1. All ewes were on pasture toge<strong>the</strong>r<br />
for approximately 20 h/d and were milked twice daily at 0530 and 1700h. Ewes were provided<br />
water in <strong>the</strong> pasture and a free choice mineral-salt mixture in <strong>the</strong> parlor holding area; no shade<br />
was provided in <strong>the</strong> pasture.<br />
In addition to <strong>the</strong> 56 three-yr-old ewes, <strong>the</strong>re were 20 two-yr-old ewes and 19 four-yr-old<br />
ewes in late lactation that were divided between <strong>the</strong> unsupplemented and supplemented<br />
treatments. They were managed with <strong>the</strong> 56 three-yr-old ewes. The two- and four-yr-old ewes<br />
were not included in <strong>the</strong> analysis <strong>of</strong> <strong>the</strong> milk production data because this would have resulted in<br />
<strong>the</strong> confounding <strong>of</strong> <strong>the</strong> effects <strong>of</strong> ewe age and stage <strong>of</strong> lactation, but some <strong>of</strong> <strong>the</strong>se ewes were<br />
used in <strong>the</strong> collection <strong>of</strong> dry matter intake (DMI) and milk urea nitrogen (MUN) data.<br />
57
Table 1: Composition <strong>of</strong> supplement fed<br />
to grazing <strong>dairy</strong> ewes.<br />
Ingredient % <strong>of</strong> DM<br />
Whole corn 75.0<br />
Soybean meal 14.9<br />
Wheat middlings 4.6<br />
Canola meal 3.8<br />
Distillers grain 1.3<br />
Molasses 0.4<br />
Composition % <strong>of</strong> DM<br />
Crude protein 18.0<br />
Neutral detergent fiber 10.8<br />
Non-fiber carbohydrates 66.6<br />
Ash 2.7<br />
Fat 3.8<br />
Sample collection, analysis and calculations. Daily milk production <strong>of</strong> individual ewes<br />
was measured weekly using a graduated Waikato Goat Meter (Inter Ag, New Zealand) by<br />
combining <strong>the</strong> amount <strong>of</strong> milk obtained at an evening and subsequent morning milking. Biweekly<br />
milk samples from <strong>the</strong> morning milking were analyzed for percentage fat and protein<br />
(AgSource Milk Labs, Stratford, WI). A compiled milk sample from eight to ten ewes in each <strong>of</strong><br />
<strong>the</strong> four stages <strong>of</strong> lactation and supplementation treatment combinations was analyzed for MUN<br />
biweekly (AgSource Milk Labs, Stratford, WI). Ewes were weighed biweekly and body<br />
condition scored once per month (1 = very thin, 5 = very fat; Boundy, 1982).<br />
Daily milk production, milk fat percentage, and milk protein percentage were used to<br />
calculate 6.5 % fat corrected milk (FCM) and 6.5% fat and 5.8% protein corrected milk (FPCM)<br />
based on <strong>the</strong> following equations developed by Pulina et al. (1989):<br />
FCM = M (0.37 + (0.097 x F))<br />
FPCM = M (0.25 + (0.085 x F) + (0.035 x P))<br />
where:<br />
M = milk yield (kg) and F and P = fat and protein concentration (%); respectively.<br />
Total trial production <strong>of</strong> milk, fat, protein, FCM and FPCM were calculated based on <strong>the</strong><br />
equations <strong>of</strong> Berger and Thomas (2004). Total percentage <strong>of</strong> fat and protein during <strong>the</strong> trial were<br />
calculated from values <strong>of</strong> total milk, total fat and total protein produced.<br />
Pasture samples were collected from paddocks approximately twice per week. Four quadrats<br />
(0.37 m 2 ) were tossed randomly throughout <strong>the</strong> paddock before a grazing event, and forage was<br />
harvested to 2.5 cm stubble height. Forage samples were weighed and oven-dried (37º C forcedair<br />
oven) until <strong>the</strong>y reached a constant weight. A composite <strong>of</strong> <strong>the</strong> four pre-grazing forage<br />
samples from each pasture was ground to pass through a 1-mm screen in a UDY cyclone mill<br />
before laboratory analysis. Forage samples were analyzed for dry matter (DM), total nitrogen<br />
(N) and neutral detergent fiber (NDF).<br />
58
Pre-grazing herbage mass (kg DM/ha) and pasture allowance (kg DM/ewe/d) were measured<br />
using a rising plate meter placed in 25 random locations throughout <strong>the</strong> paddock. The plate<br />
meter (1,254 g and 0.16 m 2 ) was calibrated to each pasture by correlating <strong>the</strong> DM and rising<br />
plate reading <strong>of</strong> 20 clipped samples, as described by Bransby et al. (1977). Pasture calibration<br />
was repeated twice in early and mid-grazing season to account for changes in pasture<br />
composition and maturity over time. Post-grazing pasture residue was estimated once per week<br />
with <strong>the</strong> rising plate meter to verify sufficient pasture allowance.<br />
Marker. Titanium dioxide (TiO2) was used as an external marker to estimate pasture intake<br />
<strong>of</strong> ten ewes randomly selected from each supplementation treatment. A pre-treatment fecal<br />
sample was taken from ewes in each treatment before administration <strong>of</strong> <strong>the</strong> marker. Gelatin<br />
capsules <strong>of</strong> 2.5 g <strong>of</strong> TiO2 were administered to ewes twice daily for 11 days. After a seven day<br />
adjustment period, fecal grab samples were collected once per day, at 1630 h, for <strong>the</strong> following<br />
four days. A compiled fecal sample for each ewe was stored frozen and subsequently oven dried<br />
(60º C forced-air for 48 h) and ground to pass through a 1-mm screen in a UDY cyclone mill.<br />
Fecal samples were analyzed for <strong>the</strong> concentration <strong>of</strong> TiO2 using <strong>the</strong> colorimetric technique<br />
described by Myers et al. (2004). Total fecal output (FO; g/d) was estimated by <strong>the</strong> equation:<br />
FO = (g TiO2 administered per d) / (g TiO2 /g feces DM)<br />
Forage fecal output (FFO) was equal to FO for unsupplemented ewes. For supplemented ewes,<br />
FFO was estimated by subtracting <strong>the</strong> estimated fecal output <strong>of</strong> grain (0.82 kg grain * 97 % DM<br />
* 90 % digestibility) from <strong>the</strong> total FO. Based on FFO, pasture DMI was estimated using <strong>the</strong><br />
equation:<br />
Pasture DMI = FFO x (100/100-DMDpasture)<br />
Fecal and forage samples were analyzed for acid detergent lignin (ADL), using <strong>the</strong> technique <strong>of</strong><br />
Robertson and Van Soest (1981), to determine apparent forage digestibility:<br />
Dry matter digestibility (DMD) = 100 – ((% ADL forage / % ADL fecal) * 100)<br />
For unsupplemented ewes, pasture DMI represents total DMI. For supplemented ewes, total<br />
DMI was estimated by adding pasture DMI to grain DM (0.82 kg/d * 97 % DM) <strong>of</strong>fered in <strong>the</strong><br />
parlor.<br />
Statistical analyses. Weekly milk production, bi-weekly fat and protein percentage, BW<br />
and BCS were analyzed using <strong>the</strong> mixed model procedure <strong>of</strong> SAS 8.2 (PROC MIXED) for a<br />
factorial design (SAS, 1999) with repeated measures. The model for <strong>the</strong>se repeated measures<br />
included <strong>the</strong> fixed effects <strong>of</strong> stage <strong>of</strong> lactation, supplementation treatment, test date and <strong>the</strong>ir<br />
two- and three-way interactions, and <strong>the</strong> random effects <strong>of</strong> ewe and <strong>the</strong> residual. The general<br />
linear model procedure <strong>of</strong> SAS (PROC GLM) was used to analyze DMI and <strong>the</strong> total trial period<br />
production <strong>of</strong> milk, fat, protein, FCM and FPCM, and percentage <strong>of</strong> fat and protein. The model<br />
included <strong>the</strong> effects <strong>of</strong> stage <strong>of</strong> lactation, supplementation treatment, <strong>the</strong>ir interaction, and <strong>the</strong><br />
residual. All means presented are least squares means, and significance is declared at P < 0.05<br />
unless o<strong>the</strong>rwise noted. Forage CP was related to MUN using <strong>the</strong> correlation procedure <strong>of</strong> SAS<br />
(PROC CORR).<br />
Results and Discussion<br />
Milk production and composition. Figure 1 presents average test day milk yields for each<br />
<strong>of</strong> <strong>the</strong> four stages <strong>of</strong> lactation and supplementation treatment combinations. On <strong>the</strong> first test day,<br />
59
2 d before <strong>the</strong> start <strong>of</strong> <strong>the</strong> supplementation treatments, average milk production for<br />
supplementation treatments within each stage <strong>of</strong> lactation was similar (P > 0.10). In <strong>the</strong> analyses<br />
<strong>of</strong> test day milk yield, milk fat percentage and milk protein percentage, none <strong>of</strong> <strong>the</strong> two-way or<br />
three-way interactions were statistically significant. Therefore, <strong>the</strong> least squares means within<br />
test days for <strong>the</strong>se three traits by <strong>the</strong> main effects <strong>of</strong> stage <strong>of</strong> lactation and supplementation<br />
treatment are plotted in Figures 2, 3 and 4, respectively. Least squares means, averaged over test<br />
days, are presented in Table 2.<br />
Figure 1: Average test day milk production for stage <strong>of</strong> lactation and supplementation<br />
treatment combinations.<br />
Milk (kg/d)<br />
3<br />
2.5<br />
2<br />
1.5<br />
1<br />
0.5<br />
0<br />
-2 5 12 19 26 33 40 47 54 61 68 75 82<br />
Day <strong>of</strong> trial<br />
60<br />
Early lactation - Supplemented<br />
Early lactation - Unsupplemented<br />
Late lactation - Supplemented<br />
Late lactation - Unsupplemented<br />
On each test day during <strong>the</strong> trial, early lactation ewes produced more milk than late lactation<br />
ewes and supplemented ewes produced more milk than unsupplemented ewes (Figure 2);<br />
however, none <strong>of</strong> <strong>the</strong> differences within a test day were statistically significant. When <strong>the</strong>se<br />
differences were averaged across test days, large and significant differences were observed<br />
between stage <strong>of</strong> lactation and between supplementation treatments (Table 2). Early lactation<br />
ewes produced more (P < 0.0001) daily milk (+ 0.53 kg), FCM (+ 0.36 kg), and FPCM (+ 0.34<br />
kg) than late lactation ewes. Since milk production generally peaks in <strong>the</strong> fourth week <strong>of</strong><br />
lactation and <strong>the</strong>n slowly declines (Carta et al., 1995), <strong>the</strong> early lactation ewes are expected to<br />
have <strong>great</strong>er daily milk yield than late lactation ewes.<br />
Supplemented ewes produced more (P < 0.01) daily milk (+ 0.23 kg), FCM (+ 0.16 kg), and<br />
FPCM (+ 0.14 kg) than unsupplemented ewes (Table 2). This supports previous work in which<br />
supplementation increased milk production in lactating ewes (D’Urso et al., 1993). However, it<br />
is somewhat surprising that <strong>the</strong> response to supplementation was similar in ewes at both stages <strong>of</strong><br />
lactation. Cannas (2002) suggests that supplementation in late lactation may contribute more to<br />
an increase in body weight than milk production. Changes in body weight (Figure 5) somewhat<br />
support this <strong>the</strong>ory, but milk production also was positively affected by supplementation in late<br />
lactation ewes.
Table 2: Average test day milk production and milk composition <strong>of</strong> stage <strong>of</strong> lactation and<br />
supplementation treatments.<br />
Stage <strong>of</strong> lactation a Supplement level b<br />
Late Early No supplement Supplement<br />
n mean ± se n mean ± se P < n mean ± se n mean ± se P <<br />
Milk, kg 130 1.21 ± 0.05 598 1.74 ± 0.02 0.0001 364 1.36 ± 0.04 364 1.59 ± 0.04 0.0001<br />
Fat, % 60 5.80 ± 0.11 276 5.95 ± 0.05 0.2526 168 6.00 ± 0.09 168 5.75 ± 0.09 0.0539<br />
Protein, % 60 5.02 ± 0.05 276 4.86 ± 0.02 0.0057 168 5.04 ± 0.04 168 4.84 ± 0.04 0.0007<br />
FCM, kg 60 0.86 ± 0.05 276 1.22 ± 0.02 0.0001 168 0.96 ± 0.04 168 1.12 ± 0.04 0.0071<br />
FPCM, kg 60 0.85 ± 0.05 276 1.19 ± 0.02 0.0001 168 0.95 ± 0.04 168 1.09 ± 0.04 0.0073<br />
a Late lactation ewes are 136 ± 9 DIM, early lactation ewes 21 ± 10 DIM.<br />
b Supplement received 0.80 kg DM/d.<br />
Figure 2: Average test day milk production for stage <strong>of</strong> lactation and supplementation<br />
treatments.<br />
Milk (kg/d)<br />
Milk (kg/d)<br />
3<br />
2.5<br />
2<br />
1.5<br />
1<br />
0.5<br />
0<br />
3<br />
2.5<br />
2<br />
1.5<br />
1<br />
0.5<br />
0<br />
-2 5 12 19 26 33 40 47 54 61 68 75 82<br />
61<br />
Early lactation<br />
Late lactation<br />
-2 5 12 19 26 33 40 47 54 61 68 75 82<br />
Day <strong>of</strong> trial<br />
Supplemented<br />
Unsupplemented<br />
Late lactation ewes had a significantly higher milk fat percentage than early lactation ewes<br />
before <strong>the</strong> start <strong>of</strong> <strong>the</strong> trial, but <strong>the</strong> differences between stage <strong>of</strong> lactation treatments were not<br />
significant for any <strong>of</strong> <strong>the</strong> test days during <strong>the</strong> trial (Figure 3) or averaged over all test days (Table<br />
2). This contradicts previous work, in which milk fat percentage tends to increase throughout<br />
lactation as milk production decreases (Pulina, 2002).
Supplemented ewes had a lower milk fat percentage than unsupplemented ewes on all test<br />
days except day 82, and <strong>the</strong> difference was significant at days 12 and 26 (Figure 4). The<br />
substitution effect <strong>of</strong> a low-fiber supplement may have affected total NDF intake, leading to milk<br />
fat depression in supplemented ewes (Bencini and Pulina, 1997). Averaged over all test days,<br />
unsupplemented ewes had a higher (P < 0.05) milk fat percentage than supplemented ewes (6.00<br />
vs. 5.75 %, respectively), which may be related to <strong>the</strong>ir significantly lower milk production<br />
(Table 2).<br />
Figure 3: Average test day milk fat and milk protein percentages for stage <strong>of</strong> lactation<br />
treatments.<br />
Fat (%)<br />
Protein (%)<br />
7<br />
6<br />
5<br />
4<br />
7<br />
6<br />
5<br />
4<br />
*<br />
-2 12 26 40 54 68 82<br />
* *<br />
-2 12 26 40 54 68 82<br />
Day <strong>of</strong> trial<br />
* Least squares means within a test day are different (P < 0.05).<br />
62<br />
Late lactation<br />
Early lactation<br />
Late lactation<br />
Early lactation<br />
Milk protein percentage was higher (P < 0.05) on all test days except day 82 for late lactation<br />
ewes compared to early lactation ewes and significantly higher on days 12 and 26 (Figure 3).<br />
Averaged over all test days, late lactation ewes had a <strong>great</strong>er (P < 0.01) milk protein percentage<br />
than early lactation ewes (5.02 vs. 4.86 %, respectively). This supports previous reports in which<br />
milk protein percentage increases throughout lactation as milk production decreases (Cappio-<br />
Bolino et al., 1997). Milk protein percentage is less influenced by diet than milk fat percentage<br />
(Nudda et al., 2002) and shows less variation during <strong>the</strong> trial than milk fat percentage (Figures 3<br />
and 4). Unsupplemented ewes had a higher milk protein percentage than supplemented ewes on<br />
each test day (only significant on day 68; Figure 4), and <strong>the</strong> values averaged over tests days were<br />
significantly different (4.84 vs. 5.04 %, respectively; Table 2).
Figure 4: Average test day milk fat and milk protein percentages for supplementation<br />
treatments.<br />
Fat (%)<br />
Protein (%)<br />
7<br />
6<br />
5<br />
4<br />
7<br />
6<br />
5<br />
4<br />
*<br />
*<br />
*<br />
-2 12 26 40 54 68 82<br />
-2 12 26 40 54 68 82<br />
Day <strong>of</strong> trial<br />
* Least squares means within a test day are different (P < 0.05).<br />
63<br />
Unsupplemented<br />
Supplemented<br />
Unsupplemented<br />
Supplemented<br />
Estimated total milk production over <strong>the</strong> 82-d trial and average milk fat and milk protein<br />
percentage <strong>of</strong> <strong>the</strong> total milk produced is presented in Table 3. Early lactation ewes produced<br />
more (P < 0.01) milk (+ 41.3 kg), FCM (+ 39.0 kg), and FPCM (+ 37.3 kg) than late lactation<br />
ewes during <strong>the</strong> trial period. Ewes in both stages <strong>of</strong> lactation produced milk with a similar fat<br />
percentage, and early lactation ewes produced more (P < 0.01) milk fat than late lactation ewes<br />
(7.77 vs. 5.31 kg, respectively) due to <strong>the</strong> <strong>great</strong>er milk production. Late lactation ewes had a<br />
similar milk protein percentage compared to early lactation ewes, but <strong>the</strong>y produced less (P <<br />
0.01) total milk protein (4.61 vs. 6.27 kg, respectively) due to lower milk production.<br />
Even though supplemented ewes had <strong>great</strong>er mean values for total milk production than<br />
unsupplemented ewes (milk: + 19.7 kg; FCM: + 14.0 kg; FPCM: + 13.3 kg), <strong>the</strong> differences<br />
between supplementation treatments were not significantly different from zero (Table 3).<br />
Since supplemented ewes produced more (P < 0.01) milk than unsupplemented ewes (Table<br />
2) on individual test days, <strong>the</strong> lack <strong>of</strong> statistical significance between supplementation<br />
treatments for total milk production is probably due to <strong>the</strong> fewer number <strong>of</strong> observations for<br />
<strong>the</strong> latter trait. As in <strong>the</strong> case <strong>of</strong> total milk production, total fat and total protein production<br />
were <strong>great</strong>er for supplemented than unsupplemented ewes, but <strong>the</strong> differences were not<br />
statistically significant.<br />
*
Table 3: Total milk production and milk composition during <strong>the</strong> trial <strong>of</strong> stage <strong>of</strong> lactation<br />
and supplementation treatments.<br />
Stage <strong>of</strong> lactation a Supplement level b<br />
Late Early No supplement Supplement<br />
No. <strong>of</strong> ewes 10 46 28 28<br />
mean ± se mean ± se P < mean ± se mean ± se P <<br />
Milk, kg 95.6 ± 12.7 136.9 ± 5.9 0.0047 106.4 ± 9.9 126.1 ± 9.9 0.1672<br />
Fat % 5.58 ± 0.25 5.79 ± 0.12 0.4671 5.86 ± 0.20 5.50 ± 0.20 0.1983<br />
Fat, kg 5.31 ± 0.67 7.77 ± 0.31 0.0016 6.16 ± 0.52 6.91 ± 0.52 0.3141<br />
Protein % 4.80 ± 0.14 4.65 ± 0.06 0.3172 4.85 ± 0.12 4.60 ± 0.12 0.1033<br />
Protein, kg 4.61 ± 0.52 6.27 ± 0.24 0.0059 5.09 ± 0.41 5.80 ± 0.41 0.2254<br />
FCM, kg 85.9 ± 10.8 124.9 ± 5.0 0.0018 98.4 ± 8.4 112.4 ± 8.4 0.2401<br />
FPCM, kg 84.1 ± 10.3 121.4 ± 4.8 0.0020 96.4 ± 8.1 109.7 ± 8.1 0.2419<br />
a Late lactation ewes are 136 ± 9 DIM, early lactation ewes 21 ± 10 DIM.<br />
b Supplement received 0.80 kg DM/d.<br />
Pastures. Herbage availability in each paddock ranged from 854 to 2561 kg DM/ha with an<br />
average <strong>of</strong> 1504 kg DM/ha. Stocking rates were adjusted to allow for at least 2.84 kg DM/ewe/d.<br />
Post-grazing herbage allowance, measured once per week, was always <strong>great</strong>er than 4.24 kg<br />
DM/ewe, indicating that ewes had sufficient pasture DM available. Herbage mass per hectare<br />
and per ewe before grazing was highest at <strong>the</strong> beginning <strong>of</strong> <strong>the</strong> season and decreased towards <strong>the</strong><br />
end <strong>of</strong> <strong>the</strong> summer.<br />
The quality <strong>of</strong> available pasture remained high throughout <strong>the</strong> trial as a result <strong>of</strong> pasture<br />
management, which included intensive rotational grazing and clipping paddocks after grazing.<br />
Fiber and protein levels varied throughout <strong>the</strong> trial as a result <strong>of</strong> changes in pasture composition,<br />
including changes in <strong>the</strong> relative proportions <strong>of</strong> grass and legume. Pasture CP averaged 24.2 %<br />
but ranged from 16.6 to 30.6 %, and NDF averaged 36.0 % and ranged from 22.6 to 51.9 %<br />
(Table 4). The paddocks with <strong>the</strong> most kura clover and least orchardgrass had <strong>the</strong> highest CP<br />
and lowest NDF values, and <strong>the</strong> paddocks with <strong>the</strong> <strong>great</strong>est percentage <strong>of</strong> grass and <strong>the</strong> least kura<br />
clover had <strong>the</strong> lowest CP and highest NDF values.<br />
Table 4: Mean pasture quality measurements.<br />
n mean ± s.e.<br />
Neutral detergent fiber a 30 36.0 ± 9.1<br />
Crude protein a 30 24.2 ± 4.1<br />
Lignin b 3 3.2 ± 0.4<br />
Digestibility c 40 66.9 ± 4.3<br />
a Forage samples collected from May 25 to August 15.<br />
b Forage sample collected during fecal sampling period for dry matter intake estimation.<br />
c Calculated based on acid detergent lignin % <strong>of</strong> forage and individual ewe fecal sample.<br />
Intake estimates. Estimates <strong>of</strong> pasture DMI and total DMI are presented in Table 5.<br />
Pasture DMI was not significantly different between supplementation or stage <strong>of</strong> lactation<br />
treatments. Pasture DMI averaged 1.63 kg/d for unsupplemented ewes and 1.53 kg/d for<br />
supplemented ewes. Early lactation ewes consumed, on average, more pasture DM than late<br />
64
lactation ewes (1.66 vs. 1.50 kg/d, respectively). Total DMI <strong>of</strong> supplemented ewes was<br />
estimated by adding pasture DMI to <strong>the</strong> DM <strong>of</strong> grain <strong>of</strong>fered in <strong>the</strong> parlor (0.80 kg DM/d). This<br />
calculation led to a significant difference (P < 0.01) in total DMI between supplemented and<br />
unsupplemented ewes (2.33 vs. 1.63 kg/d, respectively). These results support a previous study<br />
<strong>of</strong> lactating ewes grazing pasture with a high forage allowance in which supplemented ewes<br />
consumed more organic matter than unsupplemented ewes (2.2 vs. 1.9 kg/d, respectively; Young<br />
et al., 1980). Total DMI was not significantly different between early and late lactation ewes<br />
(1.90 vs. 2.05 kg/d, respectively).<br />
Table 5: Pasture dry matter intake and total dry matter intake <strong>of</strong> stage <strong>of</strong> lactation and<br />
supplementation treatments.<br />
Stage <strong>of</strong> lactation a Supplement level b<br />
Late Early No supplement Supplement<br />
No. <strong>of</strong> ewes 18 17 18 17<br />
mean ± se mean ± se P < mean ± se mean ± se P <<br />
Pasture DMI, kg/d 1.50 ± 0.14 1.66 ± 0.14 0.4374 1.63 ± 0.14 1.53 ± 0.14 0.6350<br />
Total DMI, kg/d 2.05 ± 0.14 1.90 ± 0.14 0.4374 1.63 ± 0.14 2.33 ± 0.14 0.0011<br />
a Late lactation ewes are 136 ± 9 DIM, early lactation ewes 21 ± 10 DIM.<br />
b Supplement received 0.80 kg DM/d<br />
While <strong>the</strong> DMI estimates <strong>of</strong> this study are similar to <strong>the</strong> findings <strong>of</strong> Young et al. (1980), DMI<br />
<strong>of</strong> lactating <strong>dairy</strong> ewes is stated to reach 4 to 6 % <strong>of</strong> BW (Cannas, 2002). Estimates <strong>of</strong> both<br />
pasture DMI (1.3 % <strong>of</strong> BW) and total DMI (1.8 % <strong>of</strong> BW) in this study were below those stated<br />
by Cannas (2002), but his recommendations are based on ewes with much lower BW (Cannas,<br />
personal communication). The larger ewes in this trial may have a <strong>great</strong>er intestinal capacity and<br />
may consume less DM as a % <strong>of</strong> BW due to increased feed retention time and fiber utilization.<br />
Analysis <strong>of</strong> <strong>the</strong> supplemented and unsupplemented rations using <strong>the</strong> Cornell Net Carbohydrate<br />
and Protein System for Sheep (Cannas et al., 2003), predicted total DMI estimates higher than<br />
calculated DMI for both groups (supplemented 3.28 vs. 2.25 kg/d, unsupplemented 3.01 vs. 1.63<br />
kg/d, respectively), suggesting that <strong>the</strong> titanium dioxide procedure may have underestimated<br />
pasture DMI.<br />
The fecal recovery <strong>of</strong> <strong>the</strong> external marker may be affected by forage type (Judkins et al.,<br />
1990). Support for <strong>the</strong> use <strong>of</strong> TiO2 in <strong>sheep</strong> was demonstrated by <strong>the</strong> excretion pattern <strong>of</strong> TiO2<br />
and chromic oxide (Cr2O3) in <strong>sheep</strong> consuming bromegrass hay (Myers et al., 2006), which may<br />
have different recovery rates in ewes consuming <strong>the</strong> highly digestible kura clover- orchardgrass<br />
pastures used in this study. Myers et al. (2006) found that <strong>the</strong> concentration <strong>of</strong> TiO2 in <strong>the</strong> feces<br />
was consistently higher than Cr2O3, which may account for low estimates <strong>of</strong> fecal output and<br />
DMI. In addition, estimates <strong>of</strong> digestibility based on ADL may be affected by <strong>the</strong> low lignin<br />
content in <strong>the</strong> forage sample, which averaged 3.2%. Van Soest (1994) recommended using ADL<br />
to determine digestibility in forage samples above 5% lignin due to incomplete recovery.<br />
Body weight and body condition score. There was no significant interaction <strong>of</strong> stage <strong>of</strong><br />
lactation and supplementation treatment for body weight (BW) or body condition score (BCS).<br />
The main effects <strong>of</strong> stage <strong>of</strong> lactation and supplementation on BW, change in BW, and BCS are<br />
plotted in Figures 5, 6 and 7, respectively. There was no significant difference in average body<br />
65
weight <strong>of</strong> ewes between <strong>the</strong> supplementation treatments at <strong>the</strong> start <strong>of</strong> <strong>the</strong> trial. During <strong>the</strong> trial,<br />
supplemented ewes weighed, on average, more (P < 0.05) than unsupplemented ewes (86.4 vs.<br />
83.7 kg, respectively). Late lactation ewes were heavier (P < 0.05) than early lactation ewes at<br />
<strong>the</strong> start <strong>of</strong> <strong>the</strong> trial and maintained significantly <strong>great</strong>er BW for <strong>the</strong> whole trial, weighing an<br />
average <strong>of</strong> 88.1 kg and 81.9 kg, respectively. All treatment groups reached <strong>the</strong>ir lowest weight<br />
during <strong>the</strong> eighth week and gained weight for <strong>the</strong> last four weeks (Figure 6).<br />
Body condition score values generally reflected changes in BW; by <strong>the</strong> end <strong>of</strong> <strong>the</strong> trial,<br />
supplemented ewes had a higher BCS than unsupplemented ewes, and late lactation ewes had<br />
higher average BCS than early lactation ewes (Figure 7). However, <strong>the</strong> differences in BCS were<br />
not significant on any test day between supplementation or stage <strong>of</strong> lactation treatments.<br />
Between supplementation treatments, <strong>the</strong> difference between average BCS over <strong>the</strong> trial<br />
approached significance (P = 0.059), with supplemented ewes having a <strong>great</strong>er BCS than<br />
unsupplemented ewes.<br />
Figure 5: Average body weight <strong>of</strong> ewes in stage <strong>of</strong> lactation and supplementation treatments.<br />
Body weight (kg)<br />
Body weight (kg)<br />
95<br />
85<br />
75<br />
95<br />
85<br />
75<br />
*<br />
*<br />
* * * *<br />
0 2 4 6 8 10 12<br />
0 2 4 6 8 10 12<br />
Week in trial<br />
* Least squares means within a test day are different (P < 0.05).<br />
66<br />
Late lactation<br />
Early lactation<br />
Unsupplemented<br />
Supplemented
Figure 6: Average change in body weight relative to initial weight for ewes in stage <strong>of</strong> lactation<br />
and supplementation treatments.<br />
.<br />
Body weight change (kg)<br />
Body weight change (kg)<br />
0<br />
-4<br />
-8<br />
-12<br />
-16<br />
-20<br />
0<br />
-4<br />
-8<br />
-12<br />
-16<br />
-20<br />
2<br />
2<br />
4<br />
4<br />
6<br />
6<br />
67<br />
8<br />
8<br />
10<br />
10<br />
12<br />
12<br />
Early lactation<br />
Late lactation<br />
Supplemented<br />
Unsupplemented<br />
Figure 7: Average body condition score <strong>of</strong> ewes in stage <strong>of</strong> lactation and supplementation<br />
treatments.<br />
Average body condition score<br />
Average body condition score<br />
3.3<br />
3.1<br />
2.9<br />
2.7<br />
2.5<br />
-3 1 5 9<br />
3.3<br />
3.1<br />
2.9<br />
2.7<br />
Week <strong>of</strong> trial<br />
2 4 6 8 10 12<br />
* ** **<br />
* Least squares means within a stage <strong>of</strong> lactation treatment are different (P < 0.1).<br />
** Least squares means within a stage <strong>of</strong> lactation treatment are different (P < 0.05).<br />
Week in Trial<br />
2.5<br />
-3 1 5 9<br />
Week in trial<br />
Late lactation<br />
Early lactation<br />
Unsupplemented<br />
Supplemented
Milk urea nitrogen. Milk urea nitrogen (MUN) levels are closely related to blood urea<br />
nitrogen levels in <strong>sheep</strong> and can be used as an indicator <strong>of</strong> protein utilization (Cannas, 2002).<br />
There was no significant effect <strong>of</strong> stage <strong>of</strong> lactation or supplement level on MUN levels (P =<br />
0.96 and 0.41 respectively). Trial MUN values (Figure 8) tended to be higher than<br />
recommended levels for <strong>sheep</strong> (14 to 22 mg/dl; Cannas, 2002), indicating an excess <strong>of</strong> protein<br />
intake. This can be explained by <strong>the</strong> high quality pastures, which ranged in CP from 16 to 30 %.<br />
Figure 8: Milk urea nitrogen concentration for stage <strong>of</strong> lactation and supplementation<br />
treatment combinations.<br />
Milk urea nitrogen (mg/dl)<br />
35<br />
30<br />
25<br />
20<br />
15<br />
Early lactation - Supplemented Early lactation - Unsupplemented<br />
Late lactation - Supplemented Late lactation - Unsupplemented<br />
-2 12 26 40 54 68 82<br />
Day in trial<br />
The utilization <strong>of</strong> dietary protein depends both on protein and energy intake. Across all<br />
treatments, <strong>the</strong> correlation between pasture crude protein and MUN was 0.65. Within <strong>the</strong><br />
unsupplemented treatment, <strong>the</strong> correlation (0.78, R 2 = 0.61) was numerically higher, but not<br />
significantly different, than <strong>the</strong> correlation (0.52, R 2 = 0.27) within <strong>the</strong> supplemented treatment<br />
(Figure 9). Unsupplemented ewes were more dependent on pasture for both protein and energy<br />
than supplemented ewes so a higher correlation between pasture CP and MUN would be<br />
expected in unsupplemented ewes. Supplemented ewes had energy available from <strong>the</strong><br />
concentrate to utilize dietary protein, but <strong>the</strong> supplement also was 18 % CP, confounding <strong>the</strong><br />
effects <strong>of</strong> energy from <strong>the</strong> supplement on protein utilization from <strong>the</strong> pasture.<br />
Milk urea nitrogen analysis, commonly used in <strong>the</strong> United States, measures <strong>the</strong> concentration<br />
<strong>of</strong> nitrogen, which makes up approximately 46.66 % <strong>of</strong> <strong>the</strong> urea molecule. Milk urea nitrogen<br />
values can approximate <strong>the</strong> concentration <strong>of</strong> <strong>the</strong> total urea molecule, or milk urea (MU), which is<br />
<strong>the</strong> general analysis in European countries. Cannas (2002) developed a linear relationship<br />
between MU and CP (% <strong>of</strong> DM), based on studies with varying sources <strong>of</strong> protein, in which MU<br />
(mg/dl) = 4.5 CP - 38.9. In this trial, <strong>the</strong> regression equation generated from MUN data collected<br />
on <strong>the</strong> unsupplemented ewes is MU (mg/dl) = 3.43 CP – 21.24. Both equations give similar<br />
68
esults, so an average pasture CP value <strong>of</strong> 23 % corresponds to 64.6 and 57.0 mg/dl MU,<br />
respectively, or 30.1 and 26.6 mg/d MUN, respectively.<br />
Figure 9: Relationship between milk urea nitrogen and test day pasture crude protein for<br />
supplementation treatments.<br />
Milk urea nitrogen (mg/dl)<br />
35<br />
33<br />
31<br />
29<br />
27<br />
25<br />
23<br />
21<br />
19<br />
17<br />
15<br />
Supplemented<br />
R 2 = 0.27<br />
Unsupplemented<br />
R 2 = 0.61<br />
17 19 21 23 25 27<br />
Pasture crude protein (%)<br />
69<br />
Supplemented<br />
Unsupplemented<br />
These high MUN values in all treatments suggest that pasture protein content was<br />
sufficient to meet <strong>the</strong> nutritional requirements <strong>of</strong> <strong>the</strong> ewes. Additional energy in <strong>the</strong><br />
supplemented treatment did not improve <strong>the</strong> utilization <strong>of</strong> pasture protein, due to <strong>the</strong> protein<br />
content <strong>of</strong> <strong>the</strong> supplement. High MUN values have been associated with excess protein intake<br />
and low reproductive efficiency in Italian <strong>dairy</strong> ewes and Cannas (2002) suggests that ammonia<br />
detoxification may increase <strong>the</strong> energy requirements <strong>of</strong> ewes. In addition, providing<br />
supplemental protein to grazing ewes is expensive and, if unnecessary, will reduce farm<br />
pr<strong>of</strong>itability.<br />
Summary and Conclusions<br />
Total milk, fat, and protein production in grazing <strong>dairy</strong> ewes was higher for ewes in early<br />
compared to late lactation. Supplementation had a similar positive effect on daily milk yield <strong>of</strong><br />
grazing ewes in both early and late lactation when compared to <strong>the</strong> unsupplemented treatment.<br />
In <strong>the</strong> United States, <strong>sheep</strong> milk prices are currently based on milk quantity without regard to<br />
milk composition. Based on an average increase in milk production <strong>of</strong> 19.7 kg valued at<br />
$1.32/kg, and 0.82 kg <strong>of</strong> supplement provided for 82 days, as long as <strong>the</strong> supplement costs less<br />
than $ 0.39/kg (or $ 0.18/lb.), supplementation is pr<strong>of</strong>itable. While test day milk fat and milk<br />
protein percentages were significantly higher for unsupplemented ewes, <strong>the</strong> significant increase<br />
in test day milk production <strong>of</strong> supplemented ewes resulted in <strong>great</strong>er total milk fat and milk<br />
protein with supplementation. Pasture DMI was not significantly affected by stage <strong>of</strong> lactation<br />
or supplementation, but early lactation and supplemented ewes did consume numerically higher<br />
kg <strong>of</strong> pasture DM than late lactation and unsupplemented ewes, respectively, suggesting <strong>the</strong><br />
ability <strong>of</strong> ewes to regulate intake to meet production requirements. Milk urea nitrogen values<br />
suggested that rotationally grazed, mixed grass-legume pastures provided excess protein to
lactating ewes. The high protein and high energy supplement did not significantly improve <strong>the</strong><br />
utilization <strong>of</strong> pasture protein, suggesting <strong>the</strong> need for future research on supplementation with a<br />
feedstuff high in energy and lower in protein.<br />
References<br />
Berger, Y. M., and D. L. Thomas. 2004. Milk testing, calculation <strong>of</strong> milk production, and<br />
adjustment factors. Pages 55-62 in Proc. 10 th Annual Great Lakes Dairy Sheep Symp. Univ.<br />
Wisconsin, Madison.<br />
Bencini, R. and G. Pulina, 1997. The quality <strong>of</strong> <strong>sheep</strong> milk: A review. Aust. J. Exp.Agric.<br />
37:485-504.<br />
Bransby, D. I., A. G. Matches, and G. F. Krause. 1977. Disk meter for rapid estimation <strong>of</strong><br />
herbage yield in grazing trials. Agron. J. 69:393-396.<br />
Boundy, T. 1982. Body Condition Scoring <strong>of</strong> Sheep. Pages 22-24 in The Progressive Sheep<br />
Breeder. Shoreham, VT.<br />
Cannas, A. 2002. Feeding <strong>of</strong> lactating ewes. Pages 123-166 in Dairy Sheep Feeding and<br />
Nutrition. G. Pulina, ed. Avenue Media, Bologna, Italy.<br />
Cannas, A., A. Cabiddu, G. Bomboi, S. Ligios, and G. Molle. 2003. Effects <strong>of</strong> dietary non-fibre<br />
carbohydrates concentration on intake, in vivo digestibility and milk yield in Sarda ewes.<br />
Page 344 in Proc. 54th Int. Meet. EAAP, Rome, Italy. (Abstr.)<br />
Cappio-Borlino, A., B. Portolano, M. Todaro, N. P. Macciotta, P. Giaccone, and G. Pulina. 1997.<br />
Lactation curves <strong>of</strong> Valle del Belice <strong>dairy</strong> ewes for yields <strong>of</strong> milk, fat, and protein estimated<br />
with test day models. J. Dairy Sci. 80:3023-3029.<br />
Carta, A., S. R. Sanna, and S. Casu. 1995. Estimating lactation curves and seasonal effects for<br />
milk, fat and protein in Sarda <strong>dairy</strong> <strong>sheep</strong> with a test day model. Livest. Prod. Sci. 44:37-44.<br />
D’Urso, G., M. Avondo, and L. Biondi. 1993. Effects <strong>of</strong> supplementary feeding on grazing<br />
behavior <strong>of</strong> Comisana ewes in a Mediterranean semi-extensive production system. Anim.<br />
Feed Sci. Technol. 42:259-272.<br />
Food and Agriculture Organization <strong>of</strong> <strong>the</strong> United Nations. 2006. Subject: <strong>sheep</strong> milk cheese.<br />
http://www.fao.org/es/ess/toptrade/trade.asp. Accessed August 21, 2006.<br />
Judkins, M. B., L. J. Krysl, and R. K. Barton. 1990. Estimating diet digestibility : A comparison<br />
<strong>of</strong> 11 techniques across six different diets fed to rams. J. Anim. Sci. 68: 1405-1415.<br />
Milne, J. A., T. J. Maxwell, and W. Souter. 1981. Effect <strong>of</strong> supplementary feeding and herbage<br />
mass on <strong>the</strong> intake and performance <strong>of</strong> grazing ewes in early lactation. Anim. Prod. 32:185-<br />
189.<br />
Myers, W. D., P. A. Ludden, V. Nayigihugu, and B. W. Hess. 2004. Technical Note: A<br />
procedure for <strong>the</strong> preparation and quantitative analysis <strong>of</strong> samples for titanium dioxide. J.<br />
Anim. Sci. 82:179-83.<br />
Myers, W. D., P. A. Ludden, V. Nayigihugu, and B. W. Hess. 2006. Excretion patterns <strong>of</strong><br />
titanium dioxide and chromic oxide in duodenal digesta and feces <strong>of</strong> ewes. Small Rumin.<br />
Res. 63:135-41.<br />
Nudda, A., G. Battacone, R. Bencini, and G. Pulina. 2002. Nutrition and milk quality. Pages 197<br />
228 in Dairy Sheep Feeding and Nutrition. G. Pulina, ed. Avenue Media, Bologna, Italy.<br />
Penning, P. D., R. J. Orr, and T. T. Treacher. 1988. Responses <strong>of</strong> lactating ewes, <strong>of</strong>fered fresh<br />
herbage indoors and when grazing, to supplements containing different protein<br />
concentrations. Anim. Prod. 46:403-415.<br />
70
Pulina, G. 2002. Dairy Sheep Feeding and Nutrition. Avenue Media, Bologna, Italy.<br />
Pulina, G., A. Serre, A. Cannas, and G. Rossi. 1989. Determinazione e stima del valore<br />
energetico di latte di pecore di razza sarda. Pages 1867-1870 in Proc. XLIII Congress<br />
S.I.S.VET., Italy.<br />
Reis, R. B., and D. K. Combs. 2000. Effects <strong>of</strong> increasing levels <strong>of</strong> grain supplementation on<br />
rumen environment and lactation performance <strong>of</strong> <strong>dairy</strong> cows grazing grass-legume pasture. J.<br />
Dairy Sci. 83:2888-2898.<br />
Robertson, J. B., and P. J. Van Soest. 1981. The detergent system <strong>of</strong> analysis and its application<br />
to human foods. Pages 123-158 in The Analysis <strong>of</strong> Dietary Fiber Food. W. P. T. James and<br />
O. Theander, ed. Marcel Dekker, New York, NY.<br />
SAS. 1999. SAS/STAT. User’s Guide, Version 8.2 SAS Institute Inc., Cary, NC.<br />
Thomas, D.L. 2004. Overview <strong>of</strong> <strong>the</strong> <strong>dairy</strong> <strong>sheep</strong> sector in Canada and <strong>the</strong> United States. Pages<br />
166-177 in Proc. <strong>of</strong> <strong>the</strong> 10th Great Lakes Dairy Sheep Symp., Univ. Wisconsin, Madison.<br />
Van Soest, P. J. 1994. Nitrogen Metabolism. Pages 290-311 in Nutritional Ecology <strong>of</strong> <strong>the</strong><br />
Ruminant. Cornell University Press, Ithaca, NY<br />
Young, N. E., J. E. Newton, and R. J. Orr. 1980. The effect <strong>of</strong> a cereal supplement during early<br />
lactation on <strong>the</strong> performance and intake <strong>of</strong> ewes grazing perennial ryegrass at three stocking<br />
rates. Grass Forage Sci. 35:197-202.<br />
71
EFFECT OF PREPARTUM PHOTOPERIOD ON PROLACTIN<br />
AND MILK PRODUCTION OF DAIRY EWES<br />
Claire M. Mikolayunas 1 , David L. Thomas 1 , Yves M. Berger 2 , T. F. Gressley 3 , and<br />
G. E. Dahl 3<br />
Summary<br />
1 <strong>Department</strong> <strong>of</strong> <strong>Animal</strong> Sciences, 2 Spooner Agricultural Research Station,<br />
University <strong>of</strong> Wisconsin-Madison, Madison, Wisconsin, USA<br />
3 <strong>Department</strong> <strong>of</strong> <strong>Animal</strong> Science, University <strong>of</strong> Illinois, Urbana, Illinois, USA<br />
Increased photoperiod during lactation increases milk production in <strong>dairy</strong> cattle (Peters et al.,<br />
1978) and <strong>dairy</strong> ewes (Bocquier et al., 1997), but decreased prepartum photoperiod has a positive<br />
effect on subsequent milk production in <strong>dairy</strong> cattle (Auchtung et al., 2005). The objective <strong>of</strong> this<br />
study was to determine <strong>the</strong> effect <strong>of</strong> prepartum photoperiod on milk production, milk<br />
composition, and prolactin levels <strong>of</strong> 22 multiparous <strong>dairy</strong> ewes. Ewes exposed to short-day<br />
photoperiods (8 h light; SDPP) for approximately six weeks prepartum produced an average <strong>of</strong><br />
0.12 kg/d more milk (P < 0.10) on each test day over <strong>the</strong> first eight weeks <strong>of</strong> lactation than ewes<br />
exposed to long-day photoperiods (16 h light; LDPP). Average daily milk fat percentage was<br />
higher (P < 0.0001) in SDPP ewes than LDPP ewes (6.02 vs. 5.44 %, respectively). Average<br />
daily milk protein percentage was higher (P < 0.10) in SDPP ewes than LDPP ewes (4.55 vs.<br />
4.44 %, respectively). Due to both more daily milk and higher milk fat and milk protein<br />
percentages, SDPP ewes produced more 6.5 % fat corrected milk (FCM; + 0.21 kg/d; P < 0.05),<br />
and 6.5 % fat and 5.8 % protein corrected milk (FPCM; + 0.20 kg/d; P < 0.05) than LDPP ewes.<br />
Over approximately 121 days in milk, SDPP ewes produced more test day milk (P < 0.01) than<br />
LDPP ewes (1.68 vs. 1.48 kg/d, respectively), but <strong>the</strong>re were no differences in milk fat or protein<br />
percentages. Both treatments experienced a prolactin surge at lambing, but SDPP ewes had<br />
lower circulating prolactin (P < 0.05) than LDPP ewes from 7 d before to 0.5 d after lambing.<br />
Previous studies in <strong>dairy</strong> cattle also found that prepartum prolactin levels were inversely related<br />
to subsequent milk production. Decreased prepartum photoperiod may be important in increasing<br />
milk production in <strong>dairy</strong> ewes.<br />
Background<br />
Annual milk production <strong>of</strong> <strong>dairy</strong> ewes at <strong>the</strong> Spooner Agricultural Research Station increased<br />
from 1996 to 2004 (Berger, 2005). In an analysis <strong>of</strong> factors contributing to this progress, Berger<br />
noted effects <strong>of</strong> <strong>dairy</strong> genetics, breed composition and weaning system, findings supported by<br />
previous authors (Bencini and Pulina, 1997; McCusick et al., 2001). Some <strong>of</strong> <strong>the</strong> increase in<br />
milk production was attributed to leng<strong>the</strong>ning lactation due to lambing month. Lambing has<br />
gradually moved closer to January, and dry <strong>of</strong>f has remained in early fall, increasing <strong>the</strong> number<br />
<strong>of</strong> days ewes are lactating. In addition, ewes are milking during <strong>the</strong> increasing daylengths <strong>of</strong><br />
spring and summer and are likely responding to <strong>the</strong> known positive effects <strong>of</strong> increasing<br />
photoperiod during lactation on milk production (Bocquier et al., 1997). Lactating ewes exposed<br />
to long day photoperiods (16 h light; LDPP) for <strong>the</strong> first 5 months <strong>of</strong> lactation produced 25%<br />
more total milk than ewes exposed to short day photoperiods (8 h light; SDPP). At <strong>the</strong> end <strong>of</strong> <strong>the</strong><br />
72
light treatments, when all ewes were switched to equilibrated day lengths (12 h light), <strong>the</strong> LDPP<br />
ewes experienced a 37% decrease in milk production over <strong>the</strong> next six weeks while SDPP ewes<br />
only experienced an 8% decrease in milk production (Bocquier et al., 1997). A similar effect <strong>of</strong><br />
LDPP on established lactation has been observed in <strong>dairy</strong> cows over a range <strong>of</strong> production levels<br />
and stages <strong>of</strong> lactation (reviewed by Dahl et al., 2000).<br />
While <strong>the</strong>re is evidence that photoperiod affects milk production during lactation, recent<br />
studies in <strong>dairy</strong> cows have shown that prepartum photoperiod also affects mammary<br />
development and subsequent milk production. Cows experiencing short days during <strong>the</strong> dry<br />
period produced more milk than those exposed to long days. Milk production in short-day<br />
treated <strong>dairy</strong> cattle was 3.2 kg/d <strong>great</strong>er than long-day treated cattle during <strong>the</strong> first 16 weeks <strong>of</strong><br />
lactation, following a prepartum treatment period <strong>of</strong> 60 d (Miller et al., 2000). The proposed<br />
mechanism <strong>of</strong> action is <strong>the</strong> effect <strong>of</strong> photoperiod on circulating prolactin.<br />
Based on previous work on <strong>the</strong> interaction <strong>of</strong> prolactin and <strong>the</strong> mammary gland, <strong>the</strong>re is an<br />
inverse relationship between circulating prolactin levels and <strong>the</strong> expression <strong>of</strong> prolactin receptor<br />
mRNA in <strong>the</strong> liver, lymphocytes and mammary tissue <strong>of</strong> steers (Auchtung et al., 2003) and cows<br />
(Auchtung et al., 2005). Auchtung et al. (2005) found that cows in SDPP treatments for 60 d<br />
prepartum had lower levels <strong>of</strong> circulating prolactin than those in LDPP at both 33 and 5 days<br />
before calving. Prolactin returned to similar levels 2 days after calving. Cows experiencing<br />
SDPP also had increased expression <strong>of</strong> prolactin receptor mRNA. Thus, SDPP cows would be<br />
more sensitive to <strong>the</strong> natural periparturient prolactin surge, possibly experiencing enhanced<br />
proliferation and survival <strong>of</strong> mammary cells (Auchtung et al., 2005; Wall et al., 2005) due to <strong>the</strong><br />
critical role <strong>of</strong> prolactin in mammary gland development.<br />
During mammogenesis, prolactin promotes expansion <strong>of</strong> mammary ducts in rats (Akers,<br />
2002). The expansion <strong>of</strong> <strong>the</strong>se alveolar ducts is critical for complete development <strong>of</strong> <strong>the</strong><br />
mammary gland and maximization <strong>of</strong> milk producing surface area on secretory epi<strong>the</strong>lial cells.<br />
In <strong>sheep</strong>, when prolactin production is blocked for 30 days prepartum, ewes produce<br />
significantly less milk during <strong>the</strong> first two weeks <strong>of</strong> lactation than untreated ewes (Hooley et al.,<br />
1978). Prolactin is thought to play a role in <strong>the</strong> commitment <strong>of</strong> mammary cells to produce milk,<br />
and manipulation <strong>of</strong> <strong>the</strong> signaling to <strong>the</strong>se cells through prolactin mRNA may affect <strong>the</strong> number<br />
<strong>of</strong> cells available for milk production.<br />
Initial analysis <strong>of</strong> prepartum prolactin levels in <strong>dairy</strong> <strong>sheep</strong> have found prepartum responses<br />
to photoperiod. Pregnant ewes (90 days in gestation) exposed to LDPP had higher prepartum<br />
plasma prolactin levels than ewes exposed to SDPP after 30 days <strong>of</strong> light treatment (Perier et al.,<br />
1986). Bassett (1992) found this difference in prolactin levels after three weeks <strong>of</strong> light<br />
treatment, but found no difference in growth <strong>of</strong> lambs nursing ewes in each photoperiod<br />
treatment. While this study noted an increase in udder size <strong>of</strong> long day ewes, this was<br />
substantially influenced by <strong>the</strong> number <strong>of</strong> fetuses, with larger udders found in ewes bearing two<br />
or more fetuses and may not have been affected by photoperiod. This study was conducted to<br />
determine <strong>the</strong> effect <strong>of</strong> pre-lambing photoperiod on circulating prolactin, milk production and<br />
milk composition in <strong>dairy</strong> ewes.<br />
73
Methods and Materials<br />
The study was conducted at <strong>the</strong> University <strong>of</strong> Wisconsin-Madison campus and all procedures<br />
were approved by <strong>the</strong> <strong>Animal</strong> Care and Use Committee <strong>of</strong> <strong>the</strong> College <strong>of</strong> Agriculture and Life<br />
Sciences. Twenty-two multiparous, 4-yr-old <strong>dairy</strong> ewes were randomly assigned to one <strong>of</strong> two<br />
photoperiod treatments: LDPP (16 h light; 8 h dark; n=11) or SDPP (8 h light; 16 h dark; n=11).<br />
Previous year’s mean milk production was not significantly different between ewes on <strong>the</strong> SDPP<br />
and LDPP treatments (123.5 vs. 117.6 kg, respectively). Previous year’s milk fat and milk<br />
protein percentages also were not significantly different between SDPP and LDPP treatment<br />
groups (5.2 vs. 5.0 % fat, respectively; 4.3 vs. 4.2 % protein, respectively).<br />
Photoperiod treatments began approximately 6 wk before lambing. Ewes were housed in a<br />
climate controlled environment (17° C and 30 to 70 % relative humidity). Light exposure<br />
averaging 365 lux at <strong>sheep</strong>-eye level (0.76 m above <strong>the</strong> floor) was provided by fluorescent lights<br />
and controlled by an automatic timer. Lights were turned on at 0700 h daily and turned <strong>of</strong>f at<br />
1500 h and 2300 h for <strong>the</strong> SDPP and LDPP treatments, respectively. Following parturition,<br />
lambs were removed within 12 h <strong>of</strong> lambing. Ewes were moved from photoperiod treatment<br />
rooms to <strong>the</strong> milking room, where all ewes were managed toge<strong>the</strong>r and experienced a<br />
photoperiod <strong>of</strong> 12 h light and 12 h dark. Four SDPP ewes experiencing ho<strong>of</strong> problems related to<br />
<strong>the</strong> flooring in <strong>the</strong> light treatment rooms were moved to <strong>the</strong> milking room 6 to 9 days prior to<br />
lambing and blood samples during this time period were removed from <strong>the</strong> analysis. Milk<br />
production data from <strong>the</strong>se ewes remained in <strong>the</strong> analyses.<br />
Pre- and post-lambing feeding consisted <strong>of</strong> ad libitum alfalfa silage and 0.9 kg/d <strong>of</strong> whole<br />
corn. Ewes had free access to minerals and water. Following parturition, ewes were milked<br />
twice per day, at 0700 h and 1700 h. On April 10, all ewes were moved to <strong>the</strong> Spooner<br />
Agricultural Research Station and integrated into <strong>the</strong> resident milking flock. During this posttrial<br />
period, all ewes received <strong>the</strong> same amount <strong>of</strong> silage and corn supplement. All ewes were<br />
moved to pasture on May 16 and continued to receive corn in <strong>the</strong> milking parlor. Silage feeding<br />
was discontinued while ewes were on pasture, but due to a summer drought, silage feeding was<br />
resumed in mid-summer.<br />
Table 1: Composition <strong>of</strong> alfalfa<br />
haylage fed to ewes during pregnancy<br />
and <strong>the</strong> trial period <strong>of</strong> lactation.<br />
Composition % <strong>of</strong> DM<br />
Crude protein 17.53<br />
Neutral detergent fiber 47.97<br />
Non-fiber carbohydrates 22.80<br />
Lignin 6.89<br />
Fat 3.20<br />
Data and sample collection. During <strong>the</strong> trial period on campus, daily milk production for<br />
individual ewes was measured twice weekly, using a graduated Waikato Goat Meter (Inter Ag,<br />
New Zealand) by combining <strong>the</strong> amount <strong>of</strong> milk obtained at an evening and subsequent morning<br />
milking. Weekly milk samples from <strong>the</strong> morning milking were analyzed for percentage fat and<br />
74
percentage protein (AgSource Milk Labs, Stratford, WI). Daily milk production, milk fat<br />
percentage and milk protein percentage were used to calculate 6.5 % fat corrected milk (FCM)<br />
and 6.5% fat and 5.8% protein corrected milk (FPCM), based on <strong>the</strong> following equations<br />
developed by Pulina et al. (1989):<br />
FCM = M (0.37 + (0.097 x F))<br />
FPCM = M (0.25 + (0.085 x F) + (0.035 x P))<br />
where:<br />
M = milk yield (kg) and F and P = fat and protein concentration (%), respectively.<br />
Estimated total trial milk production from lambing until April 10 was calculated based on <strong>the</strong><br />
equations <strong>of</strong> Berger and Thomas (2004). Due to <strong>the</strong> variation in lambing date, trial days in milk<br />
(DIM) ranged from 34 to 63 d and averaged 53 d. Once ewes returned to <strong>the</strong> Spooner<br />
Agricultural Station, monthly milk production and milk composition data were recorded through<br />
July 10. Total DIM ranged from 104 to 130 DIM and averaged 121 DIM. Test day values were<br />
used to estimate post-trial production <strong>of</strong> milk, fat, protein, FCM and FPCM (Berger and Thomas,<br />
2004). Post-trial percentage <strong>of</strong> fat and protein were calculated from estimates <strong>of</strong> total milk, total<br />
fat, and total protein produced.<br />
Blood samples (20 ml/ewe) were collected from each ewe between 0800 h and 1000 h via <strong>the</strong><br />
jugular vein twice weekly starting 6 weeks before lambing. Blood samples were collected into<br />
two 10ml, sterile evacuated tubes containing sodium heparin and immediately put on ice.<br />
Plasma was harvested by centrifugation at 1850 × g for 20 min at 4°C within 1 hr <strong>of</strong> collection.<br />
Plasma was stored at -20°C and analyzed using <strong>the</strong> PRL radioimmunoassay, as described by<br />
Miller et al. (1999).<br />
Statistical analysis. Statistical analyses were performed using SAS v.8.2 (1999). The<br />
PROC MIXED procedure was used to analyze test day milk production, milk composition, and<br />
prolactin concentrations; separately for <strong>the</strong> trial period and for <strong>the</strong> trial plus <strong>the</strong> post-trial period.<br />
The model for <strong>the</strong>se repeated measures included <strong>the</strong> fixed effects <strong>of</strong> photoperiod treatment, test<br />
number and <strong>the</strong>ir interaction, and <strong>the</strong> random effects <strong>of</strong> ewes and residual. The PROC GLM<br />
procedure was used to analyze total lactation milk, fat, and protein production during <strong>the</strong> trial<br />
plus <strong>the</strong> post-trial periods. The model included <strong>the</strong> effects <strong>of</strong> photoperiod treatment, test number,<br />
<strong>the</strong>ir interaction and <strong>the</strong> residual. Least squares means and standard errors <strong>of</strong> <strong>the</strong> means are<br />
reported. Significance was declared at P < 0.05 unless o<strong>the</strong>rwise noted.<br />
Results and Discussion<br />
Dairy ewes experiencing SDPP for six weeks prepartum produced more milk on most days <strong>of</strong><br />
<strong>the</strong> trial (Figure 1) than LDPP ewes, and <strong>the</strong> difference was significant (P < 0.1) on one test day.<br />
When averaged across all test days for <strong>the</strong> first eight weeks <strong>of</strong> lactation, SDPP ewes produced<br />
0.12 kg/d more milk (P < 0.1) than LDPP ewes (2.39 vs. 2.27 kg/d, respectively; Table 2).<br />
Average daily milk fat percentage was higher (P < 0.0001) in SDPP ewes than LDPP ewes (6.02<br />
vs. 5.44 %, respectively).<br />
75
Figure 1: Mean test day milk production <strong>of</strong> SDPP and LDPP treatments during <strong>the</strong> trial period.<br />
Number <strong>of</strong> ewes in each treatment for each test:<br />
Milk (kg)<br />
DIM 5 9 12 16 19 23 26 30 33 37 40 44 47 51 54 58<br />
SDPP 11 11 11 11 11 11 11 11 11 11 11 11 10 8 7 4<br />
LDPP 11 11 11 11 11 11 11 11 10 10 9 9 9 8 8 5<br />
2.7<br />
2.5<br />
2.3<br />
2.1<br />
1.9<br />
5 9 12 16 19 23 26 30 33 37 40 44 47 51 54 58<br />
Average days in milk<br />
* Least squares means within a test day are different (P < 0.1).<br />
*<br />
76<br />
SDPP<br />
LDPP<br />
Table 2: Average test day milk production and milk composition <strong>of</strong> prepartum light treatment<br />
groups during 12 h light:12 h dark during <strong>the</strong> trial period (n=11 in each treatment; total DIM<br />
ranged from 34 to 63 and averaged 53).<br />
SDPP<br />
LDPP<br />
mean ± se mean ± se P <<br />
Milk, kg/d 2.39 ± 0.051 2.27 ± 0.051 0.0895<br />
Fat, % 6.02 ± 0.102 5.44 ± 0.104 0.0001<br />
Protein, % 4.55 ± 0.045 4.44 ± 0.046 0.0943<br />
FCM, kg/d 2.29 ± 0.062 2.08 ± 0.063 0.0174<br />
FPCM, kg/d 2.21 ± 0.059 2.01 ± 0.060 0.0185<br />
Test day values for milk fat percentage were significantly different on three test days (Figure<br />
2). Average daily protein percentage was higher in SDPP ewes than LDPP ewes (4.55 vs. 4.44<br />
%, respectively, P < 0.1). Test day milk protein percentages were different on one test day<br />
(Figure 3). Due to both <strong>great</strong>er daily milk production and higher milk fat and protein<br />
percentages, SDPP ewes produced, on average, more FCM (+ 0.21 kg/d; P < 0.05), and FPCM<br />
(+ 0.20 kg/d; P < 0.05) than ewes exposed to long days prepartum (Table 2). Ewes that<br />
experienced short day photoperiods produced more FCM than LDPP ewes on each test day, and
<strong>the</strong> difference was significant on one test day (Figure 4). Fat and protein corrected milk<br />
followed a similar pattern but none <strong>of</strong> <strong>the</strong> test day values were significantly different between<br />
light treatments (Figure 5).<br />
Figure 2: Mean test day fat percentage <strong>of</strong> SDPP and LDPP treatments during <strong>the</strong> trial period.<br />
Number <strong>of</strong> ewes in each treatment for each test:<br />
Milk fat (%)<br />
6.5<br />
DIM 6 13 20 27 34 41 48 55<br />
SDPP 11 11 11 11 11 11 10 7<br />
LDPP 11 11 11 10 10 9 9 8<br />
6<br />
5.5<br />
5<br />
4.5<br />
Figure 3: Mean test day protein percentage <strong>of</strong> SDPP and LDPP treatments during <strong>the</strong> trial<br />
period. Number <strong>of</strong> ewes in each treatment for each test:<br />
DIM 6 13 20 27 34 41 48 55<br />
SDPP 11 11 11 11 11 11 10 7<br />
LDPP 11 11 11 10 10 9 9 8<br />
Protein (%)<br />
5.5<br />
5<br />
4.5<br />
4<br />
3.5<br />
** * *<br />
6 13 20 27 34 41 48 55<br />
Average days in milk<br />
* Least squares means within a test day are different (P < 0.1).<br />
** Least squares means within a test day are different (P < 0.01).<br />
6 13 20 27 34 41 48 55<br />
Average days in milk<br />
* Least squares means within a test day are different (P < 0.01).<br />
*<br />
77<br />
SDPP<br />
LDPP<br />
SDPP<br />
LDPP
Figure 4: Mean test day 6.5% fat corrected milk production <strong>of</strong> SDPP and LDPP treatments<br />
during <strong>the</strong> trial period.<br />
FCM (kg/d)<br />
2.7<br />
2.5<br />
2.3<br />
2.1<br />
1.9<br />
1.7<br />
6 13 20 27 34 41 48 55<br />
Average days in milk<br />
78<br />
SDPP<br />
LDPP<br />
Figure 5: Mean test day 6.5% fat and 5.8 % protein corrected milk production <strong>of</strong> SDPP and<br />
LDPP treatments during <strong>the</strong> trial period.<br />
FPCM (kg/d)<br />
2.5<br />
2.3<br />
2.1<br />
1.9<br />
1.7<br />
*<br />
* Least squares means within a test day are different (P < 0.1).<br />
6 13 20 27 34 41 48 55<br />
Average days in milk<br />
Average test day and total milk production and composition from each treatment, which<br />
includes data from both <strong>the</strong> trial period on campus and post-trial period at <strong>the</strong> Spooner<br />
Agricultural Research Station, are presented in Table 3. During this time, SDPP produced an<br />
average <strong>of</strong> 0.2 kg/d more milk (P < 0.01) than LDPP ewes (1.68 vs. 1.48 kg/d, respectively).<br />
While <strong>the</strong>re was no significant difference in average test day milk fat or protein percentages,<br />
SDPP ewes produced more FCM (+ 0.18 kg/d; P < 0.01), and FPCM (+ 0.17 kg/d; P < 0.01)<br />
than LDPP ewes. After approximately 121 DIM, SDPP ewes produced more total milk (+ 26.5<br />
SDPP<br />
LDPP
kg), fat (+ 3.0 kg), protein (+ 0.9), FCM (+ 29.5), and FPCM (+ 28.4) than LDPP ewes (Table 3).<br />
However, <strong>the</strong>se differences between treatments were not statistically significant (P > 0.20). This<br />
lack <strong>of</strong> significance may result from reduced statistical power in analyses <strong>of</strong> <strong>the</strong> data; total<br />
production traits had only one measurement per ewe while test day traits had multiple<br />
observations per ewe.<br />
Table 3: Average test day and total milk production and milk composition <strong>of</strong> prepartum light<br />
treatments during <strong>the</strong> trial and post-trial periods (n=11 in each treatment; total DIM ranged from<br />
104 to 130 and averaged 121).<br />
SDPP<br />
mean ± se<br />
79<br />
LDPP<br />
mean ± se<br />
Average<br />
Milk, kg/d 1.68 ± 0.046 1.48 ± 0.046 0.0027<br />
Fat, % 6.36 ± 0.114 6.51 ± 0.115 0.3527<br />
Protein, % 5.16 ± 0.065 5.17 ± 0.065 0.9120<br />
FCM, kg/d 1.65 ± 0.047 1.47 ± 0.047 0.0094<br />
FPCM, kg/d 1.62 ± 0.046 1.45 ± 0.047 0.0098<br />
Total, kg<br />
Milk 287.24 ± 16.1 260.72 ± 16.1 0.2580<br />
Fat 18.83 ± 1.08 15.81 ± 1.08 0.2019<br />
Protein 12.86 ± 0.88 11.95 ± 0.88 0.4748<br />
FCM 279.65 ± 16.0 250.11 ± 16.0 0.2067<br />
FPCM 272.75 ± 15.7 244.38 ± 15.7 0.2067<br />
The results <strong>of</strong> this study support previous work in which cows exposed to SDPP for 42<br />
(Velasco et al., 2006) or 60 d (Auchtung et al., 2005) prepartum produced more milk during <strong>the</strong><br />
first 16 wk <strong>of</strong> lactation than animals exposed to LDPP. In our study, however, milk fat and<br />
protein percentages also were different between treatment groups; this has not been observed in<br />
previous prepartum photoperiod trials with <strong>dairy</strong> cattle.<br />
Circulating prolactin levels were lower (P < 0.05) for SDPP ewes than for LDPP ewes from<br />
1wk before to 0.5 wk after lambing (Figure 6). These results support findings in <strong>dairy</strong> cattle, in<br />
which cows in SDPP treatments for 60 d prepartum had lower levels <strong>of</strong> circulating prolactin than<br />
those in LDPP at both 33 and 5 d before calving (Auchtung et al., 2005). In both studies,<br />
prolactin levels reached similar levels shortly after parturition.<br />
Work by Akers et al. (1981a) demonstrated “ that <strong>the</strong> secretion <strong>of</strong> prolactin at parturition<br />
stimulates subsequent milk production in <strong>dairy</strong> cows and that prolactin plays a critical role in<br />
mammary differentiation for key biochemical steps involved in <strong>the</strong> syn<strong>the</strong>sis <strong>of</strong> milk, especially<br />
those associated with lactose “. Therefore, a possible cascade <strong>of</strong> events to describe <strong>the</strong> effect <strong>of</strong><br />
prepartum photoperiod on milk production may be: 1) short photoperiod in prepartum ruminants<br />
results in decreased circulating prolactin levels, 2) decreased prolactin levels stimulate <strong>the</strong><br />
increased expression <strong>of</strong> mRNA for prolactin receptors, resulting in a <strong>great</strong>er number <strong>of</strong> prolactin<br />
receptors on mammary secretory epi<strong>the</strong>lial cells, 3) <strong>the</strong> natural increase in circulating prolactin at<br />
parturition stimulates complete differentiation and commitment <strong>of</strong> mammary secretory epi<strong>the</strong>lial<br />
cells to produce lactose, increasing milk production.<br />
P
Figure 6: Mean concentration <strong>of</strong> plasma prolactin in SDPP and LDPP ewes.<br />
Plasma prolactin (ng/ml)<br />
200<br />
160<br />
120<br />
80<br />
40<br />
0<br />
-6 -5 -4 -3 -2 -1 0 1<br />
Summary and Conclusions<br />
Week relative to lambing<br />
80<br />
LDPP<br />
SDPP<br />
Dairy ewes exposed to SDPP for approximately 6 weeks prepartum produced more milk than<br />
ewes exposed to LDPP. Short days prepartum resulted in a decrease in prepartum circulating<br />
prolactin levels, which may have contributed to increased sensitivity <strong>of</strong> <strong>the</strong> mammary gland to<br />
circulating prolactin and an increase in milk production in <strong>the</strong> subsequent lactation. This may<br />
have implications for <strong>dairy</strong> <strong>sheep</strong> flocks, most <strong>of</strong> which lamb once per year. Dairy ewes in late<br />
pregnancy during times <strong>of</strong> <strong>the</strong> year with shorter day length (i.e. winter) might be expected to<br />
produce more milk than ewes in late pregnancy during times <strong>of</strong> <strong>the</strong> year with longer day length<br />
(i.e. spring). Prepartum photoperiod may be one <strong>of</strong> <strong>the</strong> factors contributing to <strong>the</strong> increase in<br />
milk production <strong>of</strong> <strong>the</strong> Spooner Agricultural Research Station flock from 1996 to 2004 (Berger,<br />
2005).<br />
References<br />
* Least squares means within a test day are different (P < 0.05).<br />
** Least squares means within a test day are different (P < 0.001).<br />
Akers, R. M. 2002. Lactation and <strong>the</strong> mammary gland. Iowa State Press, Ames, IA.<br />
Akers, R. M., D. E. Bauman, A. V. Capuco, G. T. Goodman, and H. A. Tucker. 1981a. Prolactin<br />
regulation <strong>of</strong> milk secretion and biochemical differentiation <strong>of</strong> mammary epi<strong>the</strong>lial-cells in<br />
periparturient cows. Endocrinology. 109:23-30.<br />
Auchtung, T. L., P. E. Kendall, J. L. Salak-Johnson, T. B. McFadden, and G. E. Dahl. 2003.<br />
Photoperiod and bromacriptine treatment effects on expression <strong>of</strong> prolactin receptor mRNA<br />
in bovine liver, mammary gland and peripheral blood lymphocytes. J. Endocrinol. 179:347-<br />
356.<br />
**<br />
**<br />
**<br />
*
Auchtung, T. L., A. G. Rius, P. E. Kendall, T. B. McFadden, and G. E. Dahl. 2005. Effects <strong>of</strong><br />
photoperiod during <strong>the</strong> dry period on prolactin, prolactin receptor, and milk production <strong>of</strong><br />
<strong>dairy</strong> cows. J. Dairy Sci. 88:121-127.<br />
Bassett, J. M. 1992. Effects <strong>of</strong> additional lighting to provide a summer photoperiod for winterhoused<br />
pregnant ewes on plasma prolactin, udder development and lamb birthweight. J.<br />
Agric. Sci. 119:127-136.<br />
Bencini, R., and G. Pulina. 1997. The quality <strong>of</strong> <strong>sheep</strong> milk: A review. Austr. J. Exp. Agric.<br />
37:485-504.<br />
Berger, Y. M. 2005. Evolution <strong>of</strong> milk production at <strong>the</strong> Spooner Agricultural Research Station<br />
between 1996 and 2004. Pages 6-13 in Proc. 11 th Annual Great Lakes Dairy Sheep Symp.,<br />
Ithaca, NY.<br />
Berger, Y. M. and D. L. Thomas. 2004. Milk testing, calculation <strong>of</strong> milk production, and<br />
adjustment factors. Pages 55-62 in Proc. 10 th Annual Great Lakes Dairy Sheep Symp. ,<br />
Hudson, WI.<br />
Bocquier, F., S. Ligios, G. Molle, and S. Casu. 1997. Effet de la photopériode sur la production,<br />
la composition du lait et sur les consommations volontaires chez la brebis laitière. Ann.<br />
Zootech. (Paris). 46:427-438.<br />
Hooley, R. D., J. J. Campbell, and J. K. Findlay. 1978. The importance <strong>of</strong> prolactin for lactation<br />
in <strong>the</strong> ewe. J. Endocrinol. 79:301-310.<br />
McKusick, B. C., D. L. Thomas, and Y. M. Berger. 2001. Effect <strong>of</strong> weaning system on<br />
commercial milk production and lamb growth <strong>of</strong> East Friesian <strong>dairy</strong> <strong>sheep</strong>. J. Dairy Sci.<br />
84:1660-1668.<br />
Miller, A. R. E., R. A. Erdman, L. W., Douglas, and G. E. Dahl. 2000. Effects <strong>of</strong> photoperiod<br />
manipulation during <strong>the</strong> dry period <strong>of</strong> <strong>dairy</strong> cows. J. Dairy Sci. 83:962-967.<br />
Miller, A. R. E., E. P. Stanisiewski, R. A. Erdman, L. W. Douglas, and G. E. Dahl. 1999. Effects<br />
<strong>of</strong> long daily photoperiod and bovine somatotropin (Trobest ®) on milk yield in cows. J.<br />
Dairy Sci. 82:1716-1722.<br />
Perier, A., F. Bocquier, G. Kann, and J. Martinet. 1986. Influence de la photoperiode et des<br />
apports energetiques pendant la gestation sur les taus plasmatiques de la prolactine, de<br />
l’hormone de crossiance et de l’hormone placentaire lactogene puis sur la production laitiere<br />
de la brebis traite. Reprod. Nutr. Develop. 26:391-391. (Abstr.)<br />
Peters, R. R., L. T. Chapin, K. B. Leining, and H. A. Tucker. 1978. Supplemental lighting<br />
stimulates growth and lactation in cattle. Science. 199:911-912.<br />
Pulina, G., A. Serre, A. Cannas, and G. Rossi. 1989. Determinazione e stima del valore<br />
energetico di latte di pecore di razza sarda. Pages 1867-1870 in Proc. XLIII Congress<br />
S.I.S.VET., Italy.<br />
SAS. 1999. SAS/STAT. User’s Guide, Version 8.2 SAS Institute Inc., Cary, NC.<br />
Velasco, J. M., E. D. Reid, K. E. Karvetski, T. F. Gressley, R. L. Wallace, and G. E. Dahl. 2006.<br />
Short day photoperiod increases milk yield in cows with a reduced dry period length. J.<br />
Anim. Sci. 84(Suppl. 1):147. (Abstr.)<br />
Wall, E. H., T. L. Auchtung, G. E. Dahl, S. E. Ellis, and T. B. McFadden. 2005. Exposure to<br />
short day photoperiod during <strong>the</strong> dry period enhances mammary growth in <strong>dairy</strong> cows. J.<br />
Dairy Sci. 88: 1994-2003.<br />
81
SHEEP BEHAVIOR AND ITS USE IN SHEEP MANAGEMENT<br />
Harold W. Gonyou<br />
Prairie Swine Centre and <strong>the</strong> University <strong>of</strong> Saskatchewan<br />
Saskatoon, Saskatchewan, Canada<br />
I am sure that we all stop now and again as we are working with our animals and just<br />
watch as <strong>the</strong>y play, fight, groom <strong>the</strong>mselves or eat. <strong>Animal</strong> behavior is an interesting part <strong>of</strong><br />
raising animals. Behavior is also studied, not for amusement or idle curiosity, but to find ways to<br />
improve how we care for our animals. There are a number <strong>of</strong> different ‘fields’ <strong>of</strong> behavior that<br />
have developed, each <strong>of</strong> which has a major emphasis behind it. In this paper on <strong>the</strong> behavior <strong>of</strong><br />
<strong>sheep</strong>, I will use examples from three <strong>of</strong> <strong>the</strong>se fields: psychology, ethology, and behavioral<br />
ecology. There is a fair amount <strong>of</strong> overlap among <strong>the</strong>se fields, even to <strong>the</strong> point that some <strong>of</strong> my<br />
examples would be classified differently by o<strong>the</strong>rs. But <strong>the</strong> basic question is, “What behavior<br />
works well for an animal in a particular situation?”<br />
Psychology: Learning<br />
The study <strong>of</strong> learning has been closely associated with <strong>the</strong> field <strong>of</strong> psychology. In most<br />
learning situations an animal must link <strong>the</strong> performance <strong>of</strong> a behavior with its outcome. You<br />
may have had <strong>sheep</strong> that learned to lift <strong>the</strong> latch on a gate, resulting in <strong>the</strong>ir being able to escape<br />
from <strong>the</strong> yard or pen. This was used in New Zealand as a means to move <strong>sheep</strong> through <strong>the</strong><br />
various holding pens at <strong>the</strong> slaughter plant. One <strong>sheep</strong>, that was not to be slaughtered, was<br />
trained to open gates and move through <strong>the</strong> pens and eventually escaped through a final gate to<br />
obtain a food reward. The o<strong>the</strong>r <strong>sheep</strong> would calmly follow, and find <strong>the</strong>mselves next to <strong>the</strong><br />
stunning pen (Bremmer et al., 1980).<br />
Ano<strong>the</strong>r form <strong>of</strong> learning involves food selection. Most learning requires an immediate<br />
result for <strong>the</strong> animal to make <strong>the</strong> connection between its behavior and <strong>the</strong> outcome. However, it<br />
was recognized that animals would learn to avoid certain foods if <strong>the</strong>y caused sickness, even if<br />
<strong>the</strong> effect wasn’t apparent for several hours. This ‘aversive conditioning’ was seen as a means<br />
for animals to avoid poisonous plants. Fred Provenza, at Utah State University, began his study<br />
<strong>of</strong> food selection in <strong>sheep</strong> looking at <strong>the</strong> avoidance <strong>of</strong> toxic plants. He <strong>the</strong>n shifted his attention<br />
to <strong>the</strong> selection <strong>of</strong> o<strong>the</strong>r foods based on <strong>the</strong> positive experiences <strong>the</strong> animals had with <strong>the</strong>m.<br />
Based on <strong>the</strong>ir post-ingestive feedback, that is, <strong>the</strong> feelings <strong>the</strong> food created in <strong>the</strong> animal as it<br />
was digested, he has studied how <strong>sheep</strong> select a range <strong>of</strong> plant and feedstuffs to achieve a good<br />
nutrient balance (Provenza, 1995).<br />
Ethology<br />
The field <strong>of</strong> ethology studies <strong>the</strong> natural behavior <strong>of</strong> a species, and how this would have<br />
evolved. Applied ethology was seen as a means <strong>of</strong> improving <strong>the</strong> care <strong>of</strong> domestic animals by<br />
trying to accommodate <strong>the</strong>ir nature behavior. The adage ‘Fit <strong>the</strong> farm to <strong>the</strong> animal, not <strong>the</strong><br />
animal to <strong>the</strong> farm’ summarizes this approach. One <strong>of</strong> <strong>the</strong> most intriguing studies <strong>of</strong> <strong>the</strong> natural<br />
behavior <strong>of</strong> <strong>sheep</strong> was conducted on a small island <strong>of</strong>f <strong>the</strong> coast <strong>of</strong> Scotland. St. Kilda was <strong>the</strong><br />
82
site <strong>of</strong> a small settlement for several hundreds <strong>of</strong> years. The islanders made <strong>the</strong>ir living primarily<br />
from <strong>the</strong> sea birds that nested on <strong>the</strong> cliffs <strong>of</strong> <strong>the</strong> group <strong>of</strong> islands. They paid a small amount<br />
each year to <strong>the</strong> owners <strong>of</strong> <strong>the</strong> islands, in <strong>the</strong> form <strong>of</strong> fea<strong>the</strong>rs and oil from <strong>the</strong> birds. They ate<br />
large quantities <strong>of</strong> eggs and sea birds. But <strong>the</strong>y also had a few primitive <strong>sheep</strong>, from which <strong>the</strong>y<br />
obtained milk for cheese and wool for cloth. The settlement was abandoned in 1930, but a<br />
number <strong>of</strong> <strong>sheep</strong> were left on <strong>the</strong> main island. This population was studied, some 30 years later,<br />
and provides an interesting look at how <strong>sheep</strong> behave when fending for <strong>the</strong>mselves (Grubb and<br />
Jewell, 1966).<br />
The <strong>sheep</strong> on St. Kilda organized <strong>the</strong>mselves into two types <strong>of</strong> social groups. The ewes,<br />
<strong>the</strong>ir recent <strong>of</strong>fspring, and juvenile males formed groups <strong>of</strong> 25-35 individuals and would live on<br />
a particular area <strong>of</strong> <strong>the</strong> island. These ‘home ranges’ would be grazed by <strong>the</strong> same group year<br />
after year. The home ranges would overlap, but <strong>the</strong> groups <strong>of</strong> <strong>sheep</strong> did not intermingle in <strong>the</strong><br />
same area at <strong>the</strong> same time. The o<strong>the</strong>r type <strong>of</strong> social group was comprised <strong>of</strong> mature rams.<br />
These groups were smaller, but covered larger areas <strong>of</strong> <strong>the</strong> island. During rut <strong>the</strong> male groups<br />
would disperse, and individual rams would join <strong>the</strong> ewe groups for mating.<br />
This social pattern has several implications for managing domestic <strong>sheep</strong>. Ewes in large<br />
grazing areas maintain home ranges similar to those <strong>of</strong> <strong>the</strong> <strong>sheep</strong> on St. Kilda. Attempts to<br />
provide supplemental feed, an additional water source, or mineral blocks can be thwarted by <strong>the</strong><br />
<strong>sheep</strong>’s tenacity <strong>of</strong> not leaving <strong>the</strong>ir home range. If <strong>the</strong> manager doesn’t know which areas each<br />
group <strong>of</strong> <strong>sheep</strong> use, <strong>the</strong>n he may place <strong>the</strong> resources in places that one or more groups never<br />
visit.<br />
The seasonal nature <strong>of</strong> <strong>the</strong> sex-based flocks is also relevant to <strong>sheep</strong> management. In<br />
species with a seasonal separation <strong>of</strong> <strong>the</strong> sexes, we <strong>of</strong>ten see a ‘male effect’ when <strong>the</strong> males<br />
separate and join <strong>the</strong> females. The presence <strong>of</strong> <strong>the</strong> male may induce young females into puberty,<br />
induce older females out <strong>of</strong> a seasonal anestrous, or synchronize cycling among <strong>the</strong> females. We<br />
use rams, introduced to <strong>the</strong> ewes in early fall, to do all <strong>of</strong> <strong>the</strong>se in our normal management<br />
programs.<br />
Lambing season was ano<strong>the</strong>r time <strong>of</strong> <strong>the</strong> year when <strong>the</strong>re was some break up <strong>of</strong> social<br />
groups. As a ewe approached giving birth, it would separate from <strong>the</strong> flock. In many cases it<br />
would use a small storage hut, left by <strong>the</strong> former inhabitants, as a place to give birth. The ewe<br />
and her young lamb would rejoin <strong>the</strong> flock within <strong>the</strong> next couple <strong>of</strong> days. The use <strong>of</strong> a hut<br />
could have been as a means <strong>of</strong> protection from <strong>the</strong> wea<strong>the</strong>r, or protection from <strong>the</strong> remainder <strong>of</strong><br />
<strong>the</strong> ewes. In a series <strong>of</strong> studies in Australia, Justin Lynch was able to reduce lamb mortality by<br />
providing grass shelter belts in <strong>the</strong> lambing paddock. Ewes giving birth were attracted to <strong>the</strong>se<br />
protected areas to a <strong>great</strong>er extent than were non-parturient ewes (Lynch and Alexander, 1977).<br />
In my own work at Illinois, we demonstrated that ewes would move into cubicles placed around<br />
<strong>the</strong> periphery <strong>of</strong> <strong>the</strong> lambing barn just prior to giving birth, and that this protected <strong>the</strong>ir lambs<br />
from being stolen from o<strong>the</strong>r parturient ewes (Gonyou and Stookey, 1983).<br />
The period during which <strong>the</strong> ewe and her lamb were toge<strong>the</strong>r apart from <strong>the</strong> flock is <strong>the</strong><br />
time during which bonding occurs. The natural bonding behavior <strong>of</strong> ewes and lambs was used as<br />
a basis for testing <strong>the</strong> <strong>sheep</strong>’s sense <strong>of</strong> colour. Merino lambs, which are normally white, were<br />
83
painted various colours and left with <strong>the</strong>ir mo<strong>the</strong>rs for several days prior to <strong>the</strong> colour test. Ewes<br />
were <strong>the</strong>n given <strong>the</strong> choice <strong>of</strong> a lamb coloured <strong>the</strong> same as <strong>the</strong>ir own, or o<strong>the</strong>rs coloured in<br />
various shades <strong>of</strong> grey. Ewes were attracted to lambs that were <strong>the</strong> same colour as <strong>the</strong>ir own if<br />
<strong>the</strong>y were red, orange, yellow or white. However, if <strong>the</strong>ir lambs were blue or green, <strong>the</strong>y were as<br />
likely to be attracted to <strong>the</strong> grey shaded lambs. Thus, <strong>sheep</strong> have <strong>the</strong> ability to see red, but have<br />
difficulty with green or blue (Alexander and Stevens, 1979).<br />
Behavioral Ecology<br />
Behavioral ecology develops <strong>the</strong>ories that will predict how animals would behave under a<br />
particular set <strong>of</strong> circumstances. Often <strong>the</strong>se <strong>the</strong>ories relate to resources, such as food, and <strong>the</strong><br />
cost <strong>of</strong> obtaining <strong>the</strong>m. The <strong>sheep</strong> on St. Kilda normally did not give birth to a lamb until <strong>the</strong>y<br />
were two years old. When yearlings gave birth to a lamb it was almost always abandoned.<br />
Older ewes would also abandon lambs at birth, but only if <strong>the</strong> ewe was in poor body condition.<br />
Behavioral ecology <strong>the</strong>ories would predict that young or thin ewes would have insufficient body<br />
stores to successfully raise a lamb, maintain <strong>the</strong>mselves, and rebreed that following fall. In<br />
extreme cases, perhaps when <strong>the</strong> life <strong>of</strong> <strong>the</strong> ewe was in danger, <strong>the</strong> ewe would ‘cut her losses’<br />
and abandon <strong>the</strong> lamb without investing additional energy into it.<br />
A similar balance between available forage, milk production, and weaning was found in<br />
<strong>sheep</strong> by Arnold et al. (1979). If forage was plentiful, <strong>the</strong> ewe would be in good condition and<br />
produce a large amount <strong>of</strong> milk. Even though good forage was available, lambs were late to be<br />
weaned from <strong>the</strong>ir ewes. If forage was poor, ewes gave little milk, and lambs would wean early<br />
even though <strong>the</strong> grass was <strong>of</strong> low nutritional value. The timing <strong>of</strong> major energy costly events<br />
such as rearing, breeding and weaning is affected by <strong>the</strong> animal’s body condition and availability<br />
<strong>of</strong> feed.<br />
Conclusion<br />
The study <strong>of</strong> <strong>sheep</strong> behavior can be both interesting and practical. A number <strong>of</strong> our<br />
management practices are based on <strong>the</strong> behavior <strong>of</strong> <strong>sheep</strong>, reflecting <strong>the</strong>ir natural behavior or<br />
<strong>the</strong>ir ability to adapt to environmental conditions. Even under very intensive management it is<br />
important to consider <strong>the</strong> behavior <strong>of</strong> <strong>the</strong> animals.<br />
References<br />
Alexander, G and Stevens, D. 1979. Discrimination <strong>of</strong> colours and grey shades by Merino ewes:<br />
tests using coloured lambs. Appl. Anim. Ethol. 5:215-231.<br />
Arnold, GW, Wallace, SR and Maller, RA. 1979. Some factors involved in <strong>the</strong> natural weaning<br />
processes in <strong>sheep</strong>. Appl. Anim. Ethol 5:43-50.<br />
Bremner, KJ, Braggins, JB and Kilgour, R. 1980. Training <strong>sheep</strong> as leaders in abattoirs and farm<br />
<strong>sheep</strong> yards. Proc.N.Z.Soc.Anim. Prod. 40:111-116.<br />
Fisher, A and Mat<strong>the</strong>ws, L. 2001. The social behaviour <strong>of</strong> <strong>sheep</strong>. In (Ed.) Keeling, LJ and<br />
Gonyou, HW. Social Behaviour in Farm <strong>Animal</strong>s. Pp 211-245. CABI Publishing,<br />
Wallingford, UK.<br />
84
Gonyou, HW and Stookey, JM. 1983. Use <strong>of</strong> lambing cubicles and <strong>the</strong> behaviour <strong>of</strong> ewes at<br />
parturition. J. Anim. Sci. 56:787-791.<br />
Grubb, P and Jewell, PA. 1966. Social grouping and home range in feral Soay <strong>sheep</strong>. Symp.<br />
Zool. Soc. Lond. 18:179-210.<br />
Lynch, JJ and Alexander, G. 1977. Sheltering behaviour <strong>of</strong> lambing Merino <strong>sheep</strong> in relation to<br />
grass hedges and artificial wind breaks. Aust. J. Agric .Res. 28:691-701.<br />
Provenza, FD. 1995. Postingestive feedback as an elementary determinant <strong>of</strong> food preference<br />
and intake in ruminants. J. Range Manage. 48:2-17.<br />
85
CONTINUUM OF DAIRY OPERATIONS, PRODUCTS AND MARKETING<br />
STRATEGIES<br />
Alice Henriksen 1 and Laurel Kieffer 2<br />
1 Shepherd’s Pride Farm, Stillwater, Minnesota, USA<br />
2 Dream Valley Farm, Strum, Wisconsin, USA<br />
This session involves a panel discussion with three <strong>dairy</strong> <strong>sheep</strong> operators. All are making<br />
value-added products with <strong>the</strong>ir <strong>sheep</strong> milk. The purpose <strong>of</strong> <strong>the</strong> discussion is to share <strong>the</strong>ir stories<br />
behind <strong>the</strong> products <strong>the</strong>y chose to create and <strong>the</strong>ir marketing strategies including what worked<br />
and what didn’t work in <strong>the</strong>ir particular situation. They will start with a brief description <strong>of</strong> <strong>the</strong>ir<br />
operation and <strong>the</strong>n we will ask questions <strong>of</strong> <strong>the</strong> group about <strong>the</strong>ir products and marketing. At <strong>the</strong><br />
end, we will allow questions from <strong>the</strong> audience.<br />
Introductions:<br />
Panelists will share <strong>the</strong> following information about <strong>the</strong>mselves and <strong>the</strong>ir farm:<br />
• Number <strong>of</strong> <strong>sheep</strong> / number <strong>of</strong> ewes milked<br />
• Location <strong>of</strong> farm, how long farmed, type <strong>of</strong> production (natural, conventional, organic)<br />
• Labor – e.g. family, hired (if hired – source <strong>of</strong> employees)<br />
• Briefly describe all farm enterprises (how long for each)<br />
o Sheep based, o<strong>the</strong>r species, crops<br />
Questions:<br />
1. What products did you consider when deciding on <strong>the</strong> kinds <strong>of</strong> value added products to<br />
make?<br />
2. How did you decide which products to develop?<br />
3. What kinds <strong>of</strong> supports and expertise did you utilize? (examples – Grants, consultants)<br />
4. What method(s) <strong>of</strong> production do you incorporate? (examples - farmstead, contract)<br />
5. What marketing strategies did you explore? Decide on? Why?<br />
6. Where do you sell your product? (examples – direct sales, to retail, to wholesale,<br />
institutions, restaurants)<br />
7. What has and hasn’t worked along <strong>the</strong> way? Describe failures as well as successes.<br />
8. What barriers did / do you face?<br />
9. How does <strong>the</strong> specialty product fit into your whole farm pr<strong>of</strong>itability picture?<br />
10. Is value-added worth <strong>the</strong> extra effort? Why or why not?<br />
11. How do image and farm values impact success in marketing?<br />
12. How does geography, proximity to population centers and population demographics<br />
impact product marketing strategies?<br />
Additional questions to ask if time permits:<br />
• Do you / can you use frozen milk? How does it affect production?<br />
• Do you produce your product seasonally or year round?<br />
• Do you use your own milk only or do you purchase milk from o<strong>the</strong>r sources?<br />
• Do you co-market your product with o<strong>the</strong>r products / complimentary products (your own<br />
or o<strong>the</strong>rs products)?<br />
• Do you utilize discounts / coupons / promotions / volume discounts for your product?<br />
86
SHEPHERD’S DAIRY<br />
Kim Curtis<br />
Anselmo, Nebraska, USA<br />
Shepherd’s Dairy, Nebraska’s first Grade A <strong>dairy</strong>, was established in 1993. As one <strong>of</strong> <strong>the</strong><br />
founding members <strong>of</strong> WSDC, we have now been milking for 14 years. We began with a flock <strong>of</strong><br />
60 Polypay ewes. In 1996 we began improving production by importing East Freisan rams from<br />
Peter Welkerling (Canada). We have purchased Lacaune cross rams in recent years. Our flock<br />
average has increased from 1.7 lbs <strong>of</strong> milk for 60 days to an average <strong>of</strong> 4.5 lbs <strong>of</strong> milk per day<br />
for 220 days. Since we lamb in December/January, we begin milking in <strong>the</strong> winter months and<br />
feed <strong>the</strong> ewes corn/barley and <strong>dairy</strong> quality alfalfa for <strong>the</strong> milking season. We have kept pretty<br />
steady records <strong>of</strong> <strong>the</strong> milk production <strong>of</strong> our ewes since <strong>the</strong> beginning, taking milk weights every<br />
two weeks using metered jars. Ram lambs and replacement ewe lambs are kept on <strong>the</strong> mo<strong>the</strong>rs<br />
for one month. The mo<strong>the</strong>rs are kept with <strong>the</strong> lambs exclusively for <strong>the</strong> first 3 days and <strong>the</strong>n are<br />
put on <strong>the</strong> schedule <strong>of</strong> milking twice a day. Lambs are left with <strong>the</strong> ewes during <strong>the</strong> day but kept<br />
in a shed with creep feed at night. The lambs are approximately 35 lbs when weaned. The<br />
we<strong>the</strong>rs are sold at 3 days old to a farmer who bottle feeds <strong>the</strong>m and sells <strong>the</strong>m as feeders.<br />
In 1999 we started our own business <strong>of</strong> making soap from <strong>the</strong> <strong>sheep</strong> milk. To set us apart<br />
from o<strong>the</strong>r soap makers, all <strong>of</strong> our soaps are made in molds with a vintage/Victorian look. Sales<br />
have grown from selling locally to selling to about 300 stores nationwide. We have a web site,<br />
www.shepherds<strong>dairy</strong>.com, that is <strong>the</strong> instrument for most <strong>of</strong> our sales. We advertise in<br />
wholesale magazines, newspapers, radio, retail and wholesale markets and <strong>the</strong> internet.<br />
We have been able to streamline production <strong>of</strong> products so that we now have just two people<br />
employed, a secretary and Kim. At our peak we had 10 part time employees. The number <strong>of</strong><br />
products has increased to include Soap, Lotions, Milk Baths, and Bath Teas available in 10<br />
scents.<br />
87
Introduction<br />
MILKING EWES IN THE CENTER OF MEXICO<br />
Javier Pérez Rocha Malcher<br />
“Santa Marina” Farm<br />
El Marques, Querétaro, México<br />
Santa Marina Farm is a medium-sized farm providing organic products such as cheese and<br />
lambs. Our 350 ewes graze all <strong>the</strong> year thanks to our <strong>great</strong> wea<strong>the</strong>r and 40 hectares <strong>of</strong> irrigated<br />
fields.<br />
History<br />
Santa Marina farm is located 200 km north <strong>of</strong> Mexico City, at 2000 meters above sea level in<br />
a semi-desert region. This place has been in our family since early 1980´s, and we grew<br />
vegetables until 2003. Then we started to milk ewes. It’s important to note that we never had<br />
ewes before, but after my attendance at <strong>the</strong> 2003 Great Lakes Dairy Symposium at Cornell<br />
University at Ithaca, New York, we decided to start our milking operation. The tradition for<br />
<strong>sheep</strong> in Mexico is only for meat, and that’s why it was so difficult to start. There are only three<br />
o<strong>the</strong>r ewe milk producers in all Mexico; one <strong>of</strong> <strong>the</strong>m started in 1996 and <strong>the</strong> o<strong>the</strong>r started in<br />
2002.<br />
First we started with 60 black-faced cross ewes and a pure breed East Friesian ram. After<br />
that, we met a person who studied cheese making in France and had a little factory near our farm.<br />
He had experience in making many types <strong>of</strong> cheeses including aged cheeses from ewe milk. We<br />
started to milk <strong>the</strong> ewes right away, but <strong>the</strong> success was far away. These ewes produced, at that<br />
time, 200 milliliters per day per ewe, and it was very disappointing. Two months later one <strong>of</strong> <strong>the</strong><br />
guys who milked crossbred ewes (3/4 Friesian, 1/4 St. Croix) quit milking and sold his 200 ewes<br />
to us.<br />
These ewes performed better and had a longer lactation (250 days) with 600 milliliters per<br />
ewe per day on average. At <strong>the</strong> same time, we started to learn how to make cheeses. We<br />
continued to deliver all <strong>the</strong> milk to our friend in his cheese factory for him to produce <strong>the</strong> cheeses<br />
while we kept learning how to produce our own cheese. Right away we started to sell cheeses in<br />
many cities near ours including Mexico City. By <strong>the</strong> end <strong>of</strong> 2004, we had our own small cheese<br />
factory, and we got our organic certificate. This certificate gave us a bigger market to increase<br />
our sales.<br />
Right now we participate a lot in fairs and have many buyers looking for our cheeses. People<br />
are starting to be interested in buying ewes and rams to start milking.<br />
88
Breeds<br />
As I stated above, we started with <strong>the</strong> black-face crosses, and right now we have none <strong>of</strong><br />
<strong>the</strong>m. Daughters <strong>of</strong> <strong>the</strong>m are milked at this time at <strong>the</strong> farm. A ewe that doesn’t produce at least<br />
100 liters a year is not pr<strong>of</strong>itable on our farm, and that’s why our original black-faces are done.<br />
With <strong>the</strong> arrival <strong>of</strong> <strong>the</strong> East Friesian crosses, we increased our production and improved our<br />
genetics, but <strong>the</strong> deception comes when we started to milk purebred East Friesian, because <strong>the</strong>y<br />
are not well adapted to our dry and hot wea<strong>the</strong>r, and <strong>the</strong>y start suffering from sunburn (ears, head<br />
and back) and pneumonia because <strong>of</strong> <strong>the</strong> difference in <strong>the</strong> temperature within <strong>the</strong> day and<br />
throughout <strong>the</strong> year. So we think at this time, that <strong>the</strong> solution is to have East Friesian crosses no<br />
more than 7/8 East Friesian along with 1/8 or more <strong>of</strong> any hair <strong>sheep</strong> breed well adapted to <strong>the</strong><br />
dry wea<strong>the</strong>r. Right now we imported semen <strong>of</strong> a Lacaune ram from Canada to start a new line to,<br />
hopefully, increase our milk quality and <strong>the</strong> health <strong>of</strong> <strong>the</strong> flock.<br />
The Process<br />
For milking, <strong>the</strong> ewes are brought in from <strong>the</strong> pasture and crowded into <strong>the</strong> holding area near<br />
<strong>the</strong> parlor.<br />
Our parlor is a twelve line with manual head gates. It has four milking units and two Waikato<br />
testing jars to measure <strong>the</strong> milk once a week.<br />
We have an insemination program <strong>of</strong> 30 ewes per month with a 65 % pregnancy rate with<br />
fresh semen all <strong>the</strong> year. After lambing, we take <strong>the</strong> lambs at 3 days from <strong>the</strong> mo<strong>the</strong>r and start to<br />
milk <strong>the</strong>m once a day. The lambs are fed artificially with milk lamb replacer three times at day<br />
for about 40 days or 15 kg. That’s when lambs are weaned and sold. Ewe lambs stay at <strong>the</strong> farm<br />
as replacements.<br />
The milk is kept in a bulk tank for two days, and after that is used to make cheeses. Cheeses<br />
are made three times a week and stored in a cave for 5 to 8 months. This cave controls <strong>the</strong><br />
temperature (12 C to 16 C) and humidity (70 % to 80 %). After that <strong>the</strong>y are ready for <strong>the</strong><br />
market.<br />
The price <strong>of</strong> that kind <strong>of</strong> cheese is between $22 to $30 U.S. Dollars for a kilogram. That<br />
makes a liter <strong>of</strong> milk, taking out <strong>the</strong> direct costs, worth $1.3 to $1.6 U.S. dollars.<br />
Goals and Plans<br />
Our goals for 2008 are to have 600 ewes in order to produce at least 150 liters <strong>of</strong> milk per<br />
ewe per year with an average <strong>of</strong> 18 % <strong>of</strong> solids and keep selling <strong>the</strong> cheeses.<br />
Our plans are to start making different type <strong>of</strong> cheeses.<br />
89
Conclusion<br />
This business in our country is going to grow more in <strong>the</strong> next few years. More people in<br />
México are getting interested in <strong>the</strong> consumption <strong>of</strong> <strong>sheep</strong> milk cheeses; especially <strong>the</strong> made in<br />
Mexico cheese - “our cheese”. People have tended to buy imported <strong>sheep</strong> milk cheese such as<br />
<strong>the</strong> Spanish types. We are <strong>the</strong> first organic <strong>sheep</strong> cheese producers in Mexico, and people will<br />
have <strong>the</strong> opportunity to eat fine Mexican <strong>sheep</strong> cheese.<br />
90
Summary<br />
ARTISAN SHEEP MILK CHEESE<br />
Jodi Ohlsen Read<br />
Shepherd’s Way Farms<br />
Nerstrand, Minnesota, USA<br />
Shepherd’s Way Farms, Sheep Dairy/Farmstead Cheese – Steven Read & Jodi Ohlsen Read<br />
Farming since 1994; Cheesemaking since 1998<br />
Products: 5 artisan <strong>sheep</strong> milk cheeses (two fresh, three aged – waxed and washed rind)<br />
Labor: Currently primarily family run; Designed to operate with 10-15 employees – 3-5 fulltime,<br />
7+ part-time.<br />
Background<br />
Shepherd’s Way Farms is located just outside Northfield, Minnesota, approximately one hour<br />
south <strong>of</strong> Minneapolis. Currently, we have 450 ewes, and this season will milk 350-400. Prior to<br />
2005, <strong>the</strong> flock was at 800 ewes and 500+ were milked.<br />
Shepherd’s Way Farms’ objective is to be a pr<strong>of</strong>itable family-based, value-added farm<br />
combining innovative technology, sustainable animal and land stewardship, holistic integration<br />
and community outreach. We use sustainable farming methods with cheese production on site.<br />
Dairy <strong>sheep</strong> and cheesemaking are <strong>the</strong> primary enterprises <strong>of</strong> Shepherd’s Way Farms. We have<br />
been making cheese since 1998 and have been at <strong>the</strong> current farm since 2001.<br />
Initially, we began Shepherd’s Way Farms to produce <strong>sheep</strong> milk to be sold through <strong>the</strong><br />
Wisconsin Dairy Sheep Co-operative. After our milk production increased beyond <strong>the</strong> pace <strong>of</strong><br />
contract fluid milk sales, we began our cheese market research. Through <strong>the</strong> research, we<br />
determined which styles <strong>of</strong> <strong>sheep</strong> milk cheese were in demand, which cheeses would directly<br />
compete, and how wholesale and retail pricing was structured. During this process we also<br />
established some early retailer relationships. After defining our audience and selecting <strong>the</strong> first<br />
cheese we wanted to make, we identified <strong>the</strong> necessary expertise and facilities to create an<br />
appropriate recipe and process.<br />
Friesago, an aged, waxed <strong>sheep</strong> milk cheese, was quickly well-received in <strong>the</strong><br />
Minneapolis/St. Paul retail and restaurant circles. We carefully paced our sales not to outrun our<br />
supply. Our second cheese, a fresh cheese – Shepherd’s Hope (originally called Queso Fresco),<br />
was introduced to complement <strong>the</strong> Friesago and also did well. Each type <strong>of</strong> cheese we have<br />
added was chosen to balance <strong>the</strong> variety <strong>of</strong> cheeses we <strong>of</strong>fer and to make best use <strong>of</strong> <strong>the</strong> milk,<br />
equipment and facilities, and cheesemaking skills available.<br />
91
Marketing and Sales<br />
Shepherd’s Way has established a presence in <strong>the</strong> specialty cheese market with a distinct<br />
product line, brand identity, and promotional strategy. Currently produced Shepherd’s Way<br />
Farms cheese has been easily absorbed by <strong>the</strong> existing demand – production is <strong>the</strong> only current<br />
limit on sales.<br />
The principles behind how we farm and how we make cheese are ultimately important to our<br />
target consumer. Consumers are looking for a connection to <strong>the</strong>ir food and to <strong>the</strong> people who<br />
make it. Providing that connection – through demos, print materials, and our story – is essential<br />
to developing a brand identity and customer loyalty.<br />
Shepherd’s Way Farms strives to sell products through outlets that represent and support <strong>the</strong><br />
mission <strong>of</strong> <strong>the</strong> farm – high quality, handcrafted foods, locally produced. We sell <strong>the</strong> majority <strong>of</strong><br />
our cheese within <strong>the</strong> Twin Cities area, with secondary markets in Chicago, Washington DC,<br />
Boston, and California.<br />
Initially, all sales were direct, wholesale, by <strong>the</strong> wheel. As production grew, we expanded<br />
sales to 70+ stores nationwide. At this level, a direct sale approach was not efficient; sales were<br />
refocused, a local distributor identified, and <strong>the</strong> Twin Cities area sales were increased. A small<br />
percentage <strong>of</strong> cheese is sold retail through a select Twin Cities farmer’s market and at our onfarm<br />
shop.<br />
Outlook<br />
American artisan cheeses are in <strong>great</strong> demand and <strong>the</strong> industry is growing rapidly.<br />
Consumers are already becoming savvier in <strong>the</strong>ir cheese selections and <strong>the</strong> cheese cases reflect<br />
<strong>the</strong> increased sophistication <strong>of</strong> taste. Consequently, some <strong>of</strong> <strong>the</strong> inherent obstacles for new<br />
artisan cheesemakers are becoming more manageable – equipment, expertise and training, and<br />
supporting resources are easier to identify and will likely continue to become more available.<br />
Shepherd’s Way Farms 8626 160 th Street East Nerstrand, MN<br />
farmfriends@earthlink.net 507-663-9040<br />
92
ACCURACY OF THE PORTASCC® MILK TEST FOR THE DETECTION OF<br />
SOMATIC CELLS IN SHEEP MILK<br />
Introduction<br />
Yves M. Berger<br />
Spooner Agricultural Research Station<br />
University <strong>of</strong> Wisconsin- Madison, Spooner, Wisconsin, USA<br />
Cheesemakers are more and more concerned about high somatic cell count in milk because<br />
<strong>of</strong> lower cheese yield and possible cheese flavor alteration. Many <strong>of</strong> <strong>the</strong>m are including financial<br />
premiums or penalties for milk with low or high somatic cell count. It is <strong>the</strong>refore important to<br />
be able to identify, quickly and accurately, animals that consistently have high somatic cell<br />
counts (indicators <strong>of</strong> chronic mastitis). Up to now <strong>the</strong> CMT (California Mastitis Test) was <strong>the</strong><br />
only animal side test available, but was <strong>of</strong>ten found to be inaccurate or insensitive. Recently,<br />
Portacheck (www.portacheck.com), a division <strong>of</strong> Portascience Inc., developed a quick,<br />
affordable on-farm somatic cell test for sub-clinical mastitis screening. This test could be an<br />
excellent management tool for <strong>dairy</strong> herds. No trial, however, has been performed to control <strong>the</strong><br />
accuracy <strong>of</strong> <strong>the</strong> test on <strong>sheep</strong> milk. During <strong>the</strong> course <strong>of</strong> <strong>the</strong> 2006 milking season, <strong>the</strong> Spooner<br />
Research Station tested <strong>the</strong> product for a possible application as part <strong>of</strong> its management routine.<br />
Description <strong>of</strong> <strong>the</strong> Product<br />
PortaSCC® consists <strong>of</strong> a strip (2.75 inch long, 5/8 inch wide, and 1/8 inch thick). At one end,<br />
<strong>the</strong>re is a small circular cut out forming a well. A drop <strong>of</strong> <strong>the</strong> milk to be tested is poured in <strong>the</strong><br />
well through a calibrated pipette included in <strong>the</strong> kit. Three drops <strong>of</strong> an activator solution are<br />
poured in <strong>the</strong> same well. Both, milk and solution are quickly absorbed by <strong>the</strong> material <strong>of</strong> <strong>the</strong><br />
strip. The test strip is allowed to dry for 45 minutes during which chemical reactions occur.<br />
Reading <strong>of</strong> <strong>the</strong> strip can be done ei<strong>the</strong>r by examination <strong>of</strong> <strong>the</strong> color changes in <strong>the</strong> well which<br />
gives a range <strong>of</strong> somatic cell counts ( 2<br />
million cells) or through a small hand held electronic reader for more accurate information. The<br />
test is easy to perform and does not require any special equipment<br />
Description <strong>of</strong> Tests Performed<br />
A total <strong>of</strong> 242 <strong>sheep</strong> milk samples were tested with <strong>the</strong> PortaSCC® according to<br />
manufacturer information at four different stages <strong>of</strong> <strong>the</strong> lactation. Ewes were chosen at random at<br />
each test.<br />
- 54 early lactation ewes on 2/21/06<br />
- 52 early-mid lactation ewes on 3/21/6<br />
- 18 ewes on 4/17/06 and 7 ewes on 4/20/06<br />
- 30 in mid lactation ewes on 5/30/06<br />
- 41 late lactation ewes on 8/22/06, repeated twice (2 different strips)<br />
93
At each test, <strong>the</strong> color changes were observed by two different persons in order to detect<br />
possible different color perception. The reading with <strong>the</strong> hand held device was also done twice at<br />
a few second intervals to measure <strong>the</strong> repeatability <strong>of</strong> <strong>the</strong> reader. All milk samples used in <strong>the</strong><br />
trial were sent to a certified laboratory were <strong>the</strong> somatic cell count in <strong>the</strong> milk was detected<br />
through a Fossomatic 360. The laboratory machine is not especially calibrated for <strong>sheep</strong> milk.<br />
Its accuracy, however, has been tested by comparing <strong>the</strong> results <strong>of</strong> a microscopic count<br />
(DMSCC) with <strong>the</strong> electronic count (ESCC). Results <strong>of</strong> <strong>the</strong> PortaSCC® were tested against <strong>the</strong><br />
results from <strong>the</strong> Fossomatic count.<br />
On 8/22/06 each sample <strong>of</strong> milk was tested twice at a few minute intervals on two different<br />
PortaSCC® strips in order to detect <strong>the</strong> repeatability.<br />
At each test we looked at:<br />
- <strong>the</strong> repeatability <strong>of</strong> <strong>the</strong> reading <strong>of</strong> color by two different persons<br />
- <strong>the</strong> accuracy <strong>of</strong> <strong>the</strong> color compared to <strong>the</strong> laboratory results using <strong>the</strong> same range<br />
- <strong>the</strong> accuracy <strong>of</strong> <strong>the</strong> hand held reader compared to <strong>the</strong> color<br />
- <strong>the</strong> accuracy <strong>of</strong> <strong>the</strong> hand held device compared to <strong>the</strong> laboratory results<br />
- <strong>the</strong> repeatability <strong>of</strong> <strong>the</strong> PortaSCC® on <strong>the</strong> same sample (last test only).<br />
The accuracy is simply a percentage <strong>of</strong> identical results between <strong>the</strong> Fossomatic and <strong>the</strong><br />
PortaSCC®. Repeatability is a percentage <strong>of</strong> identical results for 2 identical milk samples<br />
measured by PortaSCC®<br />
Results<br />
The 18 tests done on 4/17 and <strong>the</strong> 7 tests done on 4/20 were discarded from <strong>the</strong> results<br />
because <strong>the</strong> strips used on those dates were past <strong>the</strong> expiration date. All o<strong>the</strong>r results are shown<br />
in Table 1.<br />
Colors. The colors were generally perceived to be <strong>the</strong> same by two different people. The<br />
percentage <strong>of</strong> time that <strong>the</strong> two people had <strong>the</strong> same reading varied from 75% to 96%. The<br />
differences between <strong>the</strong> two technicians came mostly from hesitation between a no color change<br />
and a slight coloration meaning that <strong>the</strong> accuracy <strong>of</strong> <strong>the</strong> test is affected mostly in <strong>the</strong> low range <strong>of</strong><br />
SCC up to 200,000. This is quite an acceptable result knowing that an animal with a somatic cell<br />
count <strong>of</strong> 200,000 or less is considered as having a healthy udder (Bergonnier et al., 1997).<br />
Correlation between laboratory results and colors. All laboratory results that were less<br />
than 200,000 SC were considered 0 and corresponding to a no color change in <strong>the</strong> PortaSCC®<br />
test. The percentage <strong>of</strong> identical results between <strong>the</strong> laboratory and <strong>the</strong> colors shown in <strong>the</strong><br />
PortaSCC® varies between 81% and 94%. Most <strong>of</strong> <strong>the</strong> discrepancies occur in <strong>the</strong> middle ranges.<br />
Therefore, a no color change is definitively an indication <strong>of</strong> low SCC (less than 200,000) and a<br />
deep color change an indication <strong>of</strong> a high somatic cell count (more than 1 million). However <strong>the</strong><br />
PortaSCC® does not seem to give quite as accurate results for intermediary ranges (between<br />
200,000 and 1 million), meaning that it is less reliable to distinguish a count <strong>of</strong> 250,000 from a<br />
count <strong>of</strong> 750,000 just looking at <strong>the</strong> color on <strong>the</strong> strip. Also, <strong>the</strong> repeatability <strong>of</strong> <strong>the</strong> color change<br />
on <strong>the</strong> same sample <strong>of</strong> milk was high at 93%.<br />
94
Correlation between laboratory results and readings from <strong>the</strong> hand held device. The<br />
hand held device is easy to use, small and gives a quick digital reading. After calibrating <strong>the</strong><br />
device with a blank strip, <strong>the</strong> strips to be counted are introduced in a slot and read in a few<br />
seconds. Theoretically <strong>the</strong> numbers read (x 10 6 ) should correspond to <strong>the</strong> level <strong>of</strong> somatic cells<br />
per ml <strong>of</strong> milk. All laboratories results that were less than 200,000 SC were considered 0. Results<br />
show that <strong>the</strong> accuracy <strong>of</strong> <strong>the</strong> hand held device when compared to <strong>the</strong> Fossomatic results varies<br />
from 55% to 73%. The repeatability on <strong>the</strong> same sample was 66%. A high count detected by <strong>the</strong><br />
hand held device always corresponded to a high count detected by <strong>the</strong> Fossomatic counter, but a<br />
high count from <strong>the</strong> Fossomatic did not always correspond to a high count from <strong>the</strong> hand held<br />
reader.<br />
Correlation between colors and readings from <strong>the</strong> hand held device. The correlations<br />
varied between 61 and 77% with a repeatability <strong>of</strong> 61%. Those results have to be expected<br />
knowing that <strong>the</strong>re is not a very high correlation between lab results and color in <strong>the</strong><br />
intermediary ranges <strong>of</strong> somatic cells level.<br />
Conclusion<br />
The PortaSCC® appears to be a good tool for <strong>the</strong> detection <strong>of</strong> ei<strong>the</strong>r healthy ewes with<br />
no somatic cell or with a very low count (less than 200,000) and for <strong>the</strong> detection <strong>of</strong> chronic<br />
mastitis ewes with high somatic cell count (more than 1 million). However, for <strong>the</strong> doubtful ewes<br />
with intermediary ranges <strong>of</strong> somatic cell count (between 200,000 and 1 million) <strong>the</strong> PortaSCC®<br />
as tested in 2006 shows a low accuracy and repeatability. The hand held digital reader does not<br />
appear to add any accuracy because <strong>of</strong> what appears to be erratic readings in <strong>the</strong> middle range <strong>of</strong><br />
somatic cell level.<br />
In view <strong>of</strong> our results and <strong>of</strong> <strong>the</strong> results <strong>of</strong> <strong>the</strong> University <strong>of</strong> Nevada, PortaCheck has<br />
concluded that <strong>the</strong> enzyme activity <strong>of</strong> <strong>the</strong> white blood cell in <strong>sheep</strong>'s milk is about 4 times lower<br />
than <strong>the</strong> enzyme activity <strong>of</strong> <strong>the</strong> white blood cell in cow's milk (Personal communication,<br />
September 2006). To account for this difference a recalibration <strong>of</strong> <strong>the</strong> hand held reader will be<br />
necessary for direct reading <strong>of</strong> <strong>sheep</strong> milk somatic cells.<br />
Litterature cited<br />
Bergonier D., M.C. Blanc, B. Fleury, G. Lagriffoul, F. Barillet and X. Ber<strong>the</strong>lot. 1997. Les<br />
mammites des ovins et des caprins laitiers: étiologie, épidémiologi, contrôle. 4ème<br />
Rencontres autour des Recherches sur les Ruminants. Paris, December 4 and 5, 1997.<br />
Publication INRA- Institut de l’élevage.<br />
95
Table 1. Number and percentage <strong>of</strong> identical results between PortaSCC® and Fossomatic.<br />
Test<br />
n<br />
Color Fossomatic/Color Fossomatic/Reading Reading/Color<br />
Same No Same No Same No Same No<br />
2/21/06 54 40 14 51 3 30 24 39 15<br />
74% 94% 55% 72%<br />
3/2/06 52 50 2 42 10 38 14 37 15<br />
96% 81% 73% 71%<br />
5/30/06 30 25 5 27 3 22 8 23 7<br />
83% 90% 73% 77%<br />
8/22/06 1 41 35 6 35 6 28 13 25 16<br />
85% 85% 68% 61%<br />
8/22/06 2 41 37 4 36 5 30 11 33 8<br />
93% 88% 73% 80%<br />
Repeatability 1-2 90% 93% 66% 61%<br />
1, 2 Same samples tested at <strong>the</strong> same date on 2 different strips.<br />
96
CLOVER DALE SHEEP DAIRY<br />
John Henry and Mary Miller<br />
Westby, Wisconsin, USA<br />
Mary and I started milking cows in November <strong>of</strong> 1994. The first two years, we purchased all<br />
our feed. In 1997, we purchased our farm and continued milking cows until 2004.<br />
In 2004, we purchased 50 Polypay ewe lambs. We crossed <strong>the</strong>m with an East Friesian ram.<br />
The first two years, we just raised lambs, and I milked <strong>sheep</strong> for my neighbor, Dean Jensen. We<br />
also raised lambs for him.<br />
This year (2006), we started milking <strong>sheep</strong> on our own farm in March. We hand-milked our<br />
35 ewes on a rotating platform. The ewes have <strong>the</strong>ir head in a stanchion while <strong>the</strong>y are being<br />
milked. This system worked out very well for us. Mary, three <strong>of</strong> our boys, and I do <strong>the</strong> milking.<br />
We can milk 35 ewes in 35 minutes.<br />
Our goal is to milk 100 ewes by hand next year. For <strong>the</strong> first few years, we will select for<br />
long teats more than for <strong>the</strong> amount <strong>of</strong> milk. As far as I am aware <strong>of</strong>, we are <strong>the</strong> first commercial<br />
hand-milked <strong>sheep</strong> <strong>dairy</strong> in <strong>the</strong> U.S.<br />
We do all our farming with horses. We have 45 acres tillable, and we raise hay, corn, and<br />
barley and peas for silage.<br />
We have done a lot <strong>of</strong> fencing for our <strong>sheep</strong>. We hope to have enough pasture to rotationally<br />
graze 100 ewes. We graze our ewes from May through November. We <strong>the</strong>n feed hay and silage<br />
till lambing. After lambing, we add whole corn to <strong>the</strong> ewe’s ration. We buy a complete pellet<br />
feed for our lambs.<br />
Mary and I also make Bent Hickory furniture. We steam <strong>the</strong> hickory to bend it. We make<br />
rockers, footstools, kitchen chairs, bookshelves, and more.<br />
97
HIDDEN SPRINGS FARM AND CREAMERY<br />
Dean and Brenda Jensen<br />
Westby, Wisconsin, USA<br />
Brenda and Dean Jensen's Hidden Springs Farm is housed in a series <strong>of</strong> charming buildings,<br />
at <strong>the</strong> end <strong>of</strong> a winding road, perched on top <strong>of</strong> a high, beautiful, green ridge in <strong>the</strong> heart <strong>of</strong> <strong>the</strong><br />
Coulee, on <strong>the</strong> patchwork terrain <strong>of</strong> Wisconsin's "Driftless Area" - <strong>the</strong> perfect environment to<br />
raise <strong>sheep</strong> for <strong>the</strong>ir artisan/farmstead <strong>dairy</strong> products.<br />
Hidden Springs Farm is currently milking 115 Lacaune and East Friesian <strong>dairy</strong> <strong>sheep</strong>. The<br />
<strong>sheep</strong> graze seasonally. The farm's creamery has crafted a fresh s<strong>of</strong>t <strong>sheep</strong> milk cheese. It is very<br />
rich and creamy, almost dreamy, and named "Driftless Cheese" because it is made <strong>the</strong> "Driftless<br />
Area." (During <strong>the</strong> ice ages, all <strong>the</strong> glaciers passed it by, hence <strong>the</strong> "Driftless" name.)<br />
Hidden Springs Farm is situated in a heavily populated Amish family community. Brenda<br />
and Dean work closely with <strong>the</strong> Amish, and Dean serves as a community counselor, clinical<br />
<strong>the</strong>rapist and friend to <strong>the</strong>se folks. The Jensen's farm <strong>the</strong> old fashioned way, with draft power and<br />
no tractors or heavy equipment ...only Percheron draft horses. However, <strong>the</strong>ir <strong>dairy</strong> and milking<br />
parlor is a Grade A farm with completely modern, new equipment.<br />
Brenda left her management position in <strong>the</strong> corporate world to become <strong>the</strong> full-time Hidden<br />
Spring's cheesemaker/marketer, shepherd and gardener; investing her time in growing <strong>the</strong>ir<br />
farming business.<br />
Their vision for Hidden Springs Farm and Creamery is to be sustainable environmentally as<br />
well as financially: an all-natural, back-to-basics, old-fashioned, original farmstead approach to<br />
farming; crafting <strong>the</strong>ir food products, as well as <strong>the</strong>ir marketing. No GMO'S or antibiotics are<br />
used at Hidden Springs Farm.<br />
"Driftless Cheese" is made traditionally, using only natural products. Nothing is added to this<br />
natural product except fresh <strong>sheep</strong>'s milk, culture, rennet and salt. Please contact Brenda Jensen<br />
at 608-634-2521, Hidden Springs Creamery, Westby, Wl 54667<br />
(www.hiddenspring'screamery.com).<br />
98
CARR VALLEY CHEESE -<br />
WISCONSIN’S PREMIER SPECIALTY CHEESE FACTORY SINCE 1902<br />
Sid Cook<br />
Wisconsin Master Cheesemaker and Owner<br />
Carr Valley Cheese, La Valle, Wisconsin, USA<br />
Carr Valley Cheese is one <strong>of</strong> America’s finest specialty cheese plants, owned and<br />
operated by Wisconsin Master Cheesemaker, Sid Cook. A Wisconsin Master Cheesemaker<br />
is one who participates in a 15 year program achieving excellence in <strong>the</strong>ir trade. Sid is a<br />
fourth generation cheesemaker with 35 years <strong>of</strong> cheesemaking experience; his family has<br />
been making cheese for over 116 years.<br />
In <strong>the</strong> past four years, Carr Valley cheeses have won more than 90 top awards in U.S. and<br />
international competitions. Many <strong>of</strong> <strong>the</strong>se have been won by Sid’s one-<strong>of</strong>-a-kind American<br />
Originals—artisan cheeses you won’t find made anywhere else in <strong>the</strong> world. In addition to<br />
processing cow and goat milk, Carr Valley is <strong>the</strong> largest processor <strong>of</strong> <strong>sheep</strong> milk in Wisconsin.<br />
For more than 100 years, we’ve built our business on a unique blend <strong>of</strong> old-world<br />
craftsmanship and creative cheesemaking innovation. We think it’s a combination you’re<br />
going to love!<br />
99
100
101
102
We We We Welcome Welcome You You You to to <strong>the</strong> <strong>the</strong> 2006<br />
2006 Great Great Lakes Lakes<br />
Lakes<br />
Dairy Dairy Sheep Sheep Symposium!<br />
Symposium!<br />
Supplying top quality <strong>sheep</strong> milk for artisan and specialty cheeses and o<strong>the</strong>r<br />
distinctive <strong>dairy</strong> products since 1997.<br />
WSDC milk is produced on small farms in <strong>the</strong> north central US, with diligent attention<br />
to cleanliness, respect for <strong>the</strong> environment, and care for <strong>the</strong> well-being <strong>of</strong> our<br />
animals.<br />
Shipping Nationwide.<br />
Try our award-winning Dante, and our Mona <strong>sheep</strong> milk cheese!<br />
Cheese Makers: Want to try your hand with <strong>sheep</strong> milk? Contact Yves Berger at<br />
715/635-3735 or ymberger@facstaff.wisc.edu.<br />
For membership information: Contact Larry Meisegeier at 715/868-2285 or<br />
rrsf@brucetel.net.<br />
103<br />
www.<strong>sheep</strong>milk.biz
Raise your lambs easily and efficiently on milk replacer using one <strong>of</strong><br />
our automatic feeders and sell more <strong>of</strong> your valuable ewe milk.<br />
LAC-TEK<br />
• Feeds up to 60<br />
lambs<br />
• 25 lb milk<br />
powder hopper<br />
• 2 gallons water<br />
heater<br />
• Used at<br />
Spooner Ag.<br />
Research<br />
Station, WI<br />
Your bonus Iambs have gone through a lot. Separated from Mom. Not knowing where <strong>the</strong>ir next meal's<br />
coming from. That's where Ultra Fresh Lamb Milk Replacer comes in. Ultra Fresh is designed to help you<br />
save your bonus lambs by <strong>of</strong>fering an excellent alternative to <strong>the</strong> vital nutrients found in ewe's milk.<br />
Ultra Fresh gives your bonus lambs <strong>the</strong> freshness, consistency and palatability that's essential for proper<br />
nutrition and optimal health. Our exclusive Insta*Flake process makes Ultra Fresh easier to mix, helping<br />
keep its consistency and freshness for up to 48 hours. This helps preserve and maintain <strong>the</strong> health <strong>of</strong> your<br />
bonus lambs. And your bonus pr<strong>of</strong>its.<br />
Contact 1-866-253-8488 to locate a dealer near you.<br />
104<br />
NURSOMAT<br />
• Feeds up to 120<br />
lambs<br />
• 50 lb milk<br />
powder hopper<br />
• 5 gallons water<br />
heater<br />
BIOTIC INDUSTRIES, 147 Ebb Joyce Rd, BELL BUCKLE, TN 37020, US<br />
www.biotic.com, 931-437-2514<br />
For a Healthy, Frisky, Start on Life
Hudson Valley Camemberts<br />
Pure Sheep’s Milk Cheese<br />
100% Sheep’s Milk Yogurt<br />
Ricotta<br />
Ewe’s Blue<br />
Fresh Sheep’s Milk Cheese<br />
Feta<br />
Old Chatham Sheepherding Company<br />
105<br />
Our farm has purebred East Friesian rams<br />
for sale<br />
155 Shaker Museum Road<br />
Old Chatham, NY 12136<br />
888-743-3760 518-794-7733<br />
www.black<strong>sheep</strong>cheese.com
106
107
The University <strong>of</strong> Vermont<br />
Center for Sustainable Agriculture<br />
63 CARRIGAN DRIVE<br />
BURLINGTON, VERMONT 05405<br />
(802) 656-5459<br />
http://www.uvm.edu/~susagctr<br />
Home to <strong>the</strong><br />
Small Ruminant Dairy<br />
Project<br />
In collaboration with <strong>the</strong> University <strong>of</strong><br />
Vermont <strong>Department</strong> <strong>of</strong> <strong>Animal</strong> Science, we<br />
provide education and support to an<br />
increasing number <strong>of</strong> <strong>sheep</strong> and goat <strong>dairy</strong><br />
farmers in <strong>the</strong> state. Many <strong>of</strong> <strong>the</strong>se farmers<br />
produce premium farmstead cheeses for<br />
which <strong>the</strong>re is growing demand.<br />
Services include:<br />
• Technical assistance to Vermont <strong>dairy</strong><br />
<strong>sheep</strong> and goat farmers.<br />
• New England Dairy/Meat Goat and Dairy<br />
Sheep Directory.<br />
• Workshops on cheese making, animal<br />
health and nutrition, grazing, and more.<br />
• Business planning assistance.<br />
• Farmer-to-farmer networking through<br />
discussion groups and pasture walks.<br />
For more information, contact Carol Delaney,<br />
Small Ruminant Dairy Specialist, by phone at<br />
(802) 656-0915<br />
or by email at carol.delaney@uvm.edu.<br />
108<br />
PARLOR SYSTEMS<br />
FOR<br />
DAIRY GOATS AND<br />
SHEEP<br />
♦ 20 years experience<br />
constructing <strong>the</strong> best<br />
small ruminant parlors in<br />
North America<br />
♦ Parlors for farms from 12<br />
to 1200 or more milkers<br />
♦ Headgates, Aut<strong>of</strong>eeders,<br />
Platforms, Ramps, and<br />
Gates<br />
♦ US Made<br />
♦ We ship anywhere<br />
Please visit our website for more<br />
information, or contact us for a quote.<br />
Major Farm Parlor Systems<br />
Vermont Shepherd LLC<br />
875 Patch Rd, Putney, VT 05346<br />
www.vermontshepherd.com<br />
email:vtsheprd@sover.net<br />
Ph(802)387-4473<br />
Fax(802)387-2041
N681 Rollwood Road<br />
Antigo, WI 54409<br />
Email:eckermst@antigopro.net<br />
Personal, Farm, Business<br />
Payroll, Bookkeeping<br />
Free Electronic Filing<br />
Pr<strong>of</strong>essional – Reasonable – Reliable<br />
109<br />
Darlene Eckerman, E.A.<br />
Fax: 715-623-2520<br />
Phone: 715-623-2520<br />
Start Your Farm Business Off Right<br />
Contact Me For Your Business Needs and Tax help<br />
All 50 States
110<br />
Coming!<br />
Easy, Affordable, On-Farm<br />
Somatic Cell Test for<br />
SHEEP<br />
www.portacheck.com<br />
Toll Free: 866.500.7722<br />
DSANA – The Dairy Sheep<br />
Association <strong>of</strong> North America<br />
The organization promoting<br />
<strong>the</strong> interests <strong>of</strong> <strong>dairy</strong> <strong>sheep</strong><br />
producers and <strong>sheep</strong> milk<br />
processors in North America<br />
Join today at www.dsana.org