Preparing Teachers and Developing School Leaders for the 21st Century
Preparing Teachers and Developing School Leaders for the 21st Century
Preparing Teachers and Developing School Leaders for the 21st Century
You also want an ePaper? Increase the reach of your titles
YUMPU automatically turns print PDFs into web optimized ePapers that Google loves.
OECD<br />
O<strong>the</strong>r G20<br />
selected comparative data from oecd sources<br />
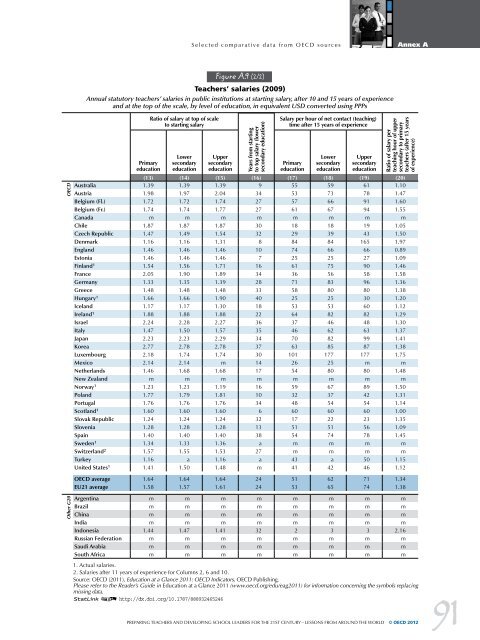
Figure A.9 (2/2)<br />
<strong>Teachers</strong>’ salaries (2009)<br />
Annual statutory teachers’ salaries in public institutions at starting salary, after 10 <strong>and</strong> 15 years of experience<br />
<strong>and</strong> at <strong>the</strong> top of <strong>the</strong> scale, by level of education, in equivalent USD converted using PPPs<br />
Primary<br />
education<br />
Ratio of salary at top of scale<br />
to starting salary<br />
Lower<br />
secondary<br />
education<br />
upper<br />
secondary<br />
education<br />
years from starting<br />
to top salary (lower<br />
secondary education)<br />
Salary per hour of net contact (teaching)<br />
time after 15 years of experience<br />
Primary<br />
education<br />
Lower<br />
secondary<br />
education<br />
upper<br />
secondary<br />
education<br />
Annex A<br />
Ratio of salary per<br />
teaching hour of upper<br />
secondary to primary<br />
teachers (after 15 years<br />
of experience)<br />
(13) (14) (15) (16) (17) (18) (19) (20)<br />
Australia 1.39 1.39 1.39 9 55 59 61 1.10<br />
Austria 1.98 1.97 2.04 34 53 73 78 1.47<br />
Belgium (Fl.) 1.72 1.72 1.74 27 57 66 91 1.60<br />
Belgium (Fr.) 1.74 1.74 1.77 27 61 67 94 1.55<br />
Canada m m m m m m m m<br />
Chile 1.87 1.87 1.87 30 18 18 19 1.05<br />
Czech Republic 1.47 1.49 1.54 32 29 39 43 1.50<br />
Denmark 1.16 1.16 1.31 8 84 84 165 1.97<br />
Engl<strong>and</strong> 1.46 1.46 1.46 10 74 66 66 0.89<br />
Estonia 1.46 1.46 1.46 7 25 25 27 1.09<br />
Finl<strong>and</strong> 1 1.54 1.56 1.71 16 61 75 90 1.46<br />
France 2.05 1.90 1.89 34 36 56 58 1.58<br />
Germany 1.33 1.35 1.39 28 71 83 96 1.36<br />
Greece 1.48 1.48 1.48 33 58 80 80 1.38<br />
Hungary 1 1.66 1.66 1.90 40 25 25 30 1.20<br />
Icel<strong>and</strong> 1.17 1.17 1.30 18 53 53 60 1.12<br />
Irel<strong>and</strong> 1 1.88 1.88 1.88 22 64 82 82 1.29<br />
Israel 2.24 2.28 2.27 36 37 46 48 1.30<br />
Italy 1.47 1.50 1.57 35 46 62 63 1.37<br />
Japan 2.23 2.23 2.29 34 70 82 99 1.41<br />
Korea 2.77 2.78 2.78 37 63 85 87 1.38<br />
Luxembourg 2.18 1.74 1.74 30 101 177 177 1.75<br />
Mexico 2.14 2.14 m 14 26 25 m m<br />
Ne<strong>the</strong>rl<strong>and</strong>s 1.46 1.68 1.68 17 54 80 80 1.48<br />
New Zeal<strong>and</strong> m m m m m m m m<br />
Norway 1 1.23 1.23 1.19 16 59 67 89 1.50<br />
Pol<strong>and</strong> 1.77 1.79 1.81 10 32 37 42 1.31<br />
Portugal 1.76 1.76 1.76 34 48 54 54 1.14<br />
Scotl<strong>and</strong> 1 1.60 1.60 1.60 6 60 60 60 1.00<br />
Slovak Republic 1.24 1.24 1.24 32 17 22 23 1.35<br />
Slovenia 1.28 1.28 1.28 13 51 51 56 1.09<br />
Spain 1.40 1.40 1.40 38 54 74 78 1.45<br />
Sweden 1 1.34 1.33 1.36 a m m m m<br />
Switzerl<strong>and</strong> 2 1.57 1.55 1.53 27 m m m m<br />
Turkey 1.16 a 1.16 a 43 a 50 1.15<br />
United States 1 1.41 1.50 1.48 m 41 42 46 1.12<br />
OECD average 1.64 1.64 1.64 24 51 62 71 1.34<br />
Eu21 average 1.58 1.57 1.61 24 53 65 74 1.38<br />
Argentina m m m m m m m m<br />
Brazil m m m m m m m m<br />
China m m m m m m m m<br />
India m m m m m m m m<br />
Indonesia 1.44 1.47 1.41 32 2 3 3 2.16<br />
Russian Federation m m m m m m m m<br />
Saudi Arabia m m m m m m m m<br />
South Africa m m m m m m m m<br />
1. actual salaries.<br />
2. salaries after 11 years of experience <strong>for</strong> columns 2, 6 <strong>and</strong> 10.<br />
source: oecd (2011), Education at a Glance 2011: OECD Indicators, oecd Publishing.<br />
Please refer to <strong>the</strong> Reader’s Guide in education at a glance 2011 (www.oecd.org/edu/eag2011) <strong>for</strong> in<strong>for</strong>mation concerning <strong>the</strong> symbols replacing<br />
missing data.<br />
1 2 http://dx.doi.org/10.1787/888932465246<br />
PreParing teachers <strong>and</strong> develoPing school leaders <strong>for</strong> <strong>the</strong> <strong>21st</strong> century – lessons froM around <strong>the</strong> World © OECD 2012<br />
91


