Using WorldView 2 Vis-NIR MSI Imagery to Support Land Mapping ...
Using WorldView 2 Vis-NIR MSI Imagery to Support Land Mapping ...
Using WorldView 2 Vis-NIR MSI Imagery to Support Land Mapping ...

Create successful ePaper yourself
Turn your PDF publications into a flip-book with our unique Google optimized e-Paper software.
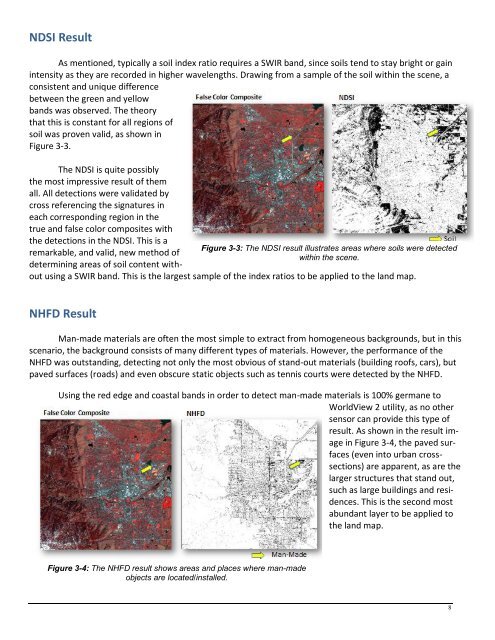
NDSI Result<br />
As mentioned, typically a soil index ratio requires a SWIR band, since soils tend <strong>to</strong> stay bright or gain<br />
intensity as they are recorded in higher wavelengths. Drawing from a sample of the soil within the scene, a<br />
consistent and unique difference<br />
between the green and yellow<br />
bands was observed. The theory<br />
that this is constant for all regions of<br />
soil was proven valid, as shown in<br />
Figure 3-3.<br />
The NDSI is quite possibly<br />
the most impressive result of them<br />
all. All detections were validated by<br />
cross referencing the signatures in<br />
each corresponding region in the<br />
true and false color composites with<br />
the detections in the NDSI. This is a<br />
remarkable, and valid, new method of<br />
determining areas of soil content with-<br />
out using a SWIR band. This is the largest sample of the index ratios <strong>to</strong> be applied <strong>to</strong> the land map.<br />
NHFD Result<br />
Man-made materials are often the most simple <strong>to</strong> extract from homogeneous backgrounds, but in this<br />
scenario, the background consists of many different types of materials. However, the performance of the<br />
NHFD was outstanding, detecting not only the most obvious of stand-out materials (building roofs, cars), but<br />
paved surfaces (roads) and even obscure static objects such as tennis courts were detected by the NHFD.<br />
<strong>Using</strong> the red edge and coastal bands in order <strong>to</strong> detect man-made materials is 100% germane <strong>to</strong><br />
<strong>WorldView</strong> 2 utility, as no other<br />
sensor can provide this type of<br />
result. As shown in the result image<br />
in Figure 3-4, the paved surfaces<br />
(even in<strong>to</strong> urban crosssections)<br />
are apparent, as are the<br />
larger structures that stand out,<br />
such as large buildings and residences.<br />
This is the second most<br />
abundant layer <strong>to</strong> be applied <strong>to</strong><br />
the land map.<br />
Figure 3-4: The NHFD result shows areas and places where man-made<br />
objects are located/installed.<br />
Figure 3-3: The NDSI result illustrates areas where soils were detected<br />
within the scene.<br />
8