KEPLER'S WINE BARREL PROBLEM IN A DYNAMIC GEOMETRY ...
KEPLER'S WINE BARREL PROBLEM IN A DYNAMIC GEOMETRY ...
KEPLER'S WINE BARREL PROBLEM IN A DYNAMIC GEOMETRY ...

Create successful ePaper yourself
Turn your PDF publications into a flip-book with our unique Google optimized e-Paper software.
KEPLER’S <strong>W<strong>IN</strong>E</strong> <strong>BARREL</strong> <strong>PROBLEM</strong> <strong>IN</strong> A <strong>DYNAMIC</strong> <strong>GEOMETRY</strong><br />
ENVIRONMENT<br />
Bat-Sheva SHECHTER<br />
Israel National Center for Mathematics Education - "Kesher Ham”<br />
Department of education in technology and science<br />
Technion – Israel Institute of Technology<br />
HAIFA, 32000, ISRAEL<br />
bat-7@bezeqint.net<br />
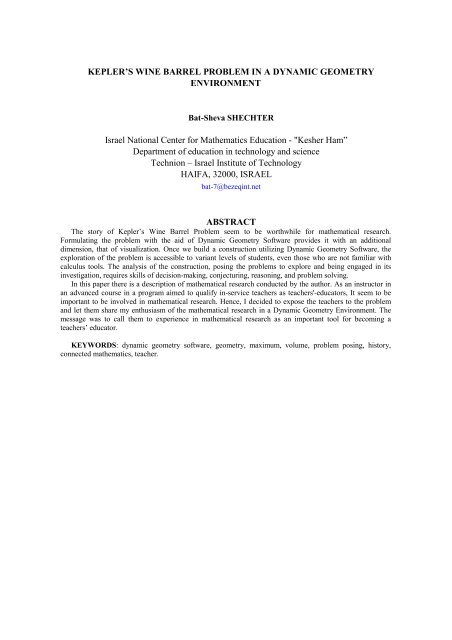
ABSTRACT<br />
The story of Kepler’s Wine Barrel Problem seem to be worthwhile for mathematical research.<br />
Formulating the problem with the aid of Dynamic Geometry Software provides it with an additional<br />
dimension, that of visualization. Once we build a construction utilizing Dynamic Geometry Software, the<br />
exploration of the problem is accessible to variant levels of students, even those who are not familiar with<br />
calculus tools. The analysis of the construction, posing the problems to explore and being engaged in its<br />
investigation, requires skills of decision-making, conjecturing, reasoning, and problem solving.<br />
In this paper there is a description of mathematical research conducted by the author. As an instructor in<br />
an advanced course in a program aimed to qualify in-service teachers as teachers'-educators, It seem to be<br />
important to be involved in mathematical research. Hence, I decided to expose the teachers to the problem<br />
and let them share my enthusiasm of the mathematical research in a Dynamic Geometry Environment. The<br />
message was to call them to experience in mathematical research as an important tool for becoming a<br />
teachers’ educator.<br />
KEYWORDS: dynamic geometry software, geometry, maximum, volume, problem posing, history,<br />
connected mathematics, teacher.
1. Introduction<br />
Attending a workshop for mathematic teachers at the Haifa Technion, I was exposed to<br />
Kepler’s wine barrel problem and its history background.<br />
As Kepler noted in his book New Solid Geometry of Wine Barrels (in Tickomirov (1990)) he<br />
was inspired by an event in his life that occurred in the fall of 1613,:<br />
In December of last year...I brought home a new wife at a time when Austria, having<br />
brought in a bumper crop of noble grapes, distributed its riches...The shore in Linz was<br />
heaped with wine barrels that sold at a reasonable price.<br />
...That is why a number of barrels were brought to my house and placed in a row, and<br />
four days later the salesman came and measured all the tubes, without distinction, without<br />
paying attention to the shape, without any thought or computation. Namely the copper point<br />
of a ruler was pushed through the filling hole of a barrel, across the heel of each of the<br />
wooden disks which we refer to simply as bottoms, and as soon as the length to the point at<br />
the top of one board disk was the same as the length to the point at the bottom of the other,<br />
the salesman stated the number of amphoras contained in the barrel after merely noting the<br />
number on the ruler at the spot where the length in question ended.<br />
I was astonished…<br />
The key result in the book New solid geometry of wine barrels is Theorem V [Part Two]:<br />
Among all cylinders with the same diagonal, the largest and most capacious is that in which<br />
the ratio of the base diameter to the height is 2 .<br />
Figure 1 presents a cylindrical wine barrel lying on its side. The barrel entry is in the middle<br />
point of its side (E); λ is the distance between the entry and the bottom heel (EH).<br />
λ<br />
The problem seem to me as an interesting one and worthwhile for introducing to students.<br />
Since it demands a lot of mathematical knowledge it is not appropriate to all students. Looking for<br />
approaches to adjust for students in various levels, I tried to model the problem with the aid of a<br />
Dynamic Geometer Software (DGS) 1 H<br />
Figure 1<br />
. The computer educational software available today can<br />
shed light on the problem by presenting it in graphical form and therefore help the students<br />
visualize it better.<br />
The following chapters (2-4), provide a description of the problem, its representation in DGS<br />
and suggestions of their investigation. In chapter 2 the problem is formulated in the plane, then in<br />
chapter 3 refers to the barrel assuming it is cylindrical and then chapter 4 there is an approach to<br />
describe the barrel as composed of two truncated cones having a common base. Chapter 5<br />
provides a didactical analysis of the potential of teaching and learning Kepler’s Wine Barrel<br />
Problem with the aid of DGS. Suggested tasks for teachers in a workshop appear in chapter 6.<br />
1 The Geometry Inventor(1994). (Logal Ed.),Software and Systems Ltd was used to this purpose. Of course<br />
any other Dynamic Geometry Software can do as well.<br />
E
2. Kepler's planimetric problem in a dynamic geometry<br />
environment<br />
Formulating the problem<br />
Lets start with the plane version of Kepler's problem – the planimetric problem that fits the<br />
cylinder section:<br />
Among all rectangles (ADBE) with the same diagonal (λ), find the rectangle of maximal area<br />
(Fig.2).<br />
D<br />
2r<br />
A<br />
λ<br />
λ<br />
Figure 2<br />
For a given λ, the locus of vertices D is a circle with AB = λ as its diameter (Fig.3).<br />
Kepler's planimetric problem is then formulated as: to inscribe in a given circle a rectangle of<br />
maximal area.<br />
Figure 3<br />
Construction of the problem with the aid of DGS<br />
It is clear that a rectangle inscribed in a given circle is well defined by the ratio between its<br />
DB<br />
sides: t = . Therefore, the rectangle area is a function of the ratio t. utilizing the DGS<br />
AB<br />
construction tools, it is possible to build all the rectangles inscribed in a given circle and then to<br />
build the graph of the area as a function of t, with the help of the software measure tools.<br />
Description of the construction<br />
1. Build a segment AB.<br />
2. Find the midpoint C of the segment AB.<br />
3. Build a circle with C as its center and with radius CA.<br />
4. Place a point D on the circle.<br />
The triangle DAB is half the rectangle DBEA (Fig.2).<br />
We can use the measure tools to display the following measures on the screen:<br />
AB=λ<br />
DB<br />
t =<br />
AB<br />
S = DB . DA the rectangle area.<br />
B<br />
E
The Geometry Inventor also includes an option to build a function graph by defining the<br />
variables of a function. We define the area S as a function of the variable t. Then, by dragging the<br />
vertex D along the circle, we create all possible triangles. For each one the appropriate measures<br />
appear on the screen, the graph is derived as shown in Figure 4 and the answer is revealed: the<br />
maximum value of the area is obtained on the graph for t = 1. The rectangle of maximum area<br />
inscribed in a given circle is a square.<br />
Figure 4<br />
Figure 4<br />
3. Solution of Kepler’s wine barrel problem with the tools<br />
of geometry inventor: the case of a cylindrical barrel<br />
In addressing the Wine Barrel problem, we first assume that the barrel is a cylinder and that the<br />
length of the segment connecting the barrel entry with its bottom is given (Fig. 2). This segment is<br />
the diagonal of half the cylinder.<br />
The volume V of the cylinder is calculated as:<br />
2 ⎛ AD ⎞ π 2<br />
V = π r ⋅ H = π ⎜ ⎟ ⋅ 2DB<br />
= ⋅ AD ⋅ DB<br />
⎝ 2 ⎠ 2<br />
We can use the software measure tools to compute the value V of the volume and the value t of<br />
the ratio between the height of the barrel and its bottom diameter. Using the approximation 22/7<br />
for π we get V=11/7*DA*DA*DB. As in the planimetric example, as the vertex D is drugged<br />
along the circle the corresponding values of t and V , for each rectangle created, appear on the<br />
screen and a graph of V as a function of t is plotted (Fig. 5).<br />
2
Figure 5<br />
The student is therefore able to find the graph maximum point by simply dragging the vertex D<br />
until it reaches the peak on the graph. Figure 6 shows how easy it is to change the value of λ<br />
(which is AB) and get different graphs. The students might be surprised to learn that the maximum<br />
value of the volume V is always reached for the same value of t=1.42. This result fits the value<br />
2 that is obtained when the function V(t) is investigated with calculus tools (Shacham &<br />
Smukler(2000)).<br />
Figure 6
4. Solution of Kepler’s wine barrel problem with the tools<br />
of geometry inventor: the case of a barrel composed of<br />
two truncated cones<br />
Formulating the problem<br />
The section of a barrel, which is composed of two truncated cones having a common base, is a<br />
hexagon divided into two trapezoids by one of its diagonals as shown in Fig. 7:<br />
λ<br />
Figure 7<br />
To investigate the problem, it is important to formulate it in the language of the geometry<br />
construction, that is, to decide which measurements are given and which are variable.<br />
As in the case of a cylindrical barrel, λ denotes the length of half-barrel diagonal and t is the<br />
ratio between the height of the barrel and the diameter of its bottom. But, now there is an<br />
additional parameter influencing the barrel volume: the ratio between the diameter of the common<br />
base of the cones and the diameter of the barrel bottom. If we look at this section of the barrel we<br />
see that this ratio is between the lengths of the trapezoid bases. Lets designate it as b.<br />
First, we shall look at all barrels with the same values of λ and b and ask how the value<br />
of t influences the barrel volume V. We can concentrate on one of the two trapezoids, and<br />
ask the following question:<br />
A truncated cone is generated by an equilateral trapezoid rotating about its central symmetry<br />
axis. Among all equilateral trapezoids having the same diagonal λ and the same ratio b between<br />
its bases, which trapezoid generates the truncated cone of the largest volume?<br />
Again, the DGS and its tools will be used to solve the problem. A suitable construction is<br />
needed for this purpose.<br />
Analysis of the construction<br />
Let say the trapezoid is AHBG (Fig.8) and the given diagonal is AB = λ.<br />
E<br />
G<br />
A<br />
D<br />
Figure 8<br />
H<br />
C<br />
B
Looking at the altitude AD from A to the trapezoid base GB, we see that the locus of points D<br />
the heels of the altitude, is a circle with AB as a diameter. BD equals to the trapezoid midline, so if<br />
we extend BD beyond the point D (DE=DB), then BE equals the sum of the bases:<br />
BE = AH + BG and therefore EG=AH. Consequently, the point G divides BE in the relation<br />
GB GB<br />
= = b .<br />
GE AH<br />
Description of the construction<br />
1. Build a segment AB .<br />
2. Build a circle with AB as its diameter.<br />
3. Place a point D on the circle.<br />
4. Extend BD beyond D to E, so that DE = BD.<br />
5. Place a point G on the segment BE<br />
6. Draw a parallel line from A to BG.<br />
7. Copy the segment GE on the parallel line starting at A, so that AH=GE.<br />
AHGB is the trapezoid.<br />
Solving the problem with DGS tools<br />
BG<br />
Display on the screen the measures of AB=λ, the ratio = b and an expression<br />
GE<br />
for V according to the formula (Shacham & Smukler(2000)):<br />
3<br />
2π<br />
λ ⋅ t<br />
2<br />
V = ⋅<br />
⋅ ( 1 + b + b )<br />
3<br />
3 2<br />
2 ( t + ( 1 + b)<br />
) 2<br />
With aid of the DGS graph tools build a graph V-t. Once again by simply dragging the vertex D<br />
around the circle we can generate all possible values of t while preserving λ. By dragging the point<br />
G along the segment BE, we get all values for b. Fig.9 shows the graph describing the function<br />
V = V(t) as presented above.
Figure 9<br />
From the graph it is easy to find the maximum value of the volume corresponding to chosen<br />
values of λ and b. In the example shown in Fig. 9, we see that in case λ = AB = 7 and b = 5, the<br />
maximum value is reached for t = 4.25.<br />
According to computations with the calculus tools ((Shacham & Smukler (2000)), the<br />
1+<br />
b<br />
maximum value for the barrel volume is obtained for t = ⋅ 2 . By substituting b = 5 we get<br />
2<br />
t = 3 . 2 or t = 4.24, which is very close to the value obtained from the graph.<br />
Verification of the Graphical Solution<br />
Once we have built a solution for given values of λ and b, it is easy to use the same<br />
construction and solve the problem for any values of λ and b; we need only change the givens.<br />
Table 1 below, describes results of constructions for different values of b and λ.<br />
The value of t of the barrel with the largest volume as derived from the graph for each value of<br />
( 1+<br />
b)<br />
2<br />
b, appears in the third column of table 1. The exact value of t, is , appear in the right<br />
2<br />
column of the table. We can see that the two values are relatively close.<br />
λ b Vmax t (experimental)<br />
( 1+<br />
b)<br />
2<br />
t =<br />
10 2.01 627.43 2.11 2.12<br />
3 5 18.71 4.22 4.24<br />
10 5 695.29 4.24 4.24<br />
10.02 9.98 743.67 7.76 7.76<br />
15 5 2344.97 4.25 4.24<br />
10 50.74 791.17 36.39 36.58<br />
20 5 5550.4 4.25 4.24<br />
Table 1<br />
2
5. Investigating by problem posing: what if…?<br />
Brown and Walter (1990) provide a wide variety of situations implementing the strategy of<br />
“what if and what if not?” questions and their importance in mathematics in general and in<br />
mathematics education in particular. The next step is to pose questions about the model.<br />
For example: What if the parameters change?<br />
1.How does the maximal volume change when the parameter b is increased from b=1<br />
to infinity?<br />
2. How does the maximal volume change when the parameter λ increases?<br />
It is very easy to investigate with these questions with the aid of the construction in the<br />
geometry software environment.<br />
5.1 The influence of the parameter b on the maximal volume<br />
In order to investigate the influence of b on the maximal volume, we keep the value of λ<br />
constant and increase the value of b by dragging the point G (Figure 8).<br />
Figure 10 below shows the graphs of the barrel volume as a function of t for λ=10 as b<br />
increases starting from 1.<br />
Figure 10<br />
Table 2 presents the maximal volumes and the corresponding values of t ratios between the<br />
volume of non-cylindrical and cylindrical barrels when λ =15 and b increases from b=1.
t V max (b) V max(b) / V max(1)<br />
1 1.41 2044.07 1<br />
1.1 1.49 2044.98 1.0004<br />
1.5 1.77 2069.55 1.0124<br />
2.01 2.12 2118.63 1.0365<br />
3.02 2.84 2213.9 1.0830<br />
5 4.24 2344.97 1.1472<br />
10.12 7.88 2500.38 1.2232<br />
26.01 19.12 2626.10 1.2847<br />
52.33 37.77 2673.10 1.3077<br />
110.09 78.36 2698.90 1.3203<br />
226.64 161.11 2711.29 1.3264<br />
279.68 198.25 2713.54 1.3275<br />
Table 2<br />
In case b=1, the barrel is cylindrical and so its maximal volume equals 2044.07. From Figure<br />
10, as well as from Table 2, one can see that the barrel volume approximates the cylinder volume<br />
when b is close to 1. From the right column in table 2, we learn that as the values of b increase, the<br />
barrel maximal volume also increases. However, this increase is limited and the ratios between the<br />
different maximal volumes to the cylinder volumes of cylinders for the same value of λ tends to<br />
converge to 1.32. This result matches the result 4/3 obtained by analytic investigation ((Shacham<br />
& Smukler(2000)).<br />
5.2 The influence of the parameter λ on the maximal volume<br />
Let us keep the value of b constant and just change the value of λ. Figure 11 shows the graphs<br />
of the barrel volume V as a function of t for b=5 and for values of λ= AB from 5 to 12. From these<br />
we see, that the maximal barrel volume increases as a result of the growth of λ, with no limit.<br />
Figure 11
The results shown in Table 3, lead to the conclusion that the growth of the maximal barrel<br />
volume is proportional to λ 3 .<br />
Λ V max t V max / λ 3<br />
3 18.66 4.33 18.66/3 3 =0.691<br />
8 355.69 4.26 355.69/8 3 =0.694<br />
10 695.29 4.24 695.29/10 3 =0.695<br />
15 2326.06 4.75 2326.06/15 3 =0.689<br />
20 5494.42 4.83 5494.42/20 3 =0.689<br />
Table 3<br />
Another conclusion of the investigations presented in Table 3 is that the values of t providing<br />
the maximal volume of the barrel are not influenced by the values of λ.<br />
6. Achieving educational goals<br />
We can concentrate now, in some important educational principles as follows: motivation;<br />
problem posing; visualization; reasoning; connected mathematics; mathematics for all students. In<br />
the next sessions there is a description of them as well as an analysis of their place in the suggested<br />
approach to Kepler’s Problem.<br />
6.1 Motivation<br />
The NCTM. Standards recommend using worthwhile mathematical tasks to introduce<br />
important mathematical ideas and to engage and challenge students intellectually: Well-chosen<br />
tasks can stimulate students' curiosity and help them develop an interest in mathematics.<br />
Another recommendation is to utilize electronic technologies such as DGS, as useful tools for<br />
imposing worthwhile problems (NCTM (2000)<br />
Posing the historical background of Kepler’s wine problem is a worthwhile activity that can<br />
motivate the students. The use of the DGS allows students to solve the problem without being<br />
distracted by complex computations. The students can focus on decision-making, reflection,<br />
reasoning, and problem solving.<br />
6.2 Problem posing<br />
One important educational goal is to let students pose new questions using the strategy of<br />
“what if and what if not?”. Students should then be encouraged to pose questions, then to<br />
investigate their own conjectures. (as in chapter 4).<br />
6.3 Visualization<br />
In the activities described above, we used DGS, in order to furnish visual images of the<br />
mathematical ideas’ rules and concepts. The graphical tools of DGS enable visualizing<br />
connections between various parameters.<br />
Purdy(2000) talks about the advantages of DGS as an aid in visualizing maxima in volume<br />
problems. In our example the students also benefit from the graph which is built with the aid of the<br />
software.<br />
6.4 Reasoning<br />
NCTM standards(2000) call for investigating mathematical conjectures and developing and<br />
evaluating mathematical arguments and proofs. As Bruckheimer and Arcavi (2001) write on the
potential of DGS to promote links between empirical and deductive reasoning. They show how<br />
DGS can support the development of a proof by using empirical evidence as the source for insight<br />
and inspiration for a deductive argument while they build the proof of Morley’s theorem. For<br />
many students the proof cannot be understood in another way.<br />
In order to build the construction with the aid of DGS, students must first analyze and<br />
understand Kepler’s Problem. This demands logical and geometric considerations and thus<br />
students are involved in reasoning.<br />
6.5 Connected Mathematics<br />
Paul Goldberg(1996), calls in his project “Connected Geometry”, for a curriculum that helps<br />
students engage in meaningful mathematical activities which will offer them a chance to<br />
understand and appreciate the relationships between variables; unifying themes within<br />
mathematics. Furthermore such activities should help them and to connect their previous<br />
experiences to mathematics and develop and use mathematical habits of mind. He describes the<br />
benefits of teaching connected mathematics as helping students to become experimenters,<br />
describers, tinkerers, inventors, visualizers, conjecturers, and guessers.<br />
The Kepler’s Wine Barrel Problem may be seen as a typical example of connected<br />
mathematics. As follows:<br />
(i) Building the algebraic model of the problem, i.e. expressing the barrel volume V as a<br />
function of t, requires understanding the relations between variables and building the proper<br />
function.<br />
(ii) Building the geometric model of the problem and representing it with the aid of DGS,<br />
requires an understanding of geometry and analyzing – the kind of ruler – compass construction.<br />
This subject is not included in Israel’s curriculum.<br />
(iii) creating the appropriate graph of the function enables one to investigate how its shape as<br />
defined by the parameters, influences the barrel maximal volume.<br />
Thus there are connections within mathematics like: function and graphs; geometry; technology<br />
and calculus, as well as to every-day life and to the historical background.<br />
6.6 Mathematics for all students.<br />
Solving Kepler’s wine problem with the DGS, enables teachers to adapt the task to different<br />
students. The more able students can be exposed to a advanced task such as analyzing the<br />
geometry construction and translating it to use the software, while less able students can lean upon<br />
these results, build the graph of the function, watch it on the screen and read the solution from the<br />
graph. Students who are easily distracted may focus more intently on computer tasks, while those<br />
who have organizational difficulties may benefit from the constraints imposed by computer<br />
environment. Therefore students who have trouble with basic procedures in basic mathematical<br />
concepts can still develop and demonstrate an understanding of mathematics, which in turn can<br />
eventually help them learn the basics.<br />
7. Suggested Activities for Teachers<br />
As an instructor in an advanced course in a program aimed to qualify in-service teachers as<br />
teachers'-educators, I find it important to be involved in mathematical research. Hence, I decided<br />
to expose the teachers to the problem and let them share my enthusiasm of the mathematical<br />
research in a Dynamic Geometry Environment. The message was to call them to experience in<br />
mathematical research as an important tool for becoming a teachers’ educator.
After the teachers were exposed to the tasks that were modified to them (see example in the<br />
appendix), they were asked to develop, each of them, a mathematical project. They chose<br />
problem from the curriculum and started a mathematical exploration. They are in an on-going<br />
process so it is pre mature to have any conclusions.<br />
Appendix<br />
Activity 2<br />
Among all cylinders with the same measure of the diagonal (λ) of half the cylinder, find the<br />
cylinder of maximal volume (Fig.12).<br />
D<br />
2r<br />
A<br />
λ<br />
λ<br />
1. Analyze the construction<br />
2. Present the problem utilizing DGS.<br />
3. Describe the construction.<br />
4. Plot a graph of V (the volume of the cylinder) as a function of t – the ratio<br />
between its sides.<br />
5. Answer the question above using the obtained graph.<br />
6. Verify your solution with other mathematical tools.<br />
ACKNOWLEDGEMENT: I would like to thank Dr. Alla Shmukler for her support and<br />
invaluable suggestions remarks on the early draft of this manuscript.<br />
REFERENCES<br />
- Brown S. I. &Walter m. I.(1990) The Art of Problem posing, Lawrence Erlbaum associates<br />
Publishers<br />
- Bruckheimer M. & Arcavi A.( 2001), A Herrick Among Mathematicians or Dynamic<br />
Geometry as an Aid to Proof, International Journal of Computers for Mathematical<br />
Learning, 6, pp. 113-126<br />
- Goldberg P.(1996), Connected Geometry, Everyday Learning Corporation, Chicago,<br />
Illinois, U.S.A.<br />
- Purdy C.D.(2000), Using the Geometer’s Sketchpad to Visualize Maximum-Volume<br />
Problems, Mathematics Teacher 93(3).<br />
- Sacham Z. & Shmukler A.(2000), Secret of the Austrian Barrel, Paper presented in the<br />
annual conference, (in Hebrew)<br />
- Tikhomirov V.M.(1990), Stories about Maxima and Minima, Translated from the Russian<br />
by Abe Shenitzer, Amer. Soc. And Math. Assos. Of America.<br />
- www.nctm.org (the official site of the NCTM).<br />
G<br />
B<br />
Figure 12<br />
E<br />
F