Grade 1: Step Up to Grade 2
Grade 1: Step Up to Grade 2
Grade 1: Step Up to Grade 2

You also want an ePaper? Increase the reach of your titles
YUMPU automatically turns print PDFs into web optimized ePapers that Google loves.
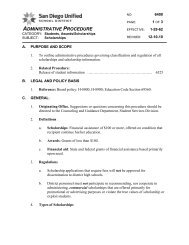
Making Bar Graphs <strong>to</strong> Show<br />
Outcomes<br />
© Pearson Education, Inc.<br />
Name<br />
Name<br />
Making Bar Graphs <strong>to</strong> Show Outcomes<br />
Materials 3 index cards (cut in half vertically), bag<br />
1. Write each letter in the word “MUMMY” on an index card.<br />
Use the extra index card <strong>to</strong> make a tally chart for the<br />
possible outcomes: M, U, and Y.<br />
2. Place the letters in a bag. Shake them and without looking<br />
pick a letter. Tally the letter. Replace the letter, shake, pick,<br />
and tally. Do this 20 times.<br />
Answer 3 <strong>to</strong> 8 <strong>to</strong> make and use a bar graph of the results.<br />
3. Write the title: Letters Picked from<br />
Bag above the graph and label the<br />
axes: Outcome and Number of Times.<br />
4. Complete the scale. Make the scale<br />
by 2s.<br />
5. Draw a bar for each letter. For every<br />
2 tally marks for the letter M, color in<br />
one square above the letter M. After<br />
coloring a square for every 2 tallies,<br />
if you have a tally left over, color half<br />
of a square. Do this for U and Y.<br />
6. Which two letters were picked about<br />
the same number of times?<br />
U and Y<br />
7. Which bar is the longest? M<br />
Intervention Lesson D89<br />
Math Diagnosis and<br />
Intervention System<br />
Intervention Lesson D89<br />
Letters Picked from Bag<br />
16<br />
14<br />
12<br />
10<br />
8<br />
6<br />
4<br />
2<br />
0<br />
M U Y<br />
Outcome<br />
The lengths of the bars will vary,<br />
the bar for M should be the tallest.<br />
Since the bar above M is the longest, M is the outcome that<br />
occurred most often.<br />
8. Reasoning Predict the next letter picked. Explain how you<br />
made your prediction.<br />
M; it is the outcome that occurred most often.<br />
Intervention Lesson D89 267<br />
Number of Times<br />
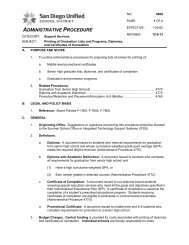
Making Bar Graphs <strong>to</strong> Show Outcomes (continued)<br />
Kendra spun a spinner 20 times. She recorded the number of<br />
times each color was spun. Use the data for Exercises 9 <strong>to</strong> 13.<br />
Outcome<br />
Spinner Results<br />
Tally Number<br />
Purple 11<br />
Green 4<br />
Orange 4<br />
Yellow 1<br />
9. Make a bar graph in the grid on<br />
the right <strong>to</strong> show the data.<br />
10. Which color occurred most often?<br />
least often?<br />
purple; yellow<br />
11. Reasoning What can you tell from<br />
the orange and green bars?<br />
Sample answer: Orange<br />
and green were spun<br />
the same number of times.<br />
12. Reasoning Which color do you predict<br />
would be spun next?<br />
purple<br />
Number of Times<br />
13. Reasoning Draw what you think the spinner<br />
looked like that Kendra used.<br />
Sample spinner is shown.<br />
268 Intervention Lesson D89<br />
Math Diagnosis and<br />
Intervention System<br />
Intervention Lesson D89<br />
Spinner Results<br />
<br />
<br />
<br />
<br />
<br />
<br />
<br />
<br />
Outcome<br />
Purple<br />
Orange<br />
Green<br />
Yellow<br />
© Pearson Education, Inc.<br />
Teacher Notes<br />
Math Diagnosis and<br />
Intervention System<br />
Intervention Lesson D89<br />
Ongoing Assessment<br />
Ask: How can you tell which color on a spinner<br />
covers the most area by looking at a bar graph?<br />
The color that has the longest bar probably has the<br />
largest area on the spinner.<br />
Error Intervention<br />
If students have trouble make or reading bar<br />
graphs,<br />
then use D84: Reading and Making a Bar Graph,<br />
D71: Reading Bar Graphs, and D75: Making Bar<br />
Graphs.<br />
If You Have More Time<br />
Have students repeat the activity, but with the<br />
word “COMPUTER”. Pick one letter from the bag<br />
40 times. After the students have drawn their bar<br />
graph, ask: Will it be easy <strong>to</strong> predict what letter<br />
would be drawn next? Sample answer: No, all<br />
the letters were drawn about the same amount of<br />
times. It could be any of the letters. Then ask: Why<br />
do you think all the letters were drawn about the<br />
same number of times? There are only 1 of each<br />
letter. So they are all equally likely <strong>to</strong> be drawn.<br />
© Pearson Education, Inc. 1