Distribution, abundance and biology of Group V humpback whales ...
Distribution, abundance and biology of Group V humpback whales ...
Distribution, abundance and biology of Group V humpback whales ...

You also want an ePaper? Increase the reach of your titles
YUMPU automatically turns print PDFs into web optimized ePapers that Google loves.
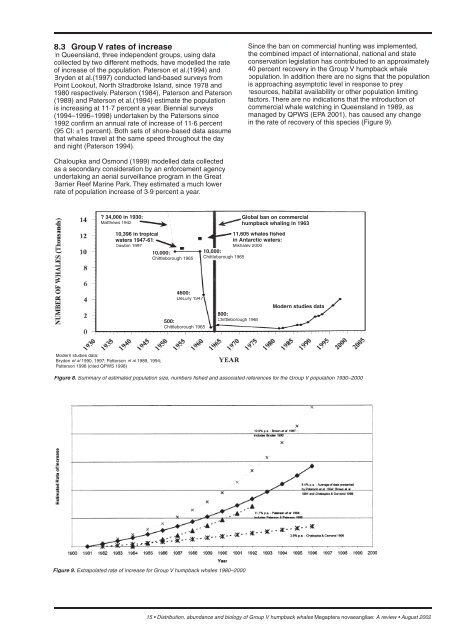
8.3 <strong>Group</strong> V rates <strong>of</strong> increase<br />
In Queensl<strong>and</strong>, three independent groups, using data<br />
collected by two different methods, have modelled the rate<br />
<strong>of</strong> increase <strong>of</strong> the population. Paterson et al.(1994) <strong>and</strong><br />
Bryden et al.(1997) conducted l<strong>and</strong>-based surveys from<br />
Point Lookout, North Stradbroke Isl<strong>and</strong>, since 1978 <strong>and</strong><br />
1980 respectively. Paterson (1984), Paterson <strong>and</strong> Paterson<br />
(1989) <strong>and</strong> Paterson et al.(1994) estimate the population<br />
is increasing at 11·7 percent a year. Biennial surveys<br />
(1994–1996–1998) undertaken by the Patersons since<br />
1992 confi rm an annual rate <strong>of</strong> increase <strong>of</strong> 11·6 percent<br />
(95 CI: ±1 percent). Both sets <strong>of</strong> shore-based data assume<br />
that <strong>whales</strong> travel at the same speed throughout the day<br />
<strong>and</strong> night (Paterson 1994).<br />
Chaloupka <strong>and</strong> Osmond (1999) modelled data collected<br />
as a secondary consideration by an enforcement agency<br />
undertaking an aerial surveillance program in the Great<br />
Barrier Reef Marine Park. They estimated a much lower<br />
rate <strong>of</strong> population increase <strong>of</strong> 3·9 percent a year.<br />
? 34,000 in 1930:<br />
Matthews 1942<br />
10,396 in tropical<br />
waters 1947-61:<br />
Dawbin 1997<br />
10,000:<br />
Chittleborough 1965<br />
Modern studies data:<br />
Bryden et al 1990, 1997; Patterson et al 1989, 1994;<br />
Patterson 1998 (cited QPWS 1998)<br />
4600:<br />
DeLury 1947<br />
500:<br />
Chittleborough 1965<br />
Figure 9. Extrapolated rate <strong>of</strong> increase for <strong>Group</strong> V <strong>humpback</strong> <strong>whales</strong> 1980–2000<br />
Since the ban on commercial hunting was implemented,<br />
the combined impact <strong>of</strong> international, national <strong>and</strong> state<br />
conservation legislation has contributed to an approximately<br />
40 percent recovery in the <strong>Group</strong> V <strong>humpback</strong> whale<br />
population. In addition there are no signs that the population<br />
is approaching asymptotic level in response to prey<br />
resources, habitat availability or other population limiting<br />
factors. There are no indications that the introduction <strong>of</strong><br />
commercial whale watching in Queensl<strong>and</strong> in 1989, as<br />
managed by QPWS (EPA 2001), has caused any change<br />
in the rate <strong>of</strong> recovery <strong>of</strong> this species (Figure 9).<br />
Global ban on commercial<br />
<strong>humpback</strong> whaling in 1963<br />
11,605 <strong>whales</strong> fi shed<br />
in Antarctic waters:<br />
Mikhalev 2000<br />
10,000:<br />
Chittleborough 1965<br />
800:<br />
Chittleborough 1965<br />
Modern studies data<br />
Figure 8. Summary <strong>of</strong> estimated population size, numbers fi shed <strong>and</strong> associated references for the <strong>Group</strong> V population 1930–2000<br />
15 • <strong>Distribution</strong>, <strong>abundance</strong> <strong>and</strong> <strong>biology</strong> <strong>of</strong> <strong>Group</strong> V <strong>humpback</strong> <strong>whales</strong> Megaptera novaeangliae: A review • August 2002