HIS MAJESTY KING MOHAMMED VI - ONE
HIS MAJESTY KING MOHAMMED VI - ONE
HIS MAJESTY KING MOHAMMED VI - ONE

You also want an ePaper? Increase the reach of your titles
YUMPU automatically turns print PDFs into web optimized ePapers that Google loves.
<strong>HIS</strong> <strong>MAJESTY</strong> <strong>KING</strong> <strong>MOHAMMED</strong> <strong>VI</strong>
SUMMARY<br />
6-7<br />
8-9<br />
10-<br />
12-<br />
16-<br />
24-<br />
30-<br />
36-<br />
46-<br />
50-<br />
62-<br />
CHIEF EXECUTIVE OFFICER’S MESSAGE<br />
STRUCTURES<br />
KEY FIGURES<br />
KEY FACTS 2004<br />
COMMERCIAL ACTI<strong>VI</strong>TY<br />
RURAL ELECTRIFICATION<br />
INDUSTRIAL ACTI<strong>VI</strong>TY<br />
IMPORTANT PROJECTS<br />
HUMAN RESOURCES<br />
FINANCIAL RESULTS AND STATUS<br />
CONTACTS
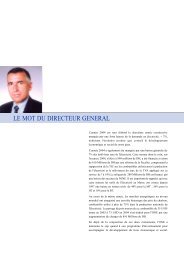
CHIEF EXECUTIVE OFFICER’S MESSAGE<br />
The year 2004 is, first of all, the second consecutive year marked by<br />
a sharp increase of electricity demand, by + 7%, showing the positive<br />
evolution which knows the economic and social development of our<br />
country.<br />
The year 2004 was also marked by a general decline of 7% of<br />
electricity prices, excluding tax. This measure the cost of which<br />
amounts to 890 million dirham, on the fiscal year 2004, was<br />
financed at the rate of 610 million dirham by a tax system reform,<br />
including the deletion of TIC on fuels used for electricity generation<br />
and the increase of the rate of the VAT applied to this service from 7<br />
to 14%. The remainder of 280 million dirham is financed by a<br />
decline of <strong>ONE</strong> receipts. It is important to note that, with this<br />
measure, electricity prices in Morocco knew since 1997 a decline in<br />
real terms of 44% for the middle voltage, 36% for the high voltage<br />
and 10% for the low voltage.<br />
During the same year, the world energy markets registered a<br />
historical inspiration of the coal prices of , which represents more than<br />
75% of the national electricity generation. The passage of the<br />
average price from 35 USD / ton in 2003 to 73 USD in 2004 was<br />
translated for the <strong>ONE</strong> by loads increase by 810 million dirham.<br />
In spite of the conjunction of these two events, the <strong>ONE</strong> maintained<br />
the cap regarding its program of investment to accompany the<br />
development of the economic and social tissue.
Thus, 4.7 billion dirham were invested in 2004 for:<br />
athe generalization of the access to electricity to all citizens,<br />
athe increase of the generation capacity and the interconnections<br />
with nearby countries,<br />
athe intensification of transmission and supply systems,<br />
athe improvement of service quality offered to our customers.<br />
As for rural electrification, 3610 new villages gathering 187 000<br />
homes have been connected to the national network and 363<br />
villages gathering 8 300 homes have been lighted by solar kits.<br />
These realizations, which required an investment of 1.6 billion<br />
dirham, carried the rate of access to electricity in rural areas to 72%.<br />
The generalization of access to electricity is reflected in the important<br />
evolution of customers which registered, in 2004, 254 000 new<br />
subscribers to reach a total of 2 660 000 customers.<br />
Finally, the strong electricity demand, registered since 2003 and<br />
which seems to last, considering all the current projects for the<br />
economic and social development of our country, implies for the<br />
sector and particularly for <strong>ONE</strong> an acceleration of the necessary<br />
investments to guarantee the availability of electricity, to insure our<br />
country’s supply and to improve service quality.<br />
The consolidation of all these realizations and the infringement of the<br />
expected objectives require, more than ever, the conjugation of the<br />
efforts of all.<br />
Ahmed NAKKOUCH<br />
Office Nat ion al de l’Electricité > Annual Rep ort<br />
6-7
STRUCTURES<br />
BOARD OF DIRECTORS<br />
PRESIDENT<br />
Mr. Driss JETTOU, Prime Minister<br />
ADMINISTRATORS<br />
Mr. Chakib BENMOUSSA, General Secretary to the Home Office<br />
Mr. Abdelali BENCHEQROUN, General Secretary to the Ministry of Energy and Mines<br />
Mr. Ahmed BENRIDA, Work Manager in the Ministry of Employment, Social Affairs and<br />
Solidarity<br />
Mr. Ahmed IBRAHIMI, Planning Manager at the Department of Economic Forecast and Plan<br />
Mr. Ahmed BOUHAOULI, General Secretary of the State Secretary at the Ministry of Territory<br />
Development, Water and Environment<br />
Mr. Abdelali BENBRIK, General Inspector of Finance at the Ministry of Finance and Privatization<br />
Mr. Abou Bekr Seddik EL GUEDDARI, Manager of Rural Engineering Administration at the<br />
Ministry of Agriculture and Rural Development
EXECUTIVE COMMITTEE<br />
CHIEF EXECUTIVE OFFICER<br />
MR. Ahmed NAKKOUCH<br />
MANAGERS<br />
MR. Ahmedi ALLACH, FINANCIAL MANAGER<br />
MR. Abdelghani BAAKIL, RURAL ELECTRIFICATION MANAGER<br />
MR. Ben Salem BEN REDOUANE, REP RESENTATIVE W ITH THE<br />
GENERAL MANAGER<br />
MR. Abdesslam BOUDLAL, PROJECT MANAGER<br />
MR. Mohamed FADILI, PLANNING MANAGER<br />
MR. Abdelaziz HOUACHMI, GENERATION MANAGER<br />
MR. Abderrahim JAMRANI, PURCHASE AND MARKETS MANAGER<br />
MR. Ry a d JERJIN I, CO MMUNICATIO N AND CO O PERAT I O N<br />
MANAGER<br />
MR. Abdesslam KARIM, HUMAN RESOURCES MANAGER<br />
MISS Amina LAMRANI, STRATEGY AND DEVELOPMENT MANAGER<br />
MR. Mohamed RACHID NEJJAR, TECHNICAL AND ENGINEERING<br />
MANAGER<br />
MR. A h m e d RAHMO UNI, COMMERCIAL AND MARKETING<br />
MANAGER<br />
MR. Mohamed SEBTI, TRANSMISSION MANAGER<br />
MR. Noureddine SERHIR, SUPPLY MANAGER<br />
Office Nat ion al de l’Electricité > Annual Rep ort<br />
8 -
KEY FIGURES<br />
Installed capacity : 4 621 MW<br />
Net needed power : 17 945 GWh<br />
National electricity generation : 16 383.5 GWh<br />
Number of customers to the end of 2004 : 2 654 222<br />
Staff to the end of 2004 : 9104<br />
18000<br />
16000<br />
14000<br />
12000<br />
10000<br />
8000<br />
6000<br />
4000<br />
2000<br />
0<br />
716<br />
SATISFACTION OF NEEDED ENERGY IN GWH<br />
1759<br />
1846<br />
817<br />
2363<br />
769<br />
1564<br />
1068<br />
1389<br />
1036<br />
1438<br />
1644<br />
1998 1999 2000 2001 2002 2003 2004<br />
1554<br />
Renewable Energies energy Renouvelables Thermal Thermique ImportImportation<br />
1799
Fioul<br />
11%<br />
5000<br />
4500<br />
4000<br />
3500<br />
3000<br />
2500<br />
2000<br />
1500<br />
1000<br />
500<br />
Import<br />
9%<br />
0<br />
INSTALLED CAPACITY IN MW<br />
54<br />
54 54<br />
1998 1999 2000 2001 2002 2003 2004<br />
Hydraulique Hydraulic Thermal Thermique Wind Eolienpower<br />
DEMAND SATISFACTION<br />
THE DISTRIBUTION OF RENEWABLE<br />
ENERGY GENERATION<br />
Wind<br />
11%<br />
Renewable energy<br />
10%<br />
Hydraulic<br />
89 %<br />
Thermal<br />
70%<br />
54<br />
54<br />
RER (%)<br />
80<br />
70<br />
60<br />
50<br />
40<br />
30<br />
20<br />
10<br />
0<br />
17000<br />
16000<br />
15000<br />
14000<br />
13000<br />
12000<br />
11000<br />
10000<br />
9000<br />
18<br />
3 000 000<br />
2 500 000<br />
2 000 000<br />
1 500 000<br />
1 000 000<br />
500 000<br />
0<br />
22<br />
SALES EVOLUTION IN VOLUME (GWH)<br />
1996 1997 1998 1999 2000 2001 2002 2003 2004<br />
CUSTOMERS NUMBER EVOLUTION<br />
1996 1997 1998 1999 2000 2001 2002 2003 2004<br />
RURAL ELECTRIFICATION RATE EVOLUTION (RER)<br />
27<br />
32<br />
39<br />
1995 1996 1997 1998 1999 2000 2001 2002 2003 2004<br />
45<br />
50<br />
55<br />
62<br />
72<br />
Office Nat ion al de l’Electricité > Annual Rep ort<br />
1 0-11
KEY FACTS 2004<br />
January<br />
• Decline of electricity sale tariffs, excluding tax, accompanied by the<br />
reform modernizing taxation on electricity.<br />
• Connection of Boujdour city to the national transmission electricity network.<br />
April<br />
• Supply of the new electric LYDEC post of Dar Bouaaza.<br />
June<br />
• Signature of two loan agreements, of a total amount of 50 million US<br />
dollars, with the Islamic Bank of Development in Jeddah, for the financing<br />
of the electrification of 1221 villages.<br />
• S i g n a t e u or f the first electric supply contract quality with SONASID.<br />
• Launch of a communication campaign for the benefit of Moroccans<br />
living abroad.<br />
July<br />
• Inauguration of the lightning of Al Kasba wall and of the Rif Al Andalous<br />
mosque minaret in Chefchaouen city.
August<br />
October<br />
• The supply of the combined cycles plant of Tahaddart.<br />
• The supply of Draa Lasfar mine.<br />
• The signature of a contract with the SENELEC for the realization of a study on electricity fixing<br />
prices in Senegal.<br />
• The starting up of the functioning essays o f the turbo -alternators groups of A fourer STEP.<br />
• The <strong>ONE</strong> and the French Agency of Development sign a loan agreement of 50 million euro<br />
for rural electrification financing projects within the PERG fourth phase.<br />
November<br />
• The <strong>ONE</strong> and the European Investment Bank sign a loan agreement of 120 million euro for<br />
the renovation of Mohammedia thermal plant and the financing of Tangier wind plant.<br />
• The <strong>ONE</strong> and the German KfW bank sign a loan agreement of 61 million euro for the<br />
financing of the Tanafnit-El Borj hydroelectric complex.<br />
December<br />
• The starting of Oum Er Rbia hydraulic micro plant of an installed power of 220 kW.<br />
• The starting of the first turbo-alternators couple of the Pumping Energy Transfer Station of<br />
Afourer.<br />
• The regional transmission Division of Kénitra obtains its ISO 9001/2000 certificate<br />
awarded by AFAQ.<br />
• The introduction of the reads meters of 54 customers supplied with very high and high<br />
voltage on 66 practicable in RTC lines.<br />
• The <strong>ONE</strong> and the German Bank KfW sign a loan agreement of 50 million euro for the<br />
realization of a wind park in Essaouira.<br />
Office Nat ion al de l’Electricité > Annual Rep ort<br />
1 2-13
A STEADY GROWTH OF SALES<br />
Sales distribution<br />
I M P O RTANT<br />
C U S T O M E R S<br />
S U P P L I E R S<br />
In 2004, the total <strong>ONE</strong> energy sales witnessed a steady growth re a c h i n g<br />
16 288 G Wh, versus 1 5 214 GWh the previous year, that is a pro g ress of<br />
7.1%, after having re c o rded a growth o f 8% in 2003.<br />
This rising trend is particularly marked in the zones where <strong>ONE</strong> insures supply,<br />
which re g i s t e erd an increase o f the demand of 10 %.<br />
These perf o rmances are also reflected at the level of ON E customers which knew<br />
during the same year, gathering all categories, an increase of 1 0.6%<br />
c o re sponding to 253 698 new subscribe rs which carries the total number of<br />
ON E customers to 2 654 222 at the end o f 20 04.<br />
SALES DISTRIBUTION IN 2004<br />
Sales (GWh)<br />
2003 2004<br />
Market shares<br />
(%)<br />
Sales (GWh)<br />
Market shares<br />
(%)<br />
Sales<br />
evolution<br />
(%)<br />
2 333 15,3 2 548 15,6 9,2<br />
• O NE S U P P LY 5 234 34,4 5 756 35,3 10<br />
• O T H E R S S U P P L I E R S 7 647 50,3 7 984 49,0 4,4<br />
T O TA L SALES 15 214 100,0 16 288 100,0 7,1<br />
Other<br />
suppliers<br />
49%<br />
MARKET SHARES DISTRIBUTION IN 2004<br />
Important customers<br />
16%<br />
<strong>ONE</strong> supply<br />
35%
The analysis of <strong>ONE</strong> sales shows the following evolutions:<br />
IMPORTANT CORPORATE CUSTOMERS<br />
Sales to corporate customers, supplied with very high and high voltage, achieved an important evolution comp<br />
a red to last year valued at 2,548 GWh, i.e. an increase o f 9.2%.<br />
In 2004, a new customer was supplied with high voltage: the mine of Draa Lasfar.<br />
Besides, extensions were realized for the benefit of<br />
other customers:<br />
• the Holcim Ras El Ma cementry workers<br />
(+ 4.8 MVA)<br />
• the mine of Tighza (+ 1 MVA)<br />
• the mining complex of Guemassa (+ 3 MVA )<br />
• the steelworks and foundries of Skhirat<br />
(+ 2 MVA),<br />
• M a g h eb r Steel (+ 5 MVA ) ,<br />
• STMicroelectronics (+ 1.2 MVA).<br />
SUPPLIERS<br />
SALES TO VHV- HV CUSTOMERS in MWh<br />
Distributed between <strong>ONE</strong> supply, the state control supply and private suppliers, the national market of<br />
energy supply added up, in 2004, 13 740 GWh, i.e. an increase of 6.7% with regard to 2003.<br />
<strong>ONE</strong> supply<br />
With a sales volume of 5 756 GWh, increasing by 10 % with regard to 2003, the <strong>ONE</strong> supply<br />
registers the strongest growth rate of electricity sales among the national suppliers. The <strong>ONE</strong> widens<br />
consequently its market share, which increases from 40.6 % to 42 % between 2003 and 2004, and<br />
strengthens its leader's position of supplier at the national level.<br />
Other suppliers<br />
The 1 1 other suppliers, be ing ON E customers, re p resent 49 % of <strong>ONE</strong> global sales ve rsus 50.3 % in<br />
2 003. Sales to this category of customers reached 7 98 4 GWh, in annual pro g ress o f 4 .4 %.<br />
Besides, the year 200 4 witnessed the re a l i z a t i o n<br />
o f three important projects for the benefit o f sup -<br />
pliers name ly:<br />
• the supply in 225 kV of the new post o f<br />
2x70 MVA o f LYDEC at Dar Bouazza, which<br />
is intended to strengthe n the supply of the<br />
West part of Casablanca city,<br />
• the renovation of the middle voltage part o f<br />
the <strong>ONE</strong> post of Fes Amont of a capacity o f<br />
80 MVA serving the RADEEF,<br />
• the extension of the post 60/22 kV o f Fes<br />
Sud of a capacity of 36 MVA .<br />
2003<br />
Market<br />
shares<br />
2004<br />
Market<br />
shares<br />
E v o l u t i o n<br />
Ce me nt works 785 023 33,7% 906 047 35,6% 15,4%<br />
Mine s 618 892 26,5% 692 046 27,2% 11,8%<br />
C h e m i s t ry 352 721 15,1% 336 959 13,2% -4,5%<br />
Tr a n s p o rt 206 731 8,9% 219 131 8,6% 6,0%<br />
O the rs 369 324 15,8% 393 887 15,4% 11,3%<br />
Tota l V HV- H V 2 332 690 100% 2 548 070 100% 9,2%<br />
CONSUMPTION EVOLUTION<br />
AND SUPPLIERS MARKET SHARES<br />
Suppliers market<br />
shares<br />
Evolution<br />
2004 / 2003<br />
<strong>ONE</strong> supply 42 % 10,0 %<br />
LYDEC 24 % 4,22 %<br />
REDAL 10 % 4,82 %<br />
AMENDIS TANGIER 5 % 2,56 %<br />
R.AD.E.M.A. MARRAKECH 5 % 9,54 %<br />
R.A.D.E.E.F FES 4 % 4,87 %<br />
R.A.D.E.E.M MEKNES 3 % 5,81 %<br />
AMENDIS TETOUAN 2 % -4,20 %<br />
R.A.K. KENITRA 2 % 6,96 %<br />
R.A.D.E.E.J EL JADIDA 1 % 6,00 %<br />
R.A.D.E.L. LARACHE 1 % 6,04 %<br />
R.A.D.E.S. SAFI 1 % 1,51 %<br />
TOTAL NATIONAL SUPPLIERS 100 % 6,7 %<br />
* Excluding VHV/HV direct customers<br />
Office Nat ion al de l’Electricité > Annual Rep ort<br />
1 6-17
DIRECT <strong>ONE</strong> CUSTOMERS<br />
They are ON E supply customers supplied with either middle or low<br />
v o l t a g e .<br />
Customers supplied with middle voltage<br />
Sales to middle voltage customers (MV) amounted in 2004 to<br />
2 818 GWh, i.e. an increase of 9.5 % in comparison to the<br />
p revious year. This category o f customers re p resents 17 .3 % of<br />
ON E global sales.<br />
Numb er o f<br />
s ub s c r i b e r s<br />
Agriculture<br />
72%<br />
SALES TO MV CUSTOMERS in MWh<br />
2 0 0 3 2 0 0 4 E v o l u t i o n<br />
M W h<br />
Nu mb er o f<br />
s ubs c r i b e r s<br />
M W h<br />
Annexed agricultural<br />
activities<br />
22%<br />
Part de N° o f<br />
marché s ubs c r i b e r s<br />
Fishing<br />
0,5%<br />
Breeding<br />
5,5%<br />
M W h<br />
I N D U S T RY 2 946 1 399 318 3 175 1 504 851 29% 7,8% 7,5%<br />
A G R I C U LT U R E 4 624 772 721 5 054 884 296 46% 9,3% 14,4%<br />
S E RV I C E<br />
I N D U S T RY<br />
1 630 245 838 1 772 269 694 16% 8,7% 9,7%<br />
A D M I N I S T R AT I V E 1 014 156 060 1 001 159 146 9% -1,3% 2,0%<br />
T O TAL M V 10 214 2 573 937 11 002 2 817 987 100% 7,7% 9,5%<br />
Agriculture<br />
Electricity consumption by agricultural MV customers knew an<br />
important progress of 14.4% with regard to 2003 reaching 884<br />
GWh. This growth is due to the increase of consumptions of<br />
particular customers and private companies which registered<br />
430 new customers as well as to the increase of the demand<br />
emanating from ORMVA among which mainly the ORMVA of<br />
Doukkala.<br />
SALES DISTRIBUTION TO AGRICULTURAL CUSTOMERS<br />
BY ACTI<strong>VI</strong>TY SECTOR
Industry<br />
The industrial customers’ number re g i s t ed e r an evolution of 7.8%<br />
with the arrival of 229 customers operating mainly in the sectors of<br />
Water and Electricity and Building with respectively 44 and 30 new<br />
c u s t o m e r s .<br />
Sales to the industrial MV customers pro g ressed of 7.5% with re g a dr<br />
to 2003 adding up a volume of 1 504 85 1 MWh. This incre a s e<br />
is essentially due to the strong demand from sectors o f building (+<br />
16%), agribusiness (+ 6%), water and electricity (+ 7%) and of<br />
chemical industry (+ 17%). As for the market share of industrial<br />
customers with re g a rd to MV customers, it re p resents 29%.<br />
Service industry<br />
This market re g i s t e ed r 14 2 new customers, which is an evolution<br />
o f 8.7 % with re g a rd to 2003 due essentially to the sector of<br />
telecommunications with 1 09 new subscribers and o f tourism with<br />
17 additional customers, which is consequent to a reflation of the<br />
tourist activity in 2004 when Morocco exceeded 5 million tourists.<br />
As for electricity consumption o f this sector, it re g i s t e ed r in 2004<br />
an increase of 9 .7 % with re g a rd to the previous year where close<br />
to 50 % is due to the hotel segment demand, which knew a 1 0.6%<br />
p ro g re s s .<br />
Customers supplied with low voltage<br />
The number of low voltage customers (LV) increased in 20 04 fro m<br />
253 698 the majority of which are constituted by households. They<br />
re p resent 188 548 new customers among whom 148 429 are<br />
rural customers of the G lobal Rural Electrification Program (PERG ).<br />
In strong pro g ress, PERG customers who re p resented by the end of<br />
2003 , 20.8% of all ON E customers increased to 24.5% at the<br />
end of 2004.<br />
The total number of LV customers, who practically doubled since<br />
1995 , reached 2 654 222 registering a pro g ress o f 10.6% with<br />
re g a rd to 2003.<br />
In annual pro g re ss o f 1 0 . 4%, sale s to these customers<br />
reache d 2 938 GWh, which re p resents 18% o f the <strong>ONE</strong> global<br />
s a l e s .<br />
Hotel<br />
industry<br />
41%<br />
House<br />
holds<br />
69%<br />
SALES DISTRIBUTION TO INDUSTRIAL CUSTOMERS<br />
Chemistry<br />
Building and<br />
construction<br />
22%<br />
8% Others<br />
2%<br />
Fuel<br />
4%<br />
Mines<br />
8%<br />
Education<br />
6%<br />
Real estate<br />
3%<br />
Textile<br />
industr y<br />
12%<br />
Wood &<br />
paper<br />
3%<br />
Health &<br />
Hygiene<br />
3%<br />
Agribusiness<br />
22%<br />
Electricity<br />
& water<br />
19%<br />
SALES DISTRIBUTION TO TERTIARY CUSTOMERS<br />
Commerce<br />
& Services<br />
17%<br />
SALES DISTRIBUTION TO LV CUSTOMERS<br />
Industrial driving force<br />
4%<br />
Agriculture driving force<br />
1%<br />
Transport<br />
15%<br />
Telecommunications<br />
15%<br />
Administrative lightning<br />
5%<br />
Patent lightning<br />
13%<br />
Public lightning<br />
8%<br />
Office Nat ion al de l’Electricité > Annual Rep ort<br />
1 8-19
OUR PRIORITY: THE SUPPORT OF THE NATIONAL ECON O M Y<br />
TARIFFS DECLINE FOR THE BENEFIT OF THE NATIONAL PRODUCTIVE TISSUE<br />
In support for the competitiveness of the economic operators, a new electricity tariff s<br />
decline (excluding tax) benefiting to all the customers’ segments intervened within<br />
the framework o f the re f o rm modernizing the tax system applying to the electricity<br />
sector and which came into effect from January 1st, 2004 .<br />
It results from this tariff decline a financial eff o rt of 8 90 millions MAD in 2004<br />
injected in the national economy and supported collectively by the State thro u g h<br />
this fiscal re f o rm at the level of 70 % and by the <strong>ONE</strong> for the re m a i n d . e r<br />
The fiscal modification consisted in suppressing various taxes and customs duties<br />
settled by the ON E on fuels for electricity generation and in operating in<br />
replacement an increase o f tax rate on electricity sales from 7 to 14 %.
With the new rates decline granted to the economic operators, the electricity prices re g i s t ed, e r since October 1997,<br />
declines accumulated in real terms of 44,4 % for MV customers and 36,4 % for HV customers.<br />
SUPPORT FOR THE INDUSTRIAL SECTOR<br />
Engaged with authorities for the support to the state economy, the <strong>ONE</strong> adapts and develops its services to meet the needs<br />
of its professional customers and help them to strengthen their competitiveness.<br />
Tourist zones<br />
To accompany the tourist sector’s development, the <strong>ONE</strong> set up, in association with the Ministry of Tourism, a partnership<br />
frame fixing its participation to the realization of new integrated tourist resorts projects.<br />
In 2004, five agreements were signed with the tourist zones of Taghazout, Saidia, Mogador, Mazagan and Chrifia.<br />
These agreements foresee the electric supply of the tourist stations, the realization of infrastructures among which the<br />
<strong>ONE</strong> supports 80 % of the investment amount and the accompanying outside site for the realization of studies and<br />
works for in site infrastructures.<br />
Unique ticket office<br />
110<br />
100<br />
90<br />
80<br />
70<br />
60<br />
50<br />
1 01,8<br />
93, 2<br />
81 ,7<br />
78 ,79<br />
In order to improve the services supplied to professional and institutional customers, a personalized service " unique<br />
ticket office of access to services " was set up at the national level in favour of important customers having several<br />
contracts such as the <strong>ONE</strong>P, the SOREAD (2M), the RTM, Meditel, Maroc Télecom and Ministries and Public<br />
Administrations.<br />
Assistance to VHV-HV customers<br />
In 2004, the <strong>ONE</strong> brought to its important corporate customers its technical aid by coordinating the studies and the<br />
works for the supply relative to important new industrial and tourist projects. It concer ns mainly:<br />
• the future SONASID steelworks in Jorf Lasfar ( 105 MVA),<br />
• the SAMIR refinery in Mohammedia (65 MVA),<br />
EVOLUTION OF THE AVERAGE ELECTRICITY<br />
SELLING PRICES EXCLUDING TAX (centimes/kW h)<br />
VHV-HV<br />
1997 1998 1999 2000 2001 2002 2003 2004<br />
• the new cement work ATLACIM next to Settat (5 MVA),<br />
• the extension of the cement work ASMENT in Temara (6 MVA),<br />
• the news understations of the ONCF in Fes (2x3 MVA) and Zenata (3 MVA)<br />
• the <strong>ONE</strong>P station of Sidi El Khattan in Smara (1 MVA),<br />
M V<br />
LV<br />
TR sociale<br />
The services offer in favour of Important Corporate Customers have been developed and gave place, in 2004, to<br />
several contracts for the maintenance of their HV posts as well as the training of their staff on the electric installations.<br />
86,4<br />
73,9<br />
69,9<br />
61<br />
Office Nat ion al de l’Electricité > Annual Rep ort<br />
20 -
GENERALIZATION OF ACCESS TO ELECTRICITY<br />
In 2004, the Global Rural Electrification Program (PERG) knew a very steady<br />
realization rhythm never reached previously in the objective to generalize<br />
access to electricity in rural areas by the year 2007. This objective is being<br />
realized to meet the Government’s will to improve the level of life of rural<br />
citizens, and this in accordance to the High Royal Directives.<br />
So, the investment amount dedicated to rural electrification in 2004, amounted<br />
to 1.6 billions MAD, showing an important rise of 45 % with regard to 2003.<br />
Since its launch, the PERG allowed, thanks to the various used techniques, the<br />
electrification of 17 208 villages gathering 1 176 954 homes.
AN INCREASING RHYTHM OF REALISATION<br />
In 2004, 3 610 villages were electrified by interconnected<br />
networks and 363 villages by photovoltaic kits, what allowed<br />
187 008 homes to benefit from electricity.<br />
The realizations of 2004 represent, with regard to the previous<br />
year, a 26.3 % increase in term of villages and 16 % in term of<br />
homes.<br />
Since the launch of the PERG, the annual rhythm of the<br />
realizations kept rising. It increased from 557 villages in 1996<br />
to 4 000 villages in 2004, what allowed carrying the rural<br />
electrification rate during this period from 18 % to 72 %. The<br />
accumulation of the profitable homes connected to the network at<br />
the end of 2004 amounts to 1 158 173 whereas the number of<br />
the profitable homes electrified by solar kits reached 18 781.<br />
NOUR SYSTEM: A CONFIRMED SUCCESS<br />
At the conclusion of the experiment led on three sites in various<br />
regions, the ON E launche d the generalization of N OUR<br />
prepayment system, which entered in its full development phase<br />
in 2004.<br />
Developed by the <strong>ONE</strong> to accompany the PERG, the NOUR<br />
prepayment meter has for main advantage to free the customers<br />
from going to Agencies to pay their invoice, a particular problem<br />
in rural areas where homes are generally far away from the <strong>ONE</strong><br />
Commercial Agencies.<br />
Since its launch in November 2002, the NOUR prepayment<br />
meter benefited to 41 808 new rural customers connected to the<br />
network and who represent 6.5% of all PERG customers. The<br />
NOUR customers subscribed in 2004 represent 24 % of the new<br />
PERG customers registered during the year.<br />
4000<br />
3500<br />
3000<br />
2500<br />
2000<br />
1500<br />
1000<br />
500<br />
NUMBER OF ANNUALLY CONNECTED <strong>VI</strong>LLAGES SINCE 1996<br />
0<br />
REGIONS<br />
87<br />
48<br />
102<br />
1996 1997 1998 1999 2000 2001 2002 2003 2004<br />
80<br />
Network villages Solar Villages<br />
REALIZATIONS PER REGION IN 2004<br />
Number<br />
of<br />
villages<br />
%<br />
realizations<br />
48<br />
581<br />
Nbre of<br />
houses<br />
363<br />
%<br />
realizations<br />
MARRAKECH 1 067 27% 32 204 17%<br />
SOUSS 865 22% 30 520 16%<br />
DOUKKALA 444 11% 22 856 12%<br />
CHAOUIA 308 8% 23 628 13%<br />
TAZA 259 7% 12 508 7%<br />
TANGIER-TETUAN 222 6% 16 397 9%<br />
MEKNES 221 6% 10 095 5%<br />
THE ORIENTAL 159 4% 16 048 9%<br />
FÉS 134 3% 6 952 4%<br />
RABAT 100 3% 2 227 1%<br />
GHARB 92 2% 6 942 4%<br />
TADLA 83 2% 5 419 3%<br />
GUELMIM 13 0,3% 810 0,4%<br />
THE GREAT CASABLANCA 6 0,2% 402 0,2%<br />
TOTAL 3 973 100% 187 008 100%<br />
Office Natio nal de l’Electricité > Annual<br />
24 -
DECENTRALIZED ELECTRIFICATION:<br />
A SOLUTION OF DURABLE DEVELOPMENT<br />
Besides the connection to the network, several other solutions<br />
leaning on a sustainable development are selected from the use<br />
of the renewable energies. Those are particularly adapted in<br />
zones that are far from the network and characterized by a<br />
scattered environment. It concerns decentralized electrification<br />
basing on techniques using the solar and wind energy or on<br />
hydroelectric micro-power plants.<br />
Photovoltaic kits<br />
In 2004, the electrification by photovoltaic kits concerned 363<br />
villages, what allowed 8 322 homes in 8 provinces to benefit<br />
from electricity.<br />
In front o f the success o f this electrification mode, the<br />
<strong>ONE</strong> established in 2004 five new contracts totalling 37 000<br />
individual photovoltaic kits for the benefit of the provinces of<br />
Berkane, Jerada, Larache, Oujda Angad, Figuig, Taounate, Al<br />
Hoceima, Kénitra, Sidi Kacem, Chefchaouen, Taourirt, Nador,<br />
Taza, Zouaga Moulay Yacoub, Al Ismailia, Agadir Ida<br />
Outanane, El Hajeb, Ifrane, Tata and Chtouka Aït Baha.<br />
Besides, a call for tender was launched by the <strong>ONE</strong> for the<br />
supply, the installation and the maintenance of 40 000 individual<br />
photovoltaic kits in other provinces, notably Guelmim, Tétouan,<br />
Marrakech Menara, Sidi Youssef Ben Ali, Zagora, Sefrou,<br />
Boulemane, Al Haouz, Ouarzazate, Ben Slimane, Errachidia,<br />
Salé Al Jadida, Skhirat Temara, Taroudant, Tiznit, El Kalaa des<br />
Sraghna, Béni Mellal and Azilal.<br />
PRO<strong>VI</strong>NCE<br />
Number of<br />
houses<br />
%<br />
realizations<br />
Number of<br />
villages<br />
%<br />
realizations<br />
KHOURIBGA 2 076 25% 26 7%<br />
KHENIFRA 1 988 24% 82 23%<br />
KHEMISSET 1 730 21% 91 25%<br />
TAROUDANT 733 9% 13 4%<br />
SETTAT 731 9% 7 2%<br />
EL JADIDA 480 6% 39 11%<br />
CHICHAOUA 477 6% 91 25%<br />
SAFI 107 1% 14 4%<br />
TOTAL 8 322 100% 363 100%
Hydraulic micro power plants<br />
Pursuing its program of using the micro-hydraulics for rural<br />
electrification, the <strong>ONE</strong> proceeded in 2004 to the starting of the<br />
Oum Er Rbia micro power plant of a power of 220 kW.<br />
This micro power plant has an annual producible of 2000 MWh<br />
and is intended to supply 18 villages in separated network, that<br />
is 556 homes and administrative buildings belonging to the<br />
municipality " Oum Er Rbia Sources " in the province of Khénifra.<br />
The steady debit of these sources, which amounts to 1100 l/s<br />
with a height of fall of 27 metres, will allow to insuring a rate of<br />
use superior to 95 %.<br />
It is the second project of this type after that of the hydraulic micro<br />
power plant of Askaw in the Province of Agadir which started in<br />
May, 2002.<br />
Electrification of suburban districts<br />
In suburban zones situated outside the perimeter concerned with<br />
the PERG, the <strong>ONE</strong> proceeds to the electrification of districts<br />
situated on the verge of built-up ar eas entering its zones. This is<br />
developed in accordance to the High Royal Directives aiming at<br />
the promotion of the social envir onment and at the fight against<br />
the proliferation of the unhealthy environment for the improvement<br />
of the conditions of life of the deprived populations.<br />
THE IMPLEMENTATION OF HOUSES OF ENERGY<br />
To d a y, more than 7 000 micro -companies have been cre a t e d<br />
and operate in the electricity sector within the PERG or within<br />
electrification works.<br />
Besides, the <strong>ONE</strong> accompanies the Centre of Renewable<br />
E n e rgies Development (CDER) for the implementation o f micro -<br />
companies called “Houses of Energy” through the <strong>ONE</strong> re g i o n a l<br />
units that insure a relay function to help in the success o f this<br />
p ro j e c t .<br />
The first experimental stage concerned the implementation of<br />
m o re than 90 Houses of Energ y. The second current phase<br />
c o n c e ns r the launch o f more than 500 other micro - c o m p a n i e s .<br />
SOCIOECONOMIC IMPACT OF THE PERG:<br />
During 2 00 3 -2 00 4, the <strong>ONE</strong> realized a study o f<br />
socioeconomic impact of the rural electrification with the<br />
cooperation of a specialized research department. This study<br />
represents, on an international scale, one of the first largescale<br />
works concerning the impact of the rural electrification<br />
o f a country, using succe ssful statistical me thods o f<br />
multidimensional analysis.<br />
The main impacts raised by this study are:<br />
• the emergence of new generative economic activities of<br />
incomes leading a new dynamics in the rural environment as<br />
well as the appearance of the light industry as the joinery or<br />
the mechanics. This engendered a slowing down o f about<br />
5 % of the drift from rural lands and an increase of the return<br />
rate of 1.5 %.<br />
• 82 % of the electrified rural households consider that the<br />
electrification contributed to the improvement of the schooling<br />
conditions of their children whose rate o f schooling<br />
registered a progress of 16 % to 75 % according to<br />
socioprofessional groups.<br />
• the decrease of the global expenses of lighting by<br />
replacement of the traditional means (candle, kerosene gas<br />
or lamp, electric cells etc.)<br />
• the improvement of the equipment rate in audiovisual sets<br />
the rate of which increased from 24 % before the launch of<br />
the PERG to 90 % in 2004.<br />
Office Nat ion al de l’Electricité > Annual Rep ort<br />
2 6-27
DEMAND SATISFACTION<br />
In 2004, the net needed power reached 17 945 GWh, versus 16 779 GWh<br />
in the previous year, in progression of 7%.<br />
Maximal needed power grew by 7.2% compared to 2003 and reached 3191<br />
MW on July 28th, 2004.<br />
Demand satisfaction was guaranteed at the level of 81.4% by national<br />
generation of thermal origin, 10% from renewable energies and 8.6% by import<br />
through the Morocco-Spain Interconnection.<br />
At the end of 2004, the total installed power amounts to 4 621 MW,<br />
registering an increase of 113 MW with regard to the end of 2003. This is<br />
due to:<br />
• the partly industrialized start of the 1st couple of the turbo alterateurs<br />
groups of the Energy Transfer Pumping Station of Afourer,<br />
• the displacement of both units of 60 MW each of Casablanca thermal<br />
power plant.
NATIONAL GENERATION<br />
In 2004, the national electric generation reached 16 383.5 GWh<br />
versus 15 297 GWh in 2003, i.e. an increase of 6.8%.<br />
Thermal generation<br />
The thermal generation amounted to 14 584, 4 GWh in 2004,<br />
in 6.5% increase with regard to 2003.<br />
T h e rmal ge neration of coal origin re p rese nts 8 6% while<br />
generation from fuel origin registered 14%, these proportions<br />
having not varied with regard to 2003.<br />
Independent power production of Jorf Lasfar plant of coal origin<br />
increased by 6% reaching 9936 GWh.<br />
The contribution of <strong>ONE</strong> thermal generation progressed by 7.6%<br />
reaching 4 648.1 GWh.<br />
THERMAL GENERATION DISTRIBUTION<br />
Generation in GWh<br />
2003 2004<br />
Generation from renewable energies<br />
Variation %<br />
C o a l 11750,80 12519,00 6,5%<br />
• JL EC 9375,20 9936,00 6,0%<br />
• Mo ha mmed ia Th erm a l<br />
P l a n t<br />
1495,50 1571,40 5,1%<br />
• T. P. J é r a d a 880,10 1011,80 15,0%<br />
F u e l - o i l 1817,80 2060,50 3,5%<br />
• Mo ha mmed ia Th erm a l<br />
P l a n t<br />
1064,60 1113,10 4,6%<br />
• T. P. K é n i t r a 753,10 768,10 2,0%<br />
• Ga s tur bine s 74,70 126,10 68,8%<br />
• Diesel gr o u p s 36,40 53,30 46,5%<br />
G a s o i l 16,10 4,20 -74,0%<br />
In 2004, the contribution of renewable energies to the national<br />
electricity generation amounted to 1 799.2 GWh, marking an<br />
annual progress of 9.4%.<br />
It was insured by hydraulic generation at the level of 1 600.3<br />
GWh and by wind generation at the level of 199 GWh among<br />
which 185.8 GWh supplied by the Compagnie Eolienne du<br />
Détroit (CED). In an increase of 11% with regard to 2003, the<br />
contribution of hydraulic generation to the satisfaction of the<br />
national demand reached 8.9 %, which constitutes the strongest<br />
level reached since 1999.<br />
Renewable<br />
energies<br />
10%<br />
NEEDED ENERGY DISTRIBUTION<br />
Import from<br />
Spain<br />
9%<br />
IPP thermal<br />
55%<br />
INSTALLED POWER DISTRIBUTION<br />
Wind<br />
1,2%<br />
Thermal<br />
66,4%<br />
Ther mal <strong>ONE</strong><br />
26%<br />
Hydraulic<br />
32,4%<br />
RENEWABLE ENERGY GENERATION DISTRIBUTION<br />
CED wind energy<br />
10%<br />
<strong>ONE</strong> wind<br />
energy<br />
1%<br />
Hydraulic<br />
89%<br />
Office Nat ion al de l’Electricité > Annual Rep ort<br />
3 0-31
TRANSMISSION NETWORK<br />
The functioning of the transmission network was characterized in<br />
2004 by a new progress of the performances realized at the<br />
level of service quality, so translating the <strong>ONE</strong> will to raise this<br />
activity at the level of the best practices and the international<br />
standards within the framework of a process of increasing<br />
improvement.<br />
Measured by the “equivalent time of cut”, service quality offered<br />
to VHV-HV customers witnessed a sensitive improvement by being<br />
established in an average of 4.4 minutes / customer versus 7.5<br />
minutes / customers in 2003.<br />
The important custome rs, who saw this quality indicator<br />
i m p roving from 18.7 to 6.6 on average, were the first<br />
beneficiaries of this improvement.<br />
Certification ISO 9001 : 2000<br />
The <strong>ONE</strong> improved its technical performances by opting for the<br />
certification ISO 9001 - version 2000 within the framework of a<br />
global initiative engaged at the beginning of 2003 and aiming<br />
at obtaining this label through the implementation of a Quality<br />
Management System for all its transmission activities.<br />
This certification aims at placing the <strong>ONE</strong> transmission activity at<br />
the same level as that of the certified European operators in order<br />
to offer to its customers a high service quality and a ceaselessly<br />
growing level of satisfaction through the implementation of a formalized<br />
and an integrated process of continuous improvement to<br />
meet their needs and expectations.<br />
Chosen as experimental site, the Regional Transmission Unit of<br />
Kénitra obtained in December 2004 the ISO 9001 certificate,<br />
version 2000, for all its activities of operation and maintenance<br />
of the VHV-HV network covering the whole Nor thern Western<br />
Region of the country.<br />
Being well advanced in all other transmission entities of the <strong>ONE</strong>,<br />
this project aims at obtaining this certification for all the activity of<br />
the national network in 2006<br />
TRANSMISSION NETWORK INFRASTRUCTURES<br />
LINES LENGTH IN KM<br />
2003 2004<br />
VHV 7 503 7 532<br />
HV 9 605 9 655<br />
TOTAL 17 108 17 186<br />
I N S TA L L E DPOWER IN <strong>ONE</strong> POSTS<br />
Number of<br />
Transformers<br />
Installed<br />
power in MWA<br />
VHV/HV 96 11 630<br />
HV/MV 355 5 089<br />
TOTAL 451 16 719
SUPPLY NETWORK<br />
Considering the important evolution of the supply network<br />
infrastructure, mainly bound to the rural electrification programm<br />
for all citizens by the year 2007, and of the necessity of insuring<br />
supply with a good quality of electric current, the <strong>ONE</strong> launched<br />
in 2004 a three-year action plan having for objective to reach<br />
performances of a similar level to that of the best international<br />
suppliers.<br />
The operated actions concern:<br />
• The intensification and the improvement of MV posts and<br />
lines.<br />
• The modernization o f the methodes of driving and<br />
management of the supply networks.<br />
In this frame, three important HV/MV posts of 20 MVA of power<br />
each, were started in AIN BENI MATHAR, ZIDANIA and<br />
AGHBAR and works for the realisation of 13 other posts were<br />
launched during 2004.<br />
The posts of SIDI MAAROUF, TIZNIT, GOULMIMA, EL KELAA<br />
and MANSOUR EDDAHBI were concerned by an intensification<br />
of power.<br />
The connecting operated for the locking up of the 60kV source<br />
post of KHEMISST allowed to strength security in this province<br />
previously supplied with antenna.<br />
Besides, within the framework of the measures aiming at reducing<br />
the number of energiy interruptions and the unsupplied energy<br />
volume, the <strong>ONE</strong> strengthened the automation of the supply<br />
network by pursuing the installation overall MV network of new<br />
circuit breakers and organs of detection of defects and cuts.<br />
In the same objective, the <strong>ONE</strong> introduced the technique of<br />
under voltage works allowing to insure the continuity of the supply<br />
during works of maintenance of the MV network.<br />
These various actions allowed a reduction of 22% of duration<br />
average of energy interruption per customer between 2003 and<br />
2004. The number of incidents on the MV/LV network registered<br />
a fall of 12% during the same period.<br />
LINES<br />
LENGTH<br />
(KM)<br />
POSTS<br />
NUMBER<br />
SUPPLY INFRASTRUCTURES<br />
2003 2 004 Variation<br />
MV Lines 36 956 40 560 9,8%<br />
LV Lines 92 130 112 017 21,6%<br />
<strong>ONE</strong> 14 222 16 054 12,4%<br />
Customers 9 727 10 542 8,4%<br />
Office Nat ion al de l’Electricité > Annual Rep ort<br />
3 2-33
THE GREAT PROJECTS<br />
In front of an increasing demand, the <strong>ONE</strong> keeps developing new capacities<br />
of electric generation, transmission and supply through important projects to<br />
accompany the evolution and meet electricity needs in the national territory at<br />
the best conditions of price and service quality.<br />
In 2004, <strong>ONE</strong> granted an investment effort of 3.7 billions MAD for the<br />
development of its industrial infrastru c t u re of generation and electricity<br />
networks.
GENERATION CAPACITY DEVELOPMENT<br />
The generation equipme nt program leans mainly on the<br />
implementation of thermal works using the technology of the<br />
combined cycles using natural gas, which is distinguished by the<br />
high technical and economic perf o rmance s and a better<br />
environmental protection, as well as on the valuation of the<br />
national potential in renewable energies by mobilizing the<br />
hydraulic, wind and solar energy sources.<br />
THERMAL GENERATION PROJECTS<br />
Combined cycle plant of Tahaddart<br />
The combined cycle plant of Tahaddart, which is developed in<br />
Independent Power Production by the <strong>ONE</strong> in partnership with<br />
the Spanish operator ENDESA and SIEMENS group, is situated<br />
in the South of Tangier. The plant entered in 2004 in the<br />
finalisation phase preceding its operation, which is foreseen for<br />
the beginning of 2005.<br />
The main ele ctromechanic equipments: turbine , altern a t o , r<br />
recovery boiler and cooling system were assembled. The<br />
connection to the Maghreb Europe gas pipeline through a canal<br />
of 13 km of length for the supply in natural gas was completely<br />
finished, as well as the energy evacuation post towards the<br />
national VHV-HV transmission network.<br />
The operation tests began during the year 2004.<br />
The power plant, which capacity amounts to 385 MW, will<br />
represent in its first year of functioning 17 % of the national<br />
electricity demand.<br />
A project company of Moroccan law named Energie Electrique<br />
de Tahaddart (EET) was created to build and run the power plant<br />
in which 48 % of the capital is held by the <strong>ONE</strong>, 32 % by<br />
Endesa Europa and 20 % by Siemens Project.<br />
EET benefits from a right of enjoyment for 20 years during which<br />
all the generated energy will be bought by the <strong>ONE</strong>.<br />
FINANCIAL ASSEMBLY O F THE P RO JECT OF TA H A D D A RT<br />
• Global investment amount:<br />
3 billions MAD<br />
• Own funds: 25 %<br />
• Financing by loans: 75 %:<br />
- Banque Centrale Populaire : 1 300 MMAD (43%)<br />
- Bank consortium (32%) :<br />
. BCP : 460 MMAD<br />
. BMCE : 289 MMAD<br />
. CNCA : 202 MMAD<br />
Office Nat ion al de l’Electricité > Annual Rep ort<br />
3 6-37
T h e rmo-solar plant of Aïn Beni Mathar<br />
The thermo-solar plant of Ain Beni Mathar, 230 MW, which the<br />
<strong>ONE</strong> develops as owner, is particularly distinguished by its<br />
configuration that integrates a solar constituent into a combined<br />
cycle using the natural gas carried from the Maghreb Europe gas<br />
pipeline.<br />
The annual solar productible, about 55 GWh, will be generated<br />
by a system of cylindrical and parabolic mirors covering an area<br />
of 220 000 m 2 .<br />
Situated in the province of Jerada, this site was distinguished by<br />
its advantages, namely:<br />
• an optimal sunshine level,<br />
• the nearness with the Maghreb-Europe gas pipeline,<br />
• the availability of a refrigeration water source,<br />
• the nearness with the high voltage electricity network.<br />
The project amount is valued at 2.4 billion MAD; it was granted<br />
a fund of 50 million USD by The World Fund for Environment. It<br />
will also be financed by a fund granted by the African Bank for<br />
Development and by the <strong>ONE</strong> own funds.<br />
The ON E proce eded during the year 2 00 4 to the<br />
prequalification of companies for the participation to a call for<br />
tender for the plant’s realization within the framework of a<br />
"turnkey" contract of construction, operation and maintenance<br />
during the first five years.<br />
The steps for supplying the plant in natural gas and acquiring<br />
plots were launched at the same time to the studies of the plan<br />
and the topographic works of the natural gas supplying pipe.<br />
The combined cycle power plant of Al Wahda<br />
Situated in the province of Sidi Kacem near Al Wahda dam and the<br />
passage of the Maghreb Europe gas pipeline, this project includes two<br />
combined cycle units of 400 MW each.<br />
The site prequalification studies were led during the year 2004.<br />
The annual electric energy generation which amounts to 6 bilions kWh<br />
wil re p resent 23 % of the global demand by the horizon 2010.<br />
The first unit of 400 MW is planned to be operating for the end of<br />
2008, whereas the second unit wil start in 2009.
Rénovation of Mohammedia Thermal Power Plant<br />
This project is realized within the framework of the enviro n m e n t<br />
c o n s e vation r policy pursued by the ON E. It has for objective the<br />
e n v i onmental r correspondence o f the coal units (2 x 150 MW) of<br />
the plant with the strictest European standards. i j g k j g g g g<br />
This correspondence concerns the solid, liquid and gas discharg e s<br />
and will consist o f a total renovation o f the installations of filtering<br />
and handling of flying and heavy ashes stemming from the coal<br />
c o m b u s t i o n .d h d d d d d h d d d d d d d d d d d d d g d g d d g d d g d d d<br />
T h rough this project, the <strong>ONE</strong> plans to reach a net improvement of<br />
the technical and economic perf o rmances of Mohammedia plant<br />
which, with a total power o f 600 MW, constitutes the most powerf u l<br />
national generation unit after that of Jorf Lasfar.<br />
To realize this objective, the systems of coal grind and combustion<br />
equipping boilers as well as the systems of control commands and<br />
of instrumentation of both units will be completely replaced by new<br />
systems meeting the most updated technologies.<br />
The European Inve stme nt Bank and the Islamic Bank o f<br />
Development will finance this project, the cost of which amounts to<br />
1 billion dirhams appro x i m a t e . l y<br />
Having handed the contract conditions to pre-qualified companies<br />
within the international call for tender for the project realization, the<br />
<strong>ONE</strong> will proceed to its adjucation during the year 2005.<br />
The works, which will last 16 months, will intervene successively on<br />
each of the two units after the phase of manufacture of equipments<br />
and necessary materials the delay o f which is fixed to 12 months.<br />
These are scheduled in 2007 and 2008.<br />
Office Natio nal de l’Electricité > Annual<br />
3 8-39
T HE PROMOTION OF RENEWABLE ENERGIES<br />
HYDRAULIC GENERATION PROJECTS<br />
Pumping Energy Transfer Station of Afourer<br />
The building site of the Pumping Energy Transfer Station of Afourer<br />
started in June 2001 and entered its finalisation phase in 2004<br />
with the starting up, from the month of September, of tests in<br />
pumping and turbinage modes of the 1 st couple of the turboalternators<br />
gr oups.<br />
With a total power of 463 MW and an annual average<br />
producible of 800 MWh, the Afourer STEP allows running and<br />
better using the available capacities of the generation park<br />
during the night to meet the str ong energy demand in rush hours.<br />
Between 10 pm and 7 am when energy demand is weak, water<br />
is pumped thanks to turbines of reversible type to be stored as a<br />
potential energy in a superior pond. It is then used by turbines to<br />
generate electricity during rush hours when the demand is<br />
maximal.<br />
This generation unit, which is planned to start in 2005, required<br />
an investment of 1 600 million dirham financed by loans granted<br />
by the European Investment Bank and by the Arabic Fund of<br />
Economic and social Development.<br />
Hydro-Electric Complex of Tanafnit El Borj<br />
Situated in the province of Khénifra, the project of hydroelectric<br />
complex of Tanafnit and El Borj is constituted by two hydroelectric<br />
stations of a total power of 44 MW, situated in waterfall on the<br />
Oum Er Rbia river.<br />
This complex, the annual average producible of which is 212<br />
GWh, will allow to run the naturally settled debits of the Oum Er<br />
Rbia's sources. These will be turbinés in the Tanafnit factory and<br />
restored to the amont of the El Borj factory.<br />
This work will allow an annual economy of 48 900 ton of fuel,<br />
and will participate in the environmental protection by avoiding<br />
every year the discharge in the atmosphere of 154 000 tons of<br />
dioxide of carbon and 1250 tons of dioxides of sulfur and<br />
nitrogen.<br />
The complex, the global cost of which amounts to 95 million<br />
dirhams, is collectively financed by the <strong>ONE</strong> and the German<br />
KfW bank.
W IND PROJECTS<br />
W ind park of Essaouira<br />
Situated on the Cap Sim site at 15 km in the South of Essaouira<br />
city, the wind park of an installed power of 60 MW will be<br />
realized by the <strong>ONE</strong> which will insure its financing and operation<br />
as owner.<br />
Constituted by aero generators of a minimal unitarian power of<br />
850 kW, its annual average producible is 210 GWh.<br />
After the studies of the site and of its environmental impact, the<br />
international call for tender for the realization of the wind park<br />
was launched on November 2004 and works will start during<br />
the second half of the year 2005.<br />
The wind park is foreseen to start in March 2007.<br />
The global cost of this investment is estimated at 650 million<br />
dirhams and is financed by the German bank KfW and the<br />
<strong>ONE</strong>.<br />
The positive impact on the envir onment is estimated at 156 000<br />
tons of CO2 gas emissions with greenhouse effect that will be<br />
avoided every year.<br />
The future park of Essaouira represents the first big experimental<br />
project at the national level within the framework of the clean<br />
development mechanism.<br />
W ind park of Tangier<br />
With a total power of 140 MW, the wind park o f Tangier will be<br />
implanted in about fifteen kilometres in the Southeast of the city. Its<br />
annual average producible is of 510 GWh. The studies of the site<br />
and of its environmental impact began in 2004.<br />
With a global cost estimated at 1 800 million dirhams, it will be<br />
also realized and run by the <strong>ONE</strong> as owner. The Euro p e a n<br />
Investment Bank, the German KfW bank, the French Agency of<br />
Development and the <strong>ONE</strong> insure its financing.<br />
On the environmental side, this project will contribute to the<br />
economy of 120 000 ton of fuel oil each year and then to re d u c e<br />
tne CO2 gas emissions o f 470 000 tons/year.<br />
The park wil be achieved in 1 8 months and start by the end of<br />
2 0 0 7 .<br />
Office Nat ion al de l’Electricité > Annual Rep ort<br />
4 0-41
DEVELOPING THE TRANSMISSION NETWORK<br />
The scheduled investments for the development of the transmission<br />
network, within the framework of the guiding plan of big trans-<br />
mission projects set by the <strong>ONE</strong>, aim at increasing the capacity<br />
and optimimizing the exchange with the nearby countries. They<br />
also aim to improve the service quality and strengthen the supply<br />
security of energy of the various consumption centres.<br />
The <strong>ONE</strong> launched for that purpose several projects for the inten-<br />
sification of the interconnections with Spain and Algeria as well<br />
as the extension of the 400 kV, 225 kV and 60 kV lines and the<br />
implementation of a 40 0 kV ridge extending until the border posts.<br />
Morocco Spain interconnection<br />
The project intended to double the exchange capacity of the<br />
Morocco Spain submarine interconnection to increase it from<br />
700 MW to 1400 MW entered its realization phase through the<br />
manufacture of the submarine energy cables and the progress of<br />
the plan studies of the maritime funds and the project engineering.<br />
The project will start by the beginning of 2006.<br />
Of a global cost of 117,2 million euro financed to equal part by<br />
both parties, this project of strategic partnership between the<br />
Spanish operator Red Electrica de Espana and the <strong>ONE</strong> will<br />
allow to strengthen the position of Morocco as energy crossroads<br />
between both banks of the Mediterranean. It will also base the<br />
necessary basic infrastructure for the emergence of a regional<br />
market in the perspective of the electricity sector liberalization.<br />
Great transmission works<br />
In 2004, three VHV new posts of 400 kV were built in Oualili,<br />
Médiouna and Bourdim. Their completion is planned for June,<br />
2005 as well as the operation of four VHV posts of 225 kV in<br />
Laawamar, Laayoune, Tit Mellil and Sehoul and the VHV line<br />
225 kV Sehoul-Zaer.
Transmission network by optical fibre s<br />
In 2004, the first section o f 2 100 km optical fibres was re a l i z e d<br />
within the framework of the transmission project by optical fibre s<br />
c o n c e ning r the display of a network o f 4 000 km coupled with the<br />
V H V-HV electricity network. The completion of the works is fore s e e n<br />
for the beginning o f 2006.<br />
This realization enters within the framework of an action plan aiming<br />
at the modernization of the <strong>ONE</strong> telecommunications network,<br />
n e c e s s y a for r a better mastery o f the management of the national<br />
system of electricity generation and transmission.<br />
The optical fibres technology presents the advantage o f an excellent<br />
reliability and a great capacity of data transmission.<br />
Renewal of the National Dispatching<br />
The starting of the new national dispatching, the realization<br />
contract of which was signed at the end of 2004, is foreseen for<br />
the beginning of 2007.<br />
The objective aimed by the <strong>ONE</strong> through this project, being the<br />
control center of the whole national electric system, is to optimi -<br />
ze, on the technico-economic plan, the exploitation of the gene -<br />
ration and transmission means and the interconnections with the<br />
nearby countries.<br />
Benefiting from the most recent advanced technologies in this<br />
field, the new dispatching will allow a better flexibility and a<br />
higher security management of the network.<br />
Office Nat ion al de l’Electricité > Annual Rep ort<br />
4 2-43
HUMAN RESOURCES<br />
In a context marked by an increasing requirement of competitiveness in front of<br />
the opening of markets to competition, of which notably that of the electric<br />
sector, the human resources development constitutes for the <strong>ONE</strong> an essential<br />
control lever to strengthen its capacity to accompany the changes and to meet<br />
the challenges imposed by its environment.<br />
STAFF<br />
At the end of 2004, the <strong>ONE</strong> staff amounts to 9104 agents versus 9285 in<br />
2003.<br />
The management rate were improved: the rate of executives and that of<br />
supervisors both progressed since the end of 2003, by becoming established<br />
respectively in 16 % and 41 %, thanks to development training accompanying<br />
the internal promotion.
TRAINING<br />
The <strong>ONE</strong> is strongly invested in staff training to raise the level of professionalism and know-how of its staff and realize<br />
a continuous improvement of its productivity and global performances.<br />
Training in the <strong>ONE</strong> is declined according to three axes:<br />
• the first one concerns the "development training" and aims at accompanying the career evolution through the<br />
development of the staff competence who will change their function in conformity with the promotion<br />
• the second corresponds to “training of accompanying” and is mainly intended for the responsible executives to<br />
assist them in the coverage and the mastery of their function,<br />
• the third concerns "training action" and has for objective the professionalism development and the staff know-how<br />
to face specific constraints relative to a definite job.<br />
The training actions realized in 2004 added up 66 448 men.day of training and benefited to 4 773 agents, that is<br />
52 % of the total staff.<br />
The budgetary corresponding effort, which amounted to 41.3 million dirhams, represents about 5 % of the direct salary<br />
mass.<br />
WORK MEDICINE<br />
The work medicine strengthened in 2004 its action which is essentially relative to:<br />
• the implementation of the supervision medical tools at the level of all <strong>ONE</strong> units: the medical capacity bars, the<br />
working situation index cards and the risks surveillance guide,<br />
• the awareness campaigns against the chronic pathologies as the diabetes, the hepatitis and smoking,<br />
• the realization of vaccination campaigns, search of the hepatitis C and cardiovascular check up,<br />
• the analysis of the causes of work accidents and the implementation of the prevention recommendations.<br />
MOTIVATION SYSTEM<br />
The <strong>ONE</strong> established from January 1st, 2004, within the framework of the staff encouragement policy to double efforts<br />
for the improvement of the performances, a variable annual premium called "Performance premium" indexed to the<br />
annual obtained results.<br />
SOCIAL ACTIONS<br />
The <strong>ONE</strong> dedicated an envelope of 32 millions MAD in 2004 for improvement actions of its staff social situation<br />
concerning loans granting.<br />
This allowed satisfying respectively 1563 and 927 the number of profitable agents of a loan for property ownership<br />
and for vehicle purchase since the institution of this operation in 1997.<br />
Furthermore, the <strong>ONE</strong> launched in 2004:<br />
• a transfer operation of 222 function apartment for the benefit of its agents,<br />
• a construction program o f 230 apart m e n t s .<br />
Office Nat ion al de l’Electricité > Annual Rep ort<br />
4 6-47
FINANCIAL RESULTS AND STATEMENTS<br />
The year 2004 was marked by a strong demand (+ 7%), by the increase of<br />
the realized investments (4.45 billion dirhams versus 3.27 billion dirhams in<br />
2003) and a series of events which had an important impact on the financial<br />
situation of the <strong>ONE</strong>. It concerns mainly:<br />
• the reform of the sector’s tax system which concerned the tax increase<br />
from 7 % to 14 % and the deletion of the TIC on fuels accompanied by<br />
a decline of electricity selling prices (exclusive of tax) for all customers<br />
from January 1 st ,<br />
• the increase o f coal international pric es whic h e xc ee de d the<br />
bar o f 80 USD / ton in August 2004 versus 45 USD / ton in October,<br />
2003. This was translated by a negative impact on the <strong>ONE</strong> accounts<br />
which amounted to 811 MDH in 2004.<br />
These various factors neutralized the favourable impacts of the average price<br />
decline of energy purchases from JLEC, in application of the capacities of the<br />
amendment of energy pur chase contract, and the decline of the purchases ave-<br />
rage costs on the electricity Spanish market.<br />
So, the net result, having registered a profit of 69 MDH in 2003, showed a<br />
deficit of 39 MDH in 2004.
EX P E N S E& PR O D U C TAC C O U N T<br />
The expense a nd prod uct account showed a profit turno ver of 599.5<br />
million MAD versus -598 million MAD in 2003. Concerning sa les<br />
t u rn o v e , rexclusive<br />
of tax, it knew a q uasi-congestion by reg istering 11<br />
148 MDH versus 11 166 MDH in 2003 (-0,2 %) which is explained<br />
by the e ffect of tarif fs decline and b y cha nges in the customers<br />
consump tion stru c t u re .<br />
The fuel charges in va lue increased by 11% passing from 1 666 million<br />
MAD in 2003 to 1 849 million MAD in 2004. This is mainly due to<br />
the quantities consumption increase (+ 79 % for petcoke and + 8.7 %<br />
for fuel) and the increases of coal prices partia ly compensated with the<br />
TIC deletion and the improvement of the specific consumption of power<br />
p l a n t s .<br />
E n e rg y purchases in value re g i s t e ed r a light decline of - 0.6 % with<br />
re g a d r to 2003 passing from 5034 to 5003 MDH, due notably to the<br />
compensation between:<br />
• the increase b y 6,2 % of energy purchases in quantities (11 733<br />
GW h in 2004 versus 11 043 GWh in 2003),<br />
• a nd the decline of their averag e prices further to the<br />
renegotiation of purchase tariffs from JLEC and the recession of<br />
the averag e purcha sing prices from Sp ain in light d ecline with<br />
re g a d r to 2003.<br />
It is worth noting that the quantities p urchased on the Spa nish ma rket<br />
depend on arbitrages made between the g eneration costs of <strong>ONE</strong><br />
power pla nts and the purchasing prices from Spain.<br />
MA N A G E M E N TBA L A N C E<br />
RESULTS ACCOUNT 2003 – 2004 IN MMAD<br />
-39 469<br />
-697 761 93 555<br />
Considering the generation weak variations (+ 0,4 %) and of consumption<br />
(+ 2,8 %), the added value remained quasi-stable passing from 4 873<br />
MDH in 2003 to 4 714 MDH, translating an improvement of the<br />
p roductivity and a good mastery of running expenses in spite of the diff i c u l t<br />
situation which characterized this year.<br />
69 017<br />
-626 316 131 086<br />
-800 000 -600 000 -400 000 -200 000 0 200 000 400 000 600 000<br />
Operating income Financial result Non current income Net income<br />
599 472<br />
597 510<br />
Office Nat ion al de l’Electricité > Annual Rep ort<br />
50 -
The exploitation gross excess knew a bending by registering 3 080 MDH<br />
in 2004 versus 3 358 MDH in 2003.<br />
Considering the overdrawn financial result of 698 MDH, the current re s u l t<br />
during the year 2004 was established to - 98 MDH versus - 29 MDH in<br />
2 0 0 3 .<br />
ADDED VALUE AND GROSS OPERATING SURPLUS 2003-2004 IN MILLION MAD<br />
2004<br />
2003<br />
In spite of the negative effects of a dif ficult situation (the increase of<br />
coal prices) and the efforts granted by the <strong>ONE</strong> (price decline), the<br />
realized productivity gains contributed to the conservation of the<br />
financial balances.<br />
RE S O U R C E S& AL L O C AT I O N S<br />
Self-financing clearly improved rising from 827 million MAD in<br />
2003 to 2 799 million MAD in 2004, thus reinforcing <strong>ONE</strong><br />
financial capacity to carry out its investments, refund its financial<br />
debts.<br />
2004<br />
2003<br />
Acquisitions and increases in fixed assets amounted to 4 662 million<br />
MAD in 2004 versus 3 441 million MAD in 2003 that is an<br />
increase of 35,5%.<br />
3 080<br />
3 358<br />
4 874<br />
4 714<br />
Added Value Gross Operating Surplus<br />
FINANCING EVOLUTION 2002-2003 IN MILLION MAD<br />
0<br />
2714<br />
694<br />
2799 797<br />
2023<br />
1448<br />
Self financing Dotations and participations Financing Debts
Acquisitions of fixed assets were primarily related to industrial<br />
investments, including works of generation, transmission, supply and<br />
rural electrification as well as the necessary investments for the<br />
maintenance of the installations and the logistic support, and<br />
amounted to 4 446 MDH versus 3 274 MDH in 2003.<br />
The financial investments amounted to 205 MDH in 2004 (versus<br />
161 MDH in 2003) and concerned the involvement of the <strong>ONE</strong> in<br />
the capital of the Energie Electrique de Tahaddart Company for an<br />
amount of 142 MDH and the loans granted to the personnel for<br />
houses acquisition and personnal vehicles purchases.<br />
Debt refunding recorded a decrease of 17,2% passing from 1 275<br />
million MAD in 2003 to 1 055 million MAD in 2004.<br />
So, the tr easury balance is settled to +58 MDH at the end of 2004<br />
versus 1 173 MDH in 2003.<br />
ALLOCATIONS EVOLUTION 2003 - 2004 IN MMAD<br />
2004 4662<br />
1055 95<br />
2003<br />
3441 1275 119<br />
Acquis. and fixed assets increase Debt refunding Not forthcoming allocations<br />
Office Nat ion al de l’Electricité > Annual Rep ort<br />
5 2-53
Office Nat ion al de l’Electricité > Annual Rep ort<br />
5 4-55
BALANCE SHEET Financial year ended 12/31/2004<br />
A S S E T S<br />
N O N -PRO DU CTIVE FIXED ASSETS (A)<br />
S TA RTUP CO ASTS<br />
EX PENSES TO BE ACCRUED O VER SEV. YRS<br />
BON D REDEMPTIO N PREMIUMS<br />
I N TAN GIBLE FIX ED A SSETS (B)<br />
RESEA RCH & DEVEL<br />
PATENTS. MA KES. FEES AN D SIM.<br />
O THER INTA NG IBL E A SSETS<br />
TAN GIBLE FIX ED ASSETS (C)<br />
L A N D<br />
B U I L D I N G S<br />
TECH. INSTAL . EQ UIPMENT AN D TO O LS<br />
V E H I C L E S<br />
O FFICE FURN ITURE A ND FITTIN GS<br />
O THER TA NGIBLE FIXED ASSETS<br />
CO NSTRU CTIO N WO RK IN PRO GRESS<br />
FILO NG -TERM INVESTMEN TS (D)<br />
L ON G- TERM L O AN S<br />
O THER FINA NCIAL L OA NS<br />
EQ UITY IN VESTMENTS<br />
O THER LO N G- TERM DEBTS<br />
T R A N S L ATIO N D IFF EREN TIA L ASSETS (E)<br />
RED UCTIO N IN LO N G- TERM LO A NS<br />
IN CREA SE IN FINA NCING DEBTS<br />
T O TAL I (A +B+ C+ D +E)<br />
STO CKS (F)<br />
G O O D S<br />
CO NSUMABLE MATERIA LS & SUPPL IES<br />
WO RK IN PRO G RESS<br />
IN TERMED PROD UCTS & RESID . PROD UCTS<br />
FINISHED PRO DU CTS<br />
CURREN T ASSETS CLA IMS (G )<br />
TRA DE D EBTO RS AD VA NCES & D O WN PAY M T S<br />
CUSTO MER ACCOU NTS RECEIVA B L E<br />
S TA F F<br />
S TATE DEBIT<br />
R E L ATED ACCOU NTS RECEIVA B L E<br />
O THER DEBTO RS<br />
A CCRUA L ASSETS<br />
M A R K E TA BLE & INV ESTMEN T SECURITIES (H )<br />
T R A N S L ATIO N D IFF EREN TIA L ASSETS + A 15 (I)<br />
T O TAL II (F+ G+ H+ I)<br />
CASH ASSETS<br />
CHECKS & PAYMENTS FOR COL L ECTIO N<br />
BAN KS TREAS & GIRO CHECKS<br />
CASH ADVAN CE PUBLIC PAYMEN TS & LC<br />
T O TAL III<br />
G RAN D TO TAL (I+ II+ III)<br />
9 815 148 743,05<br />
216 657 593,94<br />
9 598 491 149,11<br />
-<br />
87 040 854,12<br />
-<br />
47 046 739,81<br />
39 994 114,31<br />
68 818 009 442,22<br />
136 914 047,54<br />
9 808 016 555,77<br />
47 678 371 673,16<br />
227 733 743,21<br />
320 638 434,99<br />
575 146 732,68<br />
10 071 188 254,87<br />
653 118 325,79<br />
333 167 045,95<br />
1 871 728,84<br />
0,00<br />
318 079 551,00<br />
447 680 320,39<br />
-<br />
447 680 320,39<br />
79 820 997 685,57<br />
666 680 791,95<br />
-<br />
661 872 834,95<br />
-<br />
4 807 957,00<br />
-<br />
7 369 480 729,20<br />
646 013 907,71<br />
4 655 523 075,06<br />
22 760 769,35<br />
262 288 930,57<br />
-<br />
95 128 095,02<br />
1 687 765 951,49<br />
141 088 914,20<br />
10 218 000,81<br />
8 187 468 436,16<br />
1 462 024 715,82<br />
135 812 526,16<br />
1 322 583 768,16<br />
3 628 421,50<br />
1 462 024 715,82<br />
89 470 490 837,55<br />
FISCAL 2004<br />
4 929 245 113,16<br />
64 381 381,30<br />
4 864 863 731,86<br />
-<br />
16 271 500,70<br />
-<br />
16 271 500,70<br />
-<br />
32 185 970 870,42<br />
901 677,03<br />
5 563 476 976,31<br />
25 654 300 100,91<br />
222 663 799,61<br />
263 203 900,60<br />
481 424 415,96<br />
-<br />
-<br />
-<br />
-<br />
-<br />
-<br />
-<br />
-<br />
-<br />
37 131 487 484,28<br />
29 152 133,53<br />
-<br />
29 152 133,53<br />
-<br />
-<br />
-<br />
211 687 279,93<br />
-<br />
211 687 279,93<br />
-<br />
-<br />
-<br />
-<br />
-<br />
-<br />
-<br />
240 839 413,46<br />
-<br />
-<br />
-<br />
-<br />
37 372 326 897,74<br />
-<br />
4 8 8 5 9 03 6 2 9, 8 9<br />
152 276 212,64<br />
4 733 627 417,25<br />
-<br />
7 0 7 69 3 5 3, 4 2<br />
-<br />
30 775 239,11<br />
39 994 114,31<br />
3 6 6 3 2 0 38 5 7 1, 8 0<br />
136 012 370,51<br />
4 244 539 579,46<br />
22 024 071 572,25<br />
5 069 943,60<br />
57 434 534,39<br />
93 722 316,72<br />
10 071 188 254,87<br />
6 5 3 1 18 3 2 5, 7 9<br />
333 167 045,95<br />
1 871 728,84<br />
0,00<br />
318 079 551,00<br />
4 4 7 6 80 3 2 0, 3 9<br />
-<br />
447 680 320,39<br />
4 2 6 8 9 5 10 2 0 1, 2 9<br />
6 3 7 5 28 6 5 8, 4 2<br />
-<br />
632 720 701,42<br />
-<br />
4 807 957,00<br />
-<br />
7 1 5 7 7 93 4 4 9, 2 7<br />
646 013 907,71<br />
4 443 835 795,13<br />
22 760 769,35<br />
262 288 930,57<br />
-<br />
95 128 095,02<br />
1 687 765 951,49<br />
141 088 914,20<br />
1 0 2 18 0 0 0, 8 1<br />
7 9 4 6 6 29 0 2 2, 7 0<br />
1 4 6 2 0 24 7 1 5, 8 2<br />
135 812 526,16<br />
1 322 583 768,16<br />
3 628 421,50<br />
1 4 6 2 0 24 7 1 5, 8 2<br />
5 2 0 9 8 1 63 9 3 9, 8 1<br />
FISCAL 2003<br />
GROSS D E P. & PROV. NET NET<br />
4 7 6 4 2 54 55 6 ,5 2<br />
138 372 948,58<br />
4 625 881 607,94<br />
-<br />
6 5 4 30 94 7 ,9 1<br />
-<br />
35 547 259,36<br />
29 883 688,55<br />
3 4 8 4 1 3 91 13 3 ,7 6<br />
136 251 132,73<br />
4 465 956 329,20<br />
22 729 651 785,44<br />
4 062 472,60<br />
73 270 275,07<br />
119 760 430,75<br />
7 312 438 707,97<br />
4 9 2 1 39 29 5 ,7 7<br />
314 625 620,73<br />
165 109 924,04<br />
7 560 000,00<br />
4 843 751,00<br />
2 7 1 8 76 03 0 ,1 6<br />
-<br />
271 876 030,16<br />
4 0 4 3 5 0 91 96 4 ,1 2<br />
6 3 0 4 21 80 6 ,4 2<br />
-<br />
617 263 806,42<br />
-<br />
13 158 000,00<br />
-<br />
6 8 3 2 2 43 22 2 ,1 4<br />
308 853 187,72<br />
4 248 003 717,34<br />
28 111 423,81<br />
528 505 006,41<br />
-<br />
161 688 401,28<br />
1 557 081 485,58<br />
-<br />
6 0 45 99 8 ,6 4<br />
7 4 6 8 7 11 02 7 ,2 0<br />
6 6 3 4 16 68 6 ,0 4<br />
128 434 163,90<br />
530 617 864,96<br />
4 364 657,18<br />
6 6 3 4 16 68 6 ,0 4<br />
4 8 5 6 7 2 19 67 7 ,3 6
EQ U ITY CAPITAL (A)<br />
S TA RTUP CA PITA L<br />
Financial year ended 12/31/2004<br />
L I A B I L I T I E S<br />
MERGER, SHA RE, CO N TRIBUTION PREMIUMS<br />
R E VA L U ATION RESERV E<br />
LEG AL RESERV E S<br />
OTHER RESERV E S<br />
R E TA INED EA RNIN GS<br />
EARN ING S BEIN G A PPRO PRIAT E D<br />
EARN ING S FOR THE YEAR<br />
A S S I M I L ATED EQ UIT Y CAP ITAL (B)<br />
INVESTMEN T SUBSIDIES<br />
R E G U L ATED PRO <strong>VI</strong>SIO NS<br />
FIN AN CE DEBTS (C)<br />
BO ND L OA NS<br />
OTHER FIN AN CE DEBTS<br />
LT. P RO V. CO N TIN G EN T LIABILITIES (D )<br />
PRO <strong>VI</strong>SION S FO R RISKS<br />
PRO <strong>VI</strong>SION S FO R EX PENSES<br />
T R A N S L ATIO N DIFFEREN TIAL LIABILITIES (E)<br />
INCR. IN L O NG- TERM L O AN S<br />
REDUCTION IN FIN AN CE DEBTS<br />
T O TAL I (A+ B+ C+D + E)<br />
CU RRENT LIABILITIES D EBTS (F )<br />
TRA DE CREDITO RS<br />
CUSTOMER CREDIT, A DVA NCES, D WN PYMTS<br />
P E R S O N N E L<br />
SO CIA L BO D IES<br />
S TAT E<br />
TRA NSITION AL O R SU SPEN SE ACCOU NTS<br />
OTHER CREDITO RS<br />
ACCRU AL S LIA BIL ITIES<br />
O THER P RO V. CO N TIN G EN T LIABILITIES (G )<br />
T R A N S L ATIO N DIFF CU RR LIABILITIES (H)<br />
T O TAL II (F+ G +H )<br />
CASH LIABILITIES<br />
DISCO UNT CREDIT<br />
CA SH CREDIT<br />
BA NKS (CRED IT BA LA NCES)<br />
T O TAL III<br />
GRAN D TO TAL (I+ II+III)<br />
FISCAL 2004 FISCAL 2003<br />
8 937 322 884,06<br />
14 545 604 706,62<br />
(5 568 812 698,33)<br />
(39 469 124,23)<br />
8 908 345 413,73<br />
8 908 345 413,73<br />
-<br />
-<br />
-<br />
-<br />
-<br />
0,00<br />
13 716 505 509,80<br />
23 997 600,00<br />
13 692 507 909,80<br />
10 962 314 193,81<br />
10 962 314 193,81<br />
236 902 867,02<br />
236 902 867,02<br />
42 761 390 868,42<br />
7 918 836 233,83<br />
3 105 765 282,56<br />
155 790 890,42<br />
31 921 640,36<br />
65 336 974,68<br />
172 418 361,75<br />
2 313 536 291,88<br />
2 074 066 792,18<br />
10 218 000,81<br />
3 762 195,56<br />
7 932 816 430,20<br />
1 403 956 641,19<br />
1 403 956 641,19<br />
1 403 956 641,19<br />
52 098 163 939,81<br />
-<br />
BALANCE SHEET<br />
8 458 107 048,11<br />
14 026 919 746,44<br />
(5 637 829 295,42)<br />
69 016 597,09<br />
10 471 162 160,41<br />
10 471 162 160,41<br />
-<br />
-<br />
-<br />
-<br />
-<br />
0,00<br />
12 659 786 854,65<br />
61 996 800,00<br />
12 597 790 054,65<br />
9 061 270 695,16<br />
9 061 270 695,16<br />
150 501 953,95<br />
150 501 953,95<br />
40 800 828 712,28<br />
5 917 897 163,14<br />
2 031 345 300,02<br />
120 998 221,43<br />
35 616 922,37<br />
47 162 803,25<br />
78 539 893,10<br />
1 427 916 213,57<br />
2 176 317 809,40<br />
6 045 998,64<br />
-<br />
-<br />
6 006 527,05<br />
5 929 949 688,83<br />
1 836 441 276,25<br />
394 976 875,00<br />
1 441 464 401,25<br />
1 836 441 276,25<br />
48 567 219 677,36<br />
-<br />
Office Nat ion al de l’Electricité > Annual Rep ort<br />
5 6-57
INCOME AND EXPENDITURE ACCOUNT (EXCLUSIVE OF TAX)<br />
INCOME AND EXPENDITURE ACCOUNT<br />
( EXCLUSIVE OF TA X )<br />
1 OPERATING REVENUES<br />
- sales of goods as are<br />
- sales of goods & ser vices produced<br />
- change in stocks of products<br />
- fixed assets produced by the firm for itself<br />
- operating subsidies<br />
- other operating revenues<br />
- operating write-backs & transfer of expenses<br />
TOTAL I<br />
2 OPERATING EXPENSES<br />
- purchases of goods resold<br />
- purchases of materials and supplies used<br />
- other external expenses<br />
- tax expenses<br />
- payr oll costs<br />
- other operating expenses<br />
- operating allowances<br />
TOTAL II<br />
3 OPERATING PROFIT/ LOSS (I-II)<br />
4 NON-OPERATING REVENUES<br />
- reve nues from equity inve stme nts and othe r long te rm loa ns<br />
- foreign exchange gains<br />
- interest and other financial revenues<br />
- financial write-backs and transfer of expenses<br />
TOTAL IV<br />
5 NON-OPERATING EXPENSES<br />
- interest expenses<br />
- foreign exchange losses<br />
- other financial expenses<br />
- financial allowances<br />
TOTAL V<br />
6 NON-OPERATING PROFIT/LOSS (IV-V)<br />
7 CURRENT PROFIT/LOSS (III+<strong>VI</strong>)<br />
CURRENT PROFIT-LOSS (BROUGHT FORW ARD)<br />
8 NON-CURRENT REVENUES<br />
- revenues from disposals of assets<br />
- equilibrium subsidies<br />
- write-backs on investment subsidies<br />
- other non-current revenues<br />
- non-curr ent write-backs and transfer of expenses<br />
TOTAL <strong>VI</strong>II<br />
9 CHARGES NON COURANTES<br />
- valeurs nettes d'amortissement des immobilisations cédées<br />
- subventions accordées<br />
- autr es charges non courantes<br />
- dotations non courantes aux amortissements et provisions<br />
TOTAL IX<br />
10 NON-CURRENT PROFIT (<strong>VI</strong>II-IX)<br />
PRE-TAX PROFT/LOSS (<strong>VI</strong>I+X)<br />
CORPORATE TAX<br />
NET EARNING/LOSS (XI-XII)<br />
TOTAL REVENUES (I+IV+<strong>VI</strong>II)<br />
TOTAL EXPENSES (II+V+IX+XII)<br />
NET EARNING/LOSS (T.Revenues-T.expenses)<br />
SPECIFIC TO TH E YEAR<br />
1<br />
-<br />
12 124 835 472,40<br />
107 644 300,56<br />
-<br />
1 754 199,35<br />
288 676 511,50<br />
12 522 910 483,81<br />
-<br />
7 092 465 413,69<br />
327 527 531,06<br />
56 478 076,57<br />
1 571 093 614,70<br />
0,00<br />
2 773 178 406,12<br />
11 820 743 042,14<br />
TRANSACTIONS<br />
-<br />
59 985 853,33<br />
5 567 909,18<br />
277 922 028,80<br />
343 475 791,31<br />
528 890 778,58<br />
43 171 073,32<br />
3 337,32<br />
457 898 321,20<br />
1 029 963 510,42<br />
334 257 757,42<br />
-<br />
1 406 749 240,22<br />
54 568 099,41<br />
-<br />
1 795 575 097,05<br />
-<br />
13 944 345,71<br />
32 126 430,48<br />
1 630 505 504,42<br />
1 676 576 280,61<br />
14 661 961 372,17<br />
14 562 017 415,17<br />
99 943 957,00<br />
C O N C E R N I N G<br />
PRE<strong>VI</strong>OU S YEARS<br />
2<br />
-<br />
(82 593 557,91)<br />
-<br />
-<br />
0,00<br />
1 724 001,80<br />
(80 869 556,11)<br />
-<br />
9 206 031,23<br />
7 075 142,15<br />
5 359 829,80<br />
184 849,86<br />
0,00<br />
-<br />
21 825 853,04<br />
-<br />
278 154,86<br />
680 135,42<br />
0,00<br />
958 290,28<br />
8 778 622,23<br />
1 095 879,42<br />
2 357 449,18<br />
-<br />
12 231 950,83<br />
-<br />
-<br />
-<br />
28 768 491,28<br />
-<br />
28 768 491,28<br />
-<br />
16 518 017,42<br />
37 694 485,39<br />
-<br />
54 212 502,81<br />
(51 142 774,55)<br />
88 270 306,68<br />
(139 413 081,23)<br />
TOTALS FOR<br />
FISCAL 2004<br />
3=1+2<br />
-<br />
12 042 241 914,49<br />
107 644 300,56<br />
-<br />
1 754 199,35<br />
290 400 513,30<br />
12 442 040 927,70<br />
-<br />
7 101 671 444,92<br />
334 602 673,21<br />
61 837 906,37<br />
1 571 278 464,56<br />
0,00<br />
2 773 178 406,12<br />
11 842 568 895,18<br />
599 472 032,52<br />
-<br />
60 264 008,19<br />
6 248 044,60<br />
277 922 028,80<br />
344 434 081,59<br />
-<br />
537 669 400,81<br />
44 266 952,74<br />
2 360 786,50<br />
457 898 321,20<br />
1 042 195 461,25<br />
(697 761 379,66)<br />
(98 289 347,14)<br />
334 257 757,42<br />
-<br />
1 406 749 240,22<br />
83 336 590,69<br />
-<br />
1 824 343 588,33<br />
-<br />
30 462 363,13<br />
69 820 915,87<br />
1 630 505 504,42<br />
1 730 788 783,42<br />
93 554 804,91<br />
(4 734 542,23)<br />
34 734 582,00<br />
(39 469 124,23)<br />
14 610 818 597,62<br />
14 650 287 721,85<br />
(39 469 124,23)<br />
TOTALS FOR<br />
FISCAL 2003<br />
4<br />
-<br />
11 989 351 560,68<br />
117 493 270,24<br />
-<br />
1 930 599,41<br />
229 746 270,34<br />
12 338 521 700,67<br />
-<br />
6 922 142 345,69<br />
311 123 763,96<br />
53 225 420,28<br />
1 462 046 135,74<br />
261 986,03<br />
2 992 211 761,93<br />
11 741 011 413,63<br />
597 510 287,04<br />
-<br />
90 105 473,88<br />
13 395 232,71<br />
185 429 196,85<br />
288 929 903,44<br />
595 258 428,43<br />
41 998 055,54<br />
67 488,35<br />
277 922 028,80<br />
915 246 001,12<br />
(626 316 097,68)<br />
(28 805 810,64)<br />
(28 805 810,64)<br />
338 562 176,96<br />
-<br />
260 678 541,09<br />
91 206 329,83<br />
-<br />
690 447 047,88<br />
-<br />
11 229 777,05<br />
22 884 177,10<br />
525 247 442,00<br />
559 361 396,15<br />
131 085 651,73<br />
102 279 841,09<br />
33 263 244,00<br />
69 016 597,09<br />
13 317 898 651,99<br />
13 248 882 054,90<br />
69 016 597,09
I<br />
I I<br />
I I I<br />
I V<br />
V<br />
V I<br />
V I I<br />
V I I I<br />
I X<br />
X<br />
I<br />
I I<br />
1<br />
2<br />
3<br />
4<br />
5<br />
6<br />
7<br />
8<br />
9<br />
10<br />
11<br />
12<br />
13<br />
14<br />
15<br />
1<br />
2<br />
3<br />
4<br />
5<br />
6<br />
7<br />
8<br />
9<br />
10<br />
STATEMENT MANAGEMENT BALANCES<br />
-<br />
=<br />
+<br />
-<br />
=<br />
+<br />
-<br />
-<br />
=<br />
=<br />
+<br />
-<br />
+<br />
-<br />
=<br />
+<br />
=<br />
+<br />
-<br />
=<br />
+<br />
+<br />
+<br />
-<br />
-<br />
-<br />
-<br />
+<br />
-<br />
S TAT E M E N TM A N A G E M E N B TA<br />
L A N C E S<br />
.Sa le s of g ood s (a s a re )<br />
. P u rc ha se s o f g oo ds re s o l d<br />
G RO SS MARGIN / SALE AS A R E<br />
PRO D UCTIO N O F T H E Y EAR (3 +4 + 5)<br />
.Sa le s of g ood s a nd se rvic e s pro d u c e d<br />
.Cha n ge stoc ks of pro d u c t s<br />
.A sse ts produ ce d for it se lf<br />
CO N SUMPTIO N FO R TH E Y EAR (6+ 7 )<br />
. P u rc ha se s o f m a te ria ls a n d supp lie s<br />
.O t he r e xte rna l e xpe nse s<br />
A D D E D VA LUE (I+ II-III)<br />
.O p e ra tin g subsidie s<br />
. Ta x expe n se s<br />
. P a y ro ll co ast s<br />
G R O S SO P E R AT I N G P R O F I T<br />
G R O S SO P E R ATIN G D EF ICIT<br />
.O t he r op e ra t in g re v e n u e s<br />
.O t he r op e ra t in g e xp e nse s<br />
.O p e ra tin g w rit e-b a cks a nd t ra n sfe r of e xpe nse s<br />
.O p e ra tin g a llow a n ce s<br />
O P E R ATIN G PRO FIT/LO SS<br />
N O N - O P E R ATING PRO FIT/LO SS<br />
CURREN T PRO FIT/ LO SS<br />
N O N -CURREN T P RO F IT/LO SS<br />
. Co rpo rate ta x<br />
E A R N I N GF O R T H E Y E A R<br />
II CASH FLOW - SELF FINANCING<br />
.Earn in gs for t he ye a r<br />
. P rofit +<br />
. Lo ss -<br />
.O p e ra tin g a llow a n ce s (1)<br />
.Fin an cia l a llow a n ce s (1)<br />
. N o n - c u r ren t a llo w a nce s (1)<br />
.O p e ra tin g w rit e-b a cks (2 ) (3)<br />
.Fin an cia l w rite -ba c ks (2)<br />
. N o n - c u r ren t w rit e -ba cks (2) (3)<br />
.Reve nu e s from dispo sa ls of a sse ts<br />
.N PV of a sse ts dispo se d o f<br />
= CASH FLOW<br />
. P rofit dist ribu tion<br />
S E L F - F I N A N C I N G<br />
(1) Excluding allowances for current assets and liabilities<br />
(2) Excluding write-backs for current assets and liabilities<br />
(3) Including write-backs on investment subsidies<br />
2004 2003<br />
0,00<br />
0,00<br />
0,00<br />
12 149 886 215,05<br />
12 042 241 914,49<br />
107 644 300,56<br />
7 436 274 118,13<br />
101 671 444,92<br />
334 602 673,21<br />
4 713 612 096,92<br />
0,00<br />
61 837 906,37<br />
1 571 278 464,56<br />
3 080 495 725,99<br />
0,00<br />
1 754 199,35<br />
0<br />
290 400 513,30<br />
2 773 178 406,12<br />
599 472 032,52<br />
(697 761 379,66)<br />
(98 289 347,14)<br />
93 554 804,91<br />
34 734 582,00<br />
(39 469 124,23)<br />
(39 469 124,23)<br />
0,00<br />
(39 469 124,23)<br />
2 728 314 141,90<br />
447 680 320,39<br />
1 630 505 504,42<br />
97 381 086,05<br />
271 876 030,16<br />
1 640 482 053,12<br />
43 776 383,80<br />
0,00<br />
2 713 515 289,35<br />
0,00<br />
2 713 515 289,35<br />
0,00<br />
0,00<br />
0,00<br />
12 106 844 830,92<br />
11 989 351 560,68<br />
117 493 270,24<br />
7 233 266 109,65<br />
6 922 142 345,69<br />
311 123 763,96<br />
4 873 578 721,27<br />
0,00<br />
53 225 420,28<br />
1 462 046 135,74<br />
3 358 307 165,25<br />
0,00<br />
1 930 599,41<br />
261 986,03<br />
229 746 270,34<br />
2 992 211 761,93<br />
597 510 287,04<br />
(626 316 097,68)<br />
(28 805 810,64)<br />
131 085 651,73<br />
33 263 244,00<br />
69 016 597,09<br />
69 016 597,09<br />
69 016 597,09<br />
0,00<br />
2 755 458 042,90<br />
271 876 030,16<br />
525 247 442,00<br />
97 771 086,05<br />
182 771 682,62<br />
494 411 353,99<br />
48 080 803,34<br />
0,00<br />
2 798 563 186,15<br />
0,00<br />
2 798 563 186,15<br />
Office Nat ion al de l’Electricité > Annual Rep ort<br />
5 8-59
S TATEMENT OF FINANCING FOR FISCAL 2004<br />
SYNTHESIS<br />
O F THE BALANCE MASSES<br />
1 INVESTED CAPITAL (1)<br />
2 LESS FIXED ASSETS<br />
3 = OPERATING WO R<strong>KING</strong> CAPITAL (1-2) (A)<br />
4 CURRENT ASSETS<br />
5 LESS CURRENT LIABILITIES ( 2)<br />
6 = OVERALL FIN ANCING REQUIREMENTS (4-5) (B)<br />
7 NET CASH (ASSETS-LIABILITIES) =A-B<br />
II- APPLICAT I O N S<br />
AND SOURCES<br />
I- STABLE SO U RCES FO R TH E YEAR<br />
SELF-FINA NCIN G (A)<br />
. Ca sh flow<br />
- Pro fit distribut io n<br />
DISP O SA LS AN D RED UCT. O F ASSETS (B)<br />
. Re duc tio n o f t a ng ib le a sse ts<br />
. Disposa ls of ta ng ible a sse ts<br />
. Disposa ls of fina nc ia l a sse ts<br />
. Pa yba c k on lon g-te rm lo a ns<br />
IN CR, EQ UIT Y CAP, & ASS CA P (C)<br />
. I n c re a se of c a pita l c on trib ut io n<br />
. Assimila te d e qu it y ca p it a l<br />
IN CR, FINAN C. D EBTS (D )<br />
(Ne t of p re mium on re d e m p t i o n )<br />
T O TAL STABLE SO URCES (A +B+ C+ D )<br />
II- STABLE APPLICATIO NS FO R THE Y EAR<br />
ACQ U IS. AN D IN CR. O F ASSETS (E)<br />
. A cq uisit ion of int a ngib le a sset s<br />
. A cq uisit ion of ta n gible a sse t s<br />
. A cq uisit ion of fina n cia l a sse ts<br />
. Inc re a se of lo ng -te rm loa n s<br />
R E PAYMEN T O F EQ UITY CAPITAL (F )<br />
R E PAYMEN T O F F IN ANC. D EBTS (G )<br />
NO N -PRO D UCTIVE APPLICATIO NS (H)<br />
T O TAL II- STABLE AP PLICATIO N S (E+F +G + H)<br />
III- CHANGE IN OVERALL FINANCING REQUIREMENTS (B F G)<br />
I V- CH AN GE IN CASH<br />
GRAN D TO TA L<br />
FISCAL 200 4<br />
- A -<br />
42 761 390 868,42<br />
42 689 510 201,29<br />
71 880 667,13<br />
7 946 629 022,70<br />
7 932 816 430,20<br />
13 812 592,50<br />
58 068 074,63<br />
FISCAL 20 04<br />
FISCAL 20 03<br />
- B -<br />
APPLICATIONS SOURCES<br />
4 661 652 115,99<br />
10 110 425,76<br />
4 446 300 369,39<br />
142 437 604,80<br />
62 803 716,04<br />
0,00<br />
1 055 446 247,61<br />
94 804 559,67<br />
5 811 902 923,27<br />
0,00<br />
1 231 092 664,84<br />
7 042 995 588,11<br />
40 800 828 712,28<br />
40 435 091 964,12<br />
365 736 748,16<br />
7 468 711 027,20<br />
5 929 949 688,83<br />
1 538 761 338,37<br />
(1 173 024 590,21)<br />
2 713 515 289,35<br />
2 713 515 289,35<br />
88 038 674,62<br />
0,00<br />
43 776 383,80<br />
0,00<br />
44 262 290,82<br />
693 731 352,67<br />
518 684 960,18<br />
175 046 392,49<br />
2 022 761 525,60<br />
5 518 046 842,24<br />
1 524 948 745,87<br />
0,00<br />
7 042 995 588,11<br />
APPLICATIONS<br />
- C -<br />
VA R I ATION A - B<br />
0,00<br />
2 254 418 237,17<br />
293 856 081,03<br />
477 917 995,50<br />
0,00<br />
0,00<br />
1 231 092 664,84<br />
FISCAL 2003<br />
SOURCES<br />
- D -<br />
APPLICATIONS SOURCES<br />
3 441 088 289,67<br />
6 162 525,67<br />
3 273 562 269,01<br />
114 785 493,82<br />
46 578 001,17<br />
0,00<br />
1 274 725 410,34<br />
119 411 559,26<br />
4 835 225 259,27<br />
1 027 543 015,22<br />
0,00<br />
5 862 768 274,49<br />
1 960 562 156,14<br />
0,00<br />
0,00<br />
0,00<br />
2 002 866 741,37<br />
1 524 948 745,87<br />
0,00<br />
2 798 563 186,15<br />
2 798 563 186,15<br />
135 229 852,37<br />
46 978 515,00<br />
48 080 803,34<br />
0,00<br />
40 170 534,03<br />
796 819 514,48<br />
409 565 994,48<br />
387 253 520,00<br />
1 448 214 573,11<br />
5 178 827 126,11<br />
0,00<br />
683 941 148,38<br />
5 862 768 274,49
Office Nat ion al de l’Electricité > Annual Rep ort<br />
6 0-61
CONTACT REGISTER<br />
OFFICE NATIONAL DE L'ELECTRICITE<br />
Headquarters: 65, rue Othman Ben Affan, Casablanca<br />
Phone : 022 66 80 80<br />
Fax : 022 22 00 38<br />
Site web : www.one.org.ma<br />
RURAL ELECTRIFICATION MANAGEMENT<br />
Address : Boulevar d Ahl Loghlam - Casablanca<br />
Phone : 022 75 45 01<br />
Fax : 022 75 45 07<br />
CASABLANCA<br />
Casablanca Regional Supply Division<br />
Address : Immeuble Fadila, angle Vanzeland et Bd Abdelmoumen<br />
Phone : 022 48 00 82<br />
Fax : 022 47 35 92<br />
Casablanca Supply Agency<br />
Address : 139, angle avenue Mers Sultan et rue Zarhoune - Casablanca<br />
Phone : 022 20 31 48<br />
Fax : 022 20 33 06
Azilal Supply Agency<br />
Address : Lotissement Al Wahda - Azilal<br />
Phone : 023 45 82 18<br />
Fax : 023 45 86 31<br />
Béni Mellal Supply Agency<br />
Address : Immeuble Tahiri, Boulevard Mohammed V – Béni Mellal<br />
Phone : 023 48 35 71<br />
Fax : 023 48 90 25<br />
Benslimane Supply Agency<br />
Address : 182, Boulevard Hassan II - Benslimane<br />
Phone : 023 29 18 90<br />
Fax : 023 29 74 17<br />
El Jadida Supply Agency<br />
Address : 40, avenue Chouhada – El Jadida<br />
Phone : 023 37 38 91<br />
Fax : 023 37 38 80<br />
Khouribga Supply Agency<br />
Address : 16, rue Moulay Abdellah - Khouribga<br />
Phone : 023 49 36 48<br />
Fax : 023 49 36 53<br />
Settat Supply Agency<br />
Address : 126, Boulevard Mohammed V - Settat<br />
Phone : 023 40 19 77<br />
Fax : 023 40 15 50<br />
MARRAKECH<br />
Mar rakech Regional Supply Division<br />
Address : Route Souihla n°10 bis, 4 DMT Targa – Marrakech<br />
Phone : 044 44 69 96 - 044 44 69 98<br />
Fax : 044 44 70 11<br />
Mar rakech Supply Agency<br />
Address : Quartier industriel - route d'Essaouira – Marrakech<br />
Phone : 044 49 51 51 - 044 49 04 65<br />
Fax : 044 49 00 47<br />
Al Haouz Supply Agency<br />
Address : Tahanaout Al haouz<br />
Phone : 044 48 43 67 - 044 48 43 43<br />
Fax : 044 48 43 34<br />
El Kalâa Supply Agency<br />
Address : Route de Béni Mellal - El Kelaâ<br />
Phone : 044 41 22 74 - 044 41 22 38<br />
Fax : 044 41 25 35<br />
Essaouira Supply Agency<br />
Address : Quartier industriel - Boulevard Moulay Hicham – Essaouira<br />
Phone : 044 47 59 85<br />
Fax : 044 47 46 29<br />
Safi Supply Agency<br />
Address : Rue Ahmed Taieb Benhima, Immeuble Saâd – Safi<br />
Phone : 044 63 08 39<br />
Fax : 044 63 08 44<br />
Chichaoua Supply Agency<br />
Address : Quartier administratif – Chichaoua<br />
Phone : 044 35 22 22<br />
Fax : 044 35 33 40<br />
AGADIR<br />
Agadir Regional Supply Division<br />
Address : Avenue Abderrahim Bouâbid<br />
Phone : 048 22 07 19<br />
Fax : 048 22 07 30<br />
Agadir Supply Agency<br />
Address : n° 72 Bloc 101 Cité Charaf - Agadir<br />
Phone : 048 22 06 47<br />
Fax : 048 22 06 90<br />
Laâyoune Supply Agency<br />
Address : Hay Moulay Rachid <strong>ONE</strong> - Laâyoune<br />
Phone : 048 89 31 53<br />
Fax : 048 89 41 29<br />
Guelmim Supply Agency<br />
Address : Boulevard Mohamed <strong>VI</strong> cité <strong>ONE</strong> - Guelmim<br />
Phone : 048 87 30 30<br />
Fax : 048 87 20 26<br />
Tan Tan Supply Agency<br />
Address : <strong>ONE</strong> Rue de la Plage - Tan Tan<br />
Phone : 048 76 05 66<br />
Fax : 048 76 02 73<br />
Office Nat ion al de l’Electricité > Annual Rep ort<br />
6 2-63
Tiznit Supply Agency<br />
Address : Quartier administratif n° 2 Cité <strong>ONE</strong> - Tiznit<br />
Phone : 048 86 50 33<br />
Fax : 048 86 33 15<br />
Inezgane Supply Agency<br />
Address : Riad Assalam n° 13 D - Agadir<br />
Phone : 048 83 60 63<br />
Fax : 048 83 60 84<br />
Ouarzazate Supply Agency<br />
Address : Cité <strong>ONE</strong> Cité Administrative - Ouarzazate<br />
Phone : 044 88 52 96<br />
Fax : 044 88 29 05<br />
Taroudant Supply Agency<br />
Address : Cité <strong>ONE</strong> Lamhita - Taroudant<br />
Phone : 048 85 35 85<br />
Fax : 048 85 03 30<br />
Biougra Supply Agency<br />
Address : 10, Rue Soulaimane Agadir Arroudani - Les Amicales<br />
Phone : 048 81 97 77<br />
Fax : 048 81 97 76<br />
Zagora Supply Agency<br />
Address : Cité <strong>ONE</strong> Hay Ennakhil - Zagora<br />
Phone : 044 84 63 23<br />
Fax : 044 84 63 25<br />
Dakhla Supply Agency<br />
Address : Rue El Aatfe Bloc Rouge - Dakhla<br />
Phone : 048 89 81 23<br />
Fax : 048 89 06 36<br />
Tata Supply Agency<br />
Address : Cité <strong>ONE</strong> Boulevard Mohamed V - Tata<br />
Phone : 048 80 20 32<br />
Fax : 048 80 20 32<br />
KENITRA<br />
Kénitra Regional Supply Division<br />
Address : 16, rue Ibn El Benna<br />
Phone : 037 37 73 44<br />
Fax : 037 37 73 45<br />
Chefchaouen Supply Agency<br />
Address : Quartier administratif, route de Tétouan<br />
Phone : 039 98 64 05<br />
Fax : 039 98 69 84<br />
Kénitra Supply Agency<br />
Address : Avenue Mohamed Diouri, place de la gare<br />
Phone : 037 37 48 04<br />
Fax : 037 37 82 64<br />
Khémisset Supply Agency<br />
Address : 94, rue Kadi Ayad<br />
Phone : 037 55 22 66<br />
Fax : 037 55 23 20<br />
Sidi Kacem Supply Agency<br />
Address : rue 23, immeuble 20<br />
Phone : 037 59 33 37<br />
Fax : 037 59 37 63<br />
Tétouan Supply Agency<br />
Address : Saniat R'mel, rue Mohammédia<br />
Phone : 039 97 43 54<br />
Fax : 039 97 43 58<br />
Tanger Supply Agency<br />
Address : Rue Mimosas, immeuble Najd, 1er étage<br />
Phone : 039 94 59 58<br />
Fax : 039 94 59 54<br />
MEKNES<br />
Meknes Regional Supply Division<br />
Address : Boulevard Moulay Youssef<br />
Phone : 055 52 56 57<br />
Fax : 055 51 35 57<br />
Errachidia Supply Agency<br />
Address : Immeuble des habous, Boutalamine<br />
Phone : 055 57 23 67<br />
Fax : 055 57 03 44<br />
El Hajeb Supply Agency<br />
Address : Quartier administratif<br />
Phone : 055 54 28 75<br />
Fax : 055 54 32 40
Ifrane Supply Agency<br />
Address : Poste 60/22 kV, rue de Meknes<br />
Phone : 055 56 72 74<br />
Fax : 055 56 72 73<br />
Khénifra Supply Agency<br />
Address : Quartier Younes, boulevard de la marche verte<br />
Phone : 055 38 54 44<br />
Fax : 055 38 54 43<br />
Meknès Supply Agency<br />
Address : Boulevar d Moulay Youssef<br />
Phone : 055 40 27 31<br />
Fax : 055 52 08 47<br />
FES<br />
Fés Regional Supply Division<br />
Address : Centre commercial Anass, route Aïn Smen<br />
Phone : 055 60 04 63<br />
Fax : 055 60 41 74<br />
Al Hoceima Supply Agency<br />
Address : Rue Abdelkrim El Khattabi<br />
Phone : 039 98 03 22<br />
Fax : 039 98 23 39<br />
Taza Supply Agency<br />
Address : Angle Bd Med V et Allal El Fassi<br />
Phone : 055 67 20 22<br />
Fax : 055 67 27 27<br />
Fès Supply Agency<br />
Address : 12 rue Imam Ali<br />
Phone : 055 62 62 85<br />
Fax : 055 62 53 00<br />
Sefrou Supply Agency<br />
Address : Bd Med V Route de Boulemane<br />
Phone : 055 66 08 52<br />
Fax : 055 66 00 69<br />
Taounate Supply Agency<br />
Address : Avenue Oued Eddahab<br />
Phone : 055 68 88 56<br />
Fax : 055 88 68 57<br />
Missour Supply Agency<br />
Address : Quartier Sidi Boutayeb<br />
Phone : 055 58 56 16<br />
Fax : 055 68 41 00<br />
OUJDA<br />
Oujda Regional Supply Division<br />
Address : Angle Bd Derfoufi et Ibn Sina – Oujda<br />
Phone : 056 71 16 88<br />
Fax : 056 68 44 28<br />
Oujda Supply Agency<br />
Address : Angle Bd Derfoufi et Ibn Sina – Oujda<br />
Phone : 056 66 22 91<br />
Fax : 056 70 36 94<br />
Nador Supply Agency<br />
Address : Boulevar d Youssef Bnou Tachfine – Nador<br />
Phone : 056 33 02 83<br />
Fax : 056 33 32 72<br />
Berkane Supply Agency<br />
Address : Boulevar d Chouhada – Berkane<br />
Phone : 056 61 67 48<br />
Fax : 056 64 27 76<br />
Jérada Supply Agency<br />
Address : Boulevar d Hassan II – Jérada<br />
Phone : 056 82 08 16<br />
Fax : 056 82 08 17<br />
Taourirt Supply Agency<br />
Address : Rue Zag Hay Al Massira – Taourirt<br />
Phone : 056 69 94 00<br />
Fax : 056 69 96 36<br />
Bouarfa Supply Agency<br />
Address : Place de la mosquée, quartier administratif - Bouarfa<br />
Phone : 056 79 82 39<br />
Fax : 056 64 27 76<br />
Office Nat ion al de l’Electricité > Annual Rep ort<br />
6 4-65