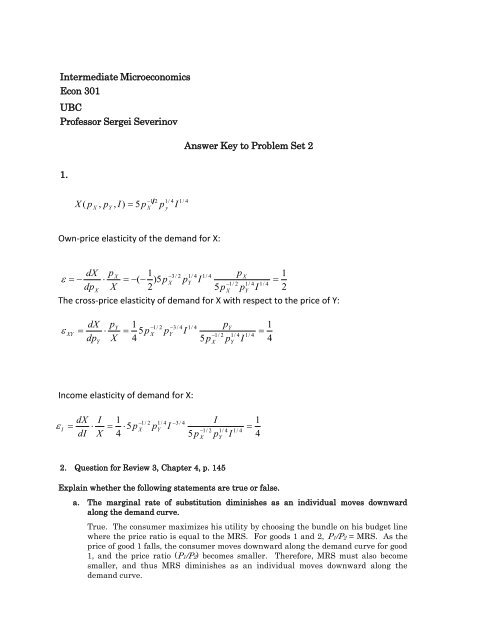
Intermediate Microeconomics Econ 301 UBC Professor Sergei ...
Intermediate Microeconomics Econ 301 UBC Professor Sergei ...
Intermediate Microeconomics Econ 301 UBC Professor Sergei ...

Create successful ePaper yourself
Turn your PDF publications into a flip-book with our unique Google optimized e-Paper software.
<strong>Intermediate</strong> <strong>Microeconomics</strong><br />
<strong>Econ</strong> <strong>301</strong><br />
<strong>UBC</strong><br />
<strong>Professor</strong> <strong>Sergei</strong> Severinov<br />
1.<br />
1<br />
2 1/<br />
4 1/<br />
4<br />
X ( p X , pY<br />
, I)<br />
5p<br />
X p y I<br />
Own-price elasticity of the demand for X:<br />
Answer Key to Problem Set 2<br />
dX<br />
<br />
dpX<br />
pX<br />
<br />
X<br />
1 3/<br />
2 1/<br />
4 1/<br />
4 pX<br />
(<br />
) 5p<br />
X pY<br />
I 1/<br />
2 1/<br />
4 1/<br />
4<br />
2<br />
5p<br />
X pY<br />
I<br />
1<br />
<br />
2<br />
The cross-price elasticity of demand for X with respect to the price of Y:<br />
XY<br />
dX<br />
p<br />
1<br />
5p<br />
4<br />
Y<br />
1/<br />
2 3/<br />
4 1/<br />
4<br />
<br />
X pY<br />
I 1/<br />
2<br />
dpY<br />
X<br />
5p<br />
X<br />
Income elasticity of demand for X:<br />
<br />
I<br />
dX<br />
I<br />
1<br />
5<br />
p<br />
4<br />
1/<br />
2 1/<br />
4 3<br />
/ 4<br />
<br />
X pY<br />
I<br />
1/<br />
2<br />
dI X<br />
5p<br />
X<br />
2. Question for Review 3, Chapter 4, p. 145<br />
Y<br />
1/<br />
4<br />
Y<br />
Explain whether the following statements are true or false.<br />
I<br />
p<br />
p<br />
p<br />
1/<br />
4<br />
Y<br />
I<br />
a. The marginal rate of substitution diminishes as an individual moves downward<br />
along the demand curve.<br />
I<br />
1/<br />
4<br />
1/<br />
4<br />
<br />
True. The consumer maximizes his utility by choosing the bundle on his budget line<br />
where the price ratio is equal to the MRS. For goods 1 and 2, P1/P2 = MRS. As the<br />
price of good 1 falls, the consumer moves downward along the demand curve for good<br />
1, and the price ratio (P1/P2) becomes smaller. Therefore, MRS must also become<br />
smaller, and thus MRS diminishes as an individual moves downward along the<br />
demand curve.<br />
<br />
1<br />
4<br />
1<br />
4
. The level of utility increases as an individual moves downward along the demand<br />
curve.<br />
True. As the price of a good falls, the budget line pivots outward, and the consumer<br />
is able to move to a higher indifference curve.<br />
c. Engel curves always slope upwards.<br />
False. If the good is inferior, then as income increases, quantity demanded<br />
decreases, and therefore the Engel curve slopes downwards.<br />
3. Question for Review 6, Chapter 4, p. 145<br />
Suppose that a consumer spends a fixed amount of income per month on the following pairs of goods:<br />
a. tortilla chips and salsa<br />
b. tortilla chips and potato chips<br />
c. movie tickets and gourmet coffee<br />
d. travel by bus and travel by subway<br />
If the price of one of the goods increases, explain the effect on the quantity demanded of each of the<br />
goods. In each pair, which are likely to be complements and which are likely to be substitutes?<br />
a. If the price of tortilla chips increases, the consumer will demand fewer tortilla<br />
chips. Since tortilla chips and salsa are complements, the demand curve for salsa<br />
will decrease (shift to the left), and the consumer will demand less salsa.<br />
b. If the price of tortilla chips increases, the consumer will demand fewer tortilla<br />
chips. Since tortilla chips and potato chips are substitutes, the demand for potato<br />
chips will increase (the demand curve will shift to the right), and the consumer will<br />
demand more potato chips.<br />
c. The consumer will demand fewer movies after the price increase. You might think<br />
the demands for movies and gourmet coffee would be independent of each other.<br />
However, because the consumer spends a fixed amount on the two, the demand for<br />
coffee will depend on whether the consumer spends more or less of her fixed budget<br />
on movies after the price increase. If the consumer’s demand elasticity for movie<br />
tickets is elastic, she will spend less on movies and, therefore, more of her fixed<br />
income will be available to spend on coffee. In this case, her demand for coffee<br />
increases, and she buys more gourmet coffee. The goods are substitutes in this<br />
situation. If her demand for movies is inelastic, however, she will spend more on<br />
movies after the price increase and, therefore, less on coffee. In this case, she will<br />
buy less of both goods in response to the price increase for movies, so the goods are<br />
complements. Finally, if her demand for movies is unit elastic, she will spend the<br />
same amount on movies and therefore will not change her spending on coffee. In this<br />
case, the goods are unrelated, and the demand curve for coffee is unchanged.<br />
d. If the price of bus travel increases, the amount of bus travel demanded will fall,<br />
and the demand for subway rides will rise, because travel by bus and subway are<br />
substitutes. The demand curve for subway rides will shift to the right.<br />
4. Question for Review 7, Chapter 4, p. 145
Which of the following events would cause a movement along the demand curve for U.S. produced<br />
clothing, and which would cause a shift in the demand curve?<br />
a. the removal of quotas on the importation of foreign clothes<br />
The removal of quotas will allow U.S. consumers to buy more foreign clothing. Because<br />
foreign produced goods are substitutes for domestically produced goods, the removal of<br />
quotas will result in a decrease in demand (a shift to the left) for U.S. produced clothes.<br />
There could be a smaller secondary effect also. When the quotas are removed, the total<br />
supply of clothing will increase, causing clothing prices to fall. The drop in clothing<br />
prices will lead consumers to buy more U.S. produced clothing, which is a movement<br />
along the demand curve.<br />
b. an increase in the income of U.S. citizens<br />
When income rises, expenditures on normal goods such as clothing increase, causing<br />
the demand curve to shift out to the right.<br />
c. a cut in the industry’s costs of producing domestic clothes that is passed on to the market in<br />
the form of lower prices<br />
A cut in an industry’s costs will shift the supply curve out. The equilibrium price will<br />
fall and quantity demanded will increase. This is a movement along the demand curve.<br />
5. Exercise 3, Ch 4, p 146<br />
Jane always gets twice as much utility from an extra ballet ticket as she does from an extra<br />
basketball ticket, regardless of how many tickets of either type she has. Draw Jane’s incomeconsumption<br />
curve and her Engel curve for ballet tickets.<br />
Ballet tickets and basketball tickets are perfect substitutes for Jane. Therefore, she<br />
will consume either all ballet tickets or all basketball tickets, depending on the two<br />
prices. As long as ballet tickets are less than twice the price of basketball tickets, she<br />
will choose all ballet. If ballet tickets are more than twice the price of basketball<br />
tickets, she will choose all basketball. This can be determined by comparing the<br />
marginal utility per dollar for each type of ticket, where her marginal utility from<br />
another ballet ticket is 2 times her marginal utility from another basketball ticket<br />
regardless of the number of tickets she has. Her income-consumption curve will then<br />
lie along the axis of the good that she chooses. As income increases and the budget<br />
line shifts out, she will buy more of the chosen good and none of the other good. Her<br />
Engel curve for the good chosen is an upward-sloping straight line, with the number<br />
of tickets equal to her income divided by the price of the ticket. For the good not<br />
chosen, her Engel curve lies on the vertical (income) axis because she will never<br />
purchase any of those tickets regardless of how large her income becomes.<br />
6. Exercise 6, Ch 4, p 146<br />
Two individuals, Sam and Barb, derive utility from the hours of leisure (L) they consume and from<br />
the amount of goods (G) they consume. In order to maximize utility, they need to allocate the 24
hours in the day between leisure hours and work hours. Assume that all hours not spent working<br />
are leisure hours. The price of a good is equal to $1 and the price of leisure is equal to the hourly<br />
wage. We observe the following information about the choices that the two individuals make:<br />
Sam Barb Sam Barb<br />
Price of G Price of L L (hours) L (hours) G ($) G ($)<br />
1 8 16 14 64 80<br />
1 9 15 14 81 90<br />
1 10 14 15 100 90<br />
1 11 14 16 110 88<br />
Graphically illustrate Sam’s leisure demand curve and Barb’s leisure demand curve. Place price on<br />
the vertical axis and leisure on the horizontal axis. Given that they both maximize utility, how can<br />
you explain the difference in their leisure demand curves?<br />
It is important to remember that less leisure implies more hours spent working.<br />
Sam’s leisure demand curve is downward sloping. As the price of leisure (the wage)<br />
rises, he chooses to consume less leisure and thus spend more time working at a<br />
higher wage to buy more goods. Barb’s leisure demand curve is upward sloping. As<br />
the price of leisure rises, she chooses to consume more leisure (and work less) since<br />
her working hours are generating more income per hour. See the leisure demand<br />
curves below.<br />
Price<br />
11<br />
10<br />
9<br />
8<br />
Leisure Demand for Sam<br />
14 15 16<br />
Leisure<br />
Price<br />
Leisure Demand for Barb<br />
Leisure<br />
This difference in demand can be explained by examining the income and<br />
substitution effects for the two individuals. The substitution effect measures the<br />
effect of a change in the price of leisure, keeping utility constant (the budget line<br />
rotates along the current indifference curve). Since the substitution effect is always<br />
negative, a rise in the price of leisure will cause both individuals to consume less<br />
leisure. The income effect measures the effect of the change in purchasing power<br />
brought about by the change in the price of leisure. Here, when the price of leisure<br />
(the wage) rises, there is an increase in purchasing power (the new budget line shifts<br />
outward). Assuming both individuals consider leisure to be a normal good, the<br />
increase in purchasing power will increase demand for leisure. For Sam, the<br />
reduction in leisure demand caused by the substitution effect outweighs the increase<br />
in demand for leisure caused by the income effect, so his leisure demand curve slopes<br />
downward. For Barb, her income effect is larger than her substitution effect, so her<br />
leisure demand curve slopes upwards.<br />
11<br />
10<br />
9<br />
8<br />
14 15 16
7. Exercise 12, Ch 4, p 147<br />
You run a small business and would like to predict what will happen to the quantity demanded for<br />
your product if you raise your price. While you do not know the exact demand curve for your<br />
product, you do know that in the first year you charged $45 and sold 1200 units and that in the<br />
second year you charged $30 and sold 1800 units.<br />
a. If you plan to raise your price by 10 percent, what would be a reasonable estimate of<br />
what will happen to quantity demanded in percentage terms?<br />
We must first find the price elasticity of demand. Because the price and quantity<br />
changes are large in percentage terms, it is best to use the arc elasticity measure.<br />
EP = (∆Q/∆P)(average P/average Q) = (600/–15)(37.50/1500) = –1. With an elasticity<br />
of –1, a 10 percent increase in price will lead to a 10 percent decrease in quantity.<br />
b. If you raise your price by 10 percent, will revenue increase or decrease?<br />
When elasticity is –1, revenue will remain constant if price is increased.<br />
8. Exercise 4, Appendix to Ch 4, p 157<br />
Sharon has the following utility function:<br />
U(X,Y) X Y<br />
where X is her consumption of candy bars, with price PX = $1, and Y is her consumption of espressos,<br />
with PY = $3.<br />
a. Derive Sharon’s demand for candy bars and espressos.<br />
Using the Lagrangian method, the Lagrangian equation is<br />
Y ( P X P Y I)<br />
.<br />
X X Y<br />
To find the demand functions, we need to maximize the Lagrangian equation with<br />
respect to X, Y,<br />
constraint. The necessary conditions for a maximum are<br />
0.<br />
5<br />
(1) 0.<br />
5X<br />
PX<br />
0<br />
X<br />
0.<br />
5<br />
(2) 0.<br />
5Y<br />
PY<br />
0<br />
Y<br />
<br />
(3) I PX<br />
X PY<br />
Y 0 .<br />
<br />
Combining conditions (1) and (2) results in<br />
1 1<br />
, so that<br />
0.<br />
5<br />
2<br />
Y<br />
0.<br />
5<br />
PX X 2PY<br />
2<br />
P Y<br />
(4) X <br />
<br />
Y .<br />
2<br />
P <br />
X <br />
0.<br />
5<br />
P X PY<br />
0.<br />
5<br />
X Y , and therefore
Now substitute (4) into (3) and solve for Y. Once you have solved for Y, you can<br />
substitute Y back into (4) and solve for X. Note that algebraically there are several<br />
ways to solve this type of problem; it does not have to be done exactly as shown here.<br />
The demand functions are:<br />
Y <br />
X <br />
P XI<br />
2<br />
PY PY PX PYI 2<br />
PX PY PX or Y I<br />
12<br />
or X 3I<br />
4 .<br />
b. Assume that her income I = $100. How many candy bars and how many espressos will Sharon<br />
consume?<br />
Substitute the values for the two prices and income into the demand functions to find<br />
that she consumes X = 75 candy bars and Y = 8.33 espressos.<br />
c. What is the marginal utility of income?<br />
As shown in the appendix, the marginal utility of income equals . From part a,<br />
1 1<br />
. Substitute into either part of the equation to get<br />
0.<br />
5<br />
2<br />
Y<br />
0.<br />
5<br />
PX X 2PY<br />
This is how much Sharon’s utility would increase if she had one more dollar to spend.<br />
9. Exercise 5, Appendix to Ch 4, p 157<br />
Maurice has the following utility function: U(X,Y) 20X 80Y X 2 2Y 2 , where X is his<br />
consumption of CDs, with a price of $1, and Y is his consumption of movie videos, with a rental price<br />
of $2. He plans to spend $41 on both forms of entertainment. Determine the number of CDs and<br />
video rentals that will maximize Maurice’s utility.<br />
Using X as the number of CDs and Y as the number of video rentals, the Lagrangian<br />
equation is<br />
20X 80Y X 2 2Y 2 (X 2Y 41).<br />
To find the optimal consumption of each good, maximize the Lagrangian equation with<br />
respect to X, Y and<br />
constraint. The necessary conditions for a maximum are<br />
(1) <br />
20 2X 0<br />
X<br />
(2) <br />
80 4Y 2 0<br />
Y<br />
(3) <br />
X 2Y 41 0.<br />
<br />
Note that in condition (3), both sides have been multiplied by –1. Combining conditions (1)<br />
and (2) results in
20 2X 40 2Y<br />
(4) 2Y 20 2X.<br />
Now substitute (4) into (3) and solve for X. Once you have solved for X, you can substitute<br />
this value back into (4) and solve for Y. Note that algebraically there are several ways to<br />
solve this type of problem, and that it does not have to be done exactly as here. The<br />
optimal bundle is X = 7 and Y = 17.

![CV[pdf] - University of British Columbia](https://img.yumpu.com/7265352/1/190x245/cvpdf-university-of-british-columbia.jpg?quality=85)