
You also want an ePaper? Increase the reach of your titles
YUMPU automatically turns print PDFs into web optimized ePapers that Google loves.
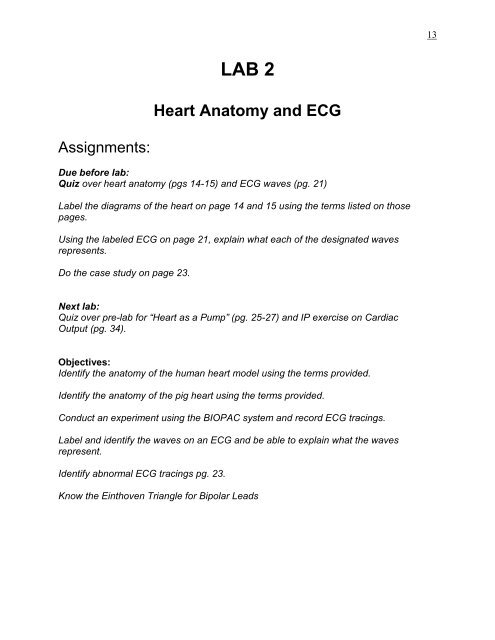
Assignments:<br />
<strong>LAB</strong> 2<br />
<strong>Heart</strong> <strong>Anatomy</strong> <strong>and</strong> <strong>ECG</strong><br />
Due before lab:<br />
Quiz over heart anatomy (pgs 14-15) <strong>and</strong> <strong>ECG</strong> waves (pg. 21)<br />
Label the diagrams of the heart on page 14 <strong>and</strong> 15 using the terms listed on those<br />
pages.<br />
Using the labeled <strong>ECG</strong> on page 21, explain what each of the designated waves<br />
represents.<br />
Do the case study on page 23.<br />
Next lab:<br />
Quiz over pre-lab for “<strong>Heart</strong> as a Pump” (pg. 25-27) <strong>and</strong> IP exercise on Cardiac<br />
Output (pg. 34).<br />
Objectives:<br />
Identify the anatomy of the human heart model using the terms provided.<br />
Identify the anatomy of the pig heart using the terms provided.<br />
Conduct an experiment using the BIOPAC system <strong>and</strong> record <strong>ECG</strong> tracings.<br />
Label <strong>and</strong> identify the waves on an <strong>ECG</strong> <strong>and</strong> be able to explain what the waves<br />
represent.<br />
Identify abnormal <strong>ECG</strong> tracings pg. 23.<br />
Know the Einthoven Triangle for Bipolar Leads<br />
13
External view –Label the following:<br />
Right atrium Superior Vena Cava<br />
Left atrium Aorta<br />
Right Ventricle Pulmonary trunk<br />
Left ventricle Pulmonary arteries<br />
Right Coronary artery Pulmonary veins<br />
14
Internal view - Label the following:<br />
Right atrium Pulmonary trunk<br />
Left atrium Pulmonary semilunar valve<br />
Right ventricle Chordae tendinae<br />
Left ventricle Papillary muscle<br />
Aorta Pulmonary veins<br />
Aortic semilunar valve<br />
Tricuspid valve<br />
Bicuspid Valve<br />
15
A. <strong>Heart</strong> Model<br />
3. Superior vena cava<br />
4. Ascending aorta<br />
5. Arch of aorta<br />
6. Brachiocephalic artery<br />
7. Left common carotid artery<br />
8. Left subclavian<br />
9. Descending aorta<br />
10. Pulmonary trunk<br />
11. Right pulmonary artery<br />
12. Left pulmonary artery<br />
18. Right pulmonary veins<br />
19. Left pulmonary veins<br />
20. Inferior vena cava<br />
21. Right atrium<br />
23. Right auricle<br />
24. Right ventricle<br />
26. Left atrium<br />
28. Left ventricle<br />
34. Apex of heart<br />
36. Coronary sinus<br />
HEART MODEL KEY<br />
48. Left coronary artery<br />
50. Circumflex branch of left coronary artery<br />
56. Tricuspid valve<br />
58. Papillary muscles<br />
59. Chordae tendineae<br />
63. Pulmonary semilunar valve<br />
67. Bicuspid (mitral) valve<br />
70. Aortic semilunar valve<br />
73. Sinoatrial node (SA node)<br />
74. Atrioventricular node (AV node)<br />
75. Atrioventricular bundle or Bundle of His<br />
Bundle branches<br />
Purkinji fibers<br />
16
Identify all exterior parts of heart on these pictures of your model using the terms on<br />
previous page.<br />
17
Identify all interior parts of the heart on this picture of your model using the terms on<br />
pg. 16.<br />
18
IV. Pig <strong>Heart</strong><br />
Identify:<br />
left <strong>and</strong> right atrium<br />
left <strong>and</strong> right ventricle<br />
pulmonary trunk<br />
pulmonary semilunar valve<br />
aorta<br />
aortic semilunar valve<br />
pulmonary veins<br />
superior <strong>and</strong> inferior vena cava<br />
tricuspid valve<br />
bicuspid (mitral) valve<br />
chordae tendineae<br />
papillary muscles<br />
19
Electrocardiogram (<strong>ECG</strong> or EKG)<br />
On the following pages you will find the Biopac Systems laboratory exercise for recording<br />
<strong>ECG</strong>s. Each group (of 4-6 students) will record an <strong>ECG</strong> for one of the group members.<br />
You are responsible for:<br />
1. Reading about <strong>ECG</strong>s in your textbook.<br />
2. Knowing all the parts of an <strong>ECG</strong> tracing <strong>and</strong> physiologically what they<br />
represent.<br />
3. Knowing where electrodes are placed<br />
4. Being able to Identify the normal <strong>and</strong> abnormal <strong>ECG</strong>s<br />
5. Know the Einthoven Triangle for Biopolar Leads<br />
Bipolar Leads:<br />
An electrocardiogram (<strong>ECG</strong> or EKG, abbreviated from the German<br />
Elektrokardiogramm) is a graphic produced by an electrocardiograph, which records<br />
the electrical activity of the heart over time. It is the gold st<strong>and</strong>ard of cardiac rhythm<br />
analysis <strong>and</strong> plays a key role in the screening <strong>and</strong> diagnosis of cardiovascular disease.<br />
The electrocardiogram does not assess the contractility of the heart.<br />
20
Define:<br />
P wave<br />
QRS complex<br />
T wave<br />
PR interval<br />
QT interval<br />
21
The Biopac System for <strong>ECG</strong> <strong>and</strong> pulse rate (BPM)<br />
TO RUN BIOPAC<br />
1. Setup:<br />
turn on MP30<br />
turn on computer<br />
hit return for logon<br />
double click on “Biopac Student Lab” (in middle)<br />
click on “Lesson 5 (L05) – “ok”<br />
type in subject’s name<br />
2. Hook up subject:<br />
white lead – right arm<br />
black lead – right leg (ground)<br />
red lead – left leg<br />
3. Control measurement:<br />
hook up subject <strong>and</strong> have them st<strong>and</strong> quietly<br />
do calibration<br />
record for 10-20 sec – hit SUSPEND<br />
4. Exercise: Have the patient exercise for 3 minutes.<br />
Do NOT disconnect the electrodes. Run in place for 3 minutes.<br />
After exercise hit RESUME <strong>and</strong> record 10-20 sec. Hit SUSPEND<br />
click DONE<br />
click ANALYZE CURRENT DATA<br />
5. Analyze Data<br />
click on small box in the upper left corner of the screen. Scroll <strong>and</strong> click “bpm”<br />
click on the magnifying box <strong>and</strong> magnify 3 complete heart cycles<br />
click on I beam (in the lower right corner of your screen). Place I beam at the peak of<br />
one QRS wave. Click <strong>and</strong> drag to next QRS wave (peak to peak) <strong>and</strong> record bpm in the<br />
table below.<br />
Repeat for “after exercise”<br />
6. Print a copy of your recording. You may want to magnify 3 or 4 waves to get a larger<br />
image <strong>and</strong> then print a copy. (Click on the magnifying glass in the lower right corner of<br />
the computer <strong>and</strong> drag over the waves you want to enlarge)<br />
On the printed copy, label the P, QRS, <strong>and</strong> T waves. What do each of these waves<br />
represents?<br />
Control bpm Exercise bpm<br />
22
THE CASE OF ABNORMAL <strong>ECG</strong> (EKG)<br />
After a fairly severe heart attack, The EKG reveals normal sinus rhythm, but only for the P<br />
wave. The QRS <strong>and</strong> T waves are no longer in synchrony with the P wave.<br />
What is the problem?<br />
What part of the heart is damaged?<br />
What is pacing the ventricles?<br />
Normal <strong>and</strong> Abnormal <strong>ECG</strong>s:<br />
Normal<br />
23