DHL GOGREEN CARBON DASHBOARD
DHL GOGREEN CARBON DASHBOARD
DHL GOGREEN CARBON DASHBOARD

You also want an ePaper? Increase the reach of your titles
YUMPU automatically turns print PDFs into web optimized ePapers that Google loves.
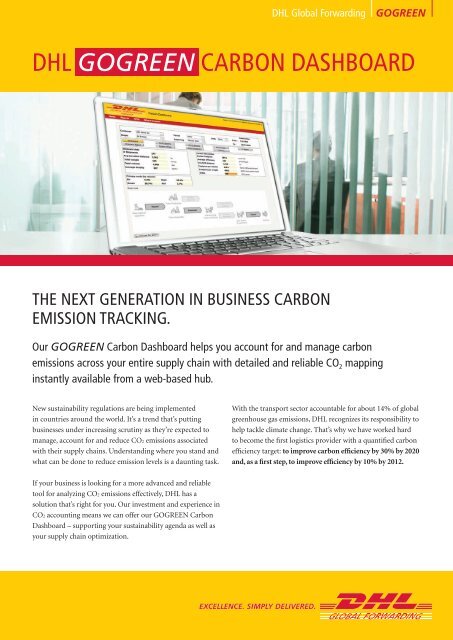
<strong>DHL</strong> Global Forwarding <strong>GOGREEN</strong><br />
<strong>DHL</strong> <strong>GOGREEN</strong> <strong>CARBON</strong> <strong>DASHBOARD</strong><br />
THE NEXT GENERATION IN BUSINESS <strong>CARBON</strong><br />
EMISSION TRACKING.<br />
Our <strong>GOGREEN</strong> Carbon Dashboard helps you account for and manage carbon<br />
emissions across your entire supply chain with detailed and reliable CO 2 mapping<br />
instantly available from a web-based hub.<br />
New sustainability regulations are being implemented<br />
in countries around the world. It’s a trend that’s putting<br />
businesses under increasing scrutiny as they’re expected to<br />
manage, account for and reduce CO2 emissions associated<br />
with their supply chains. Understanding where you stand and<br />
what can be done to reduce emission levels is a daunting task.<br />
If your business is looking for a more advanced and reliable<br />
tool for analyzing CO2 emissions effectively, <strong>DHL</strong> has a<br />
solution that’s right for you. Our investment and experience in<br />
CO2 accounting means we can offer our <strong>GOGREEN</strong> Carbon<br />
Dashboard – supporting your sustainability agenda as well as<br />
your supply chain optimization.<br />
With the transport sector accountable for about 14% of global<br />
greenhouse gas emissions, <strong>DHL</strong> recognizes its responsibility to<br />
help tackle climate change. That’s why we have worked hard<br />
to become the first logistics provider with a quantified carbon<br />
efficiency target: to improve carbon efficiency by 30% by 2020<br />
and, as a first step, to improve efficiency by 10% by 2012.
<strong>DHL</strong> <strong>GOGREEN</strong> <strong>CARBON</strong> <strong>DASHBOARD</strong><br />
Benefits at a glance<br />
• <strong>DHL</strong> Global Forwarding, Freight has developed a Carbon<br />
Dashboard with precision and reliability in mind. Over a<br />
number of years, our experience in carbon reporting has<br />
provided us with the expertise to produce CO2 calculations<br />
our customers can rely on<br />
• With our <strong>GOGREEN</strong> Carbon Dashboard, you can instantly<br />
view clear and transparent analyses of emissions associated<br />
with your shipment from an easily accessed IT platform<br />
• By mapping carbon emissions across your supply chain,<br />
the <strong>GOGREEN</strong> Carbon Dashboard provides a detailed<br />
breakdown of your carbon footprint. Best-in-class CO2<br />
calculations are based on the analysis of a whole range of<br />
factors, including: shipment mode, weight & volume and<br />
actual distance traveled<br />
• Dashboard calculations can take into account carbon<br />
emissions associated with 3rd parties outside our<br />
network, to provide you with a single stable and reliable<br />
computation<br />
• An internationally recognized public standard is used,<br />
ensuring complete confidence in the calculation<br />
• The tool provides a clear baseline with meaningful KPIs,<br />
facilitating supply chain optimization and helping you<br />
work towards your carbon reduction targets<br />
• Access to <strong>GOGREEN</strong> Carbon Dashboard is protected and<br />
supported through a stable and secure IT infrastructure<br />
Contact details<br />
For further information please contact our <strong>DHL</strong> GoGreen team<br />
at GoGreen.Sales-DGFF@dhl.com<br />
Your CURRENT<br />
situation<br />
<strong>DHL</strong> Global Forwarding <strong>GOGREEN</strong><br />
‘What if…’ function<br />
The <strong>GOGREEN</strong> Carbon Dashboard incorporates a ‘What if…’<br />
function; a powerful tool to analyze how carbon emissions<br />
can be reduced through changes in your supply chain. Please<br />
see the example below:<br />
Carbon reduction scenario – example<br />
CONSOLIDATION SERVICES<br />
ROUTING<br />
Your POTENTIAL<br />
situation<br />
65% 80%<br />
9100<br />
km<br />
PACKAGING OPTIMISATION<br />
2cbm<br />
/ton<br />
8700<br />
km<br />
1.5cbm<br />
/ton<br />
<strong>CARBON</strong><br />
saving<br />
= x CO2 saving<br />
= x CO2 saving<br />
= x CO2 saving<br />
CO2 SAVINGS = FUEL SAVINGS = COST SAVINGS