5 EFFICIENCY AND EQUITY - U of L Personal Web Sites
5 EFFICIENCY AND EQUITY - U of L Personal Web Sites
5 EFFICIENCY AND EQUITY - U of L Personal Web Sites

You also want an ePaper? Increase the reach of your titles
YUMPU automatically turns print PDFs into web optimized ePapers that Google loves.
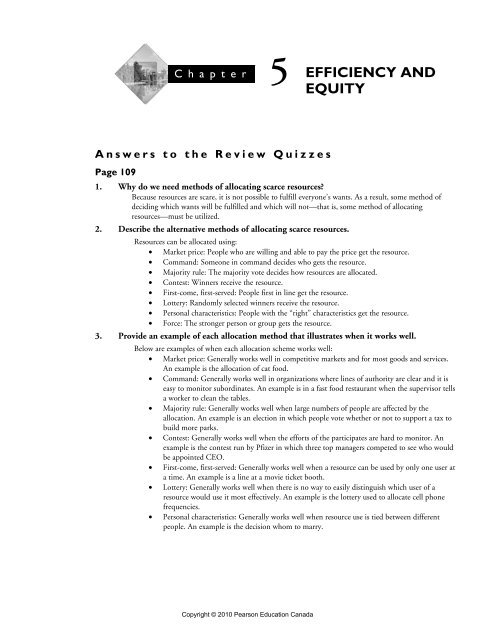
C hapter<br />
5<br />
Answers to the Review Quizzes<br />
<strong>EFFICIENCY</strong> <strong>AND</strong><br />
<strong>EQUITY</strong><br />
Page 109<br />
1. Why do we need methods <strong>of</strong> allocating scarce resources?<br />
Because resources are scare, it is not possible to fulfill everyone’s wants. As a result, some method <strong>of</strong><br />
deciding which wants will be fulfilled and which will not—that is, some method <strong>of</strong> allocating<br />
resources—must be utilized.<br />
2. Describe the alternative methods <strong>of</strong> allocating scarce resources.<br />
Resources can be allocated using:<br />
• Market price: People who are willing and able to pay the price get the resource.<br />
• Command: Someone in command decides who gets the resource.<br />
• Majority rule: The majority vote decides how resources are allocated.<br />
• Contest: Winners receive the resource.<br />
• First-come, first-served: People first in line get the resource.<br />
• Lottery: Randomly selected winners receive the resource.<br />
• <strong>Personal</strong> characteristics: People with the “right” characteristics get the resource.<br />
• Force: The stronger person or group gets the resource.<br />
3. Provide an example <strong>of</strong> each allocation method that illustrates when it works well.<br />
Below are examples <strong>of</strong> when each allocation scheme works well:<br />
• Market price: Generally works well in competitive markets and for most goods and services.<br />
An example is the allocation <strong>of</strong> cat food.<br />
• Command: Generally works well in organizations where lines <strong>of</strong> authority are clear and it is<br />
easy to monitor subordinates. An example is in a fast food restaurant when the supervisor tells<br />
a worker to clean the tables.<br />
• Majority rule: Generally works well when large numbers <strong>of</strong> people are affected by the<br />
allocation. An example is an election in which people vote whether or not to support a tax to<br />
build more parks.<br />
• Contest: Generally works well when the efforts <strong>of</strong> the participates are hard to monitor. An<br />
example is the contest run by Pfizer in which three top managers competed to see who would<br />
be appointed CEO.<br />
• First-come, first-served: Generally works well when a resource can be used by only one user at<br />
a time. An example is a line at a movie ticket booth.<br />
• Lottery: Generally works well when there is no way to easily distinguish which user <strong>of</strong> a<br />
resource would use it most effectively. An example is the lottery used to allocate cell phone<br />
frequencies.<br />
• <strong>Personal</strong> characteristics: Generally works well when resource use is tied between different<br />
people. An example is the decision whom to marry.<br />
Copyright © 2010 Pearson Education Canada
74 CHAPTER 5<br />
• Force: Generally works well when used to uphold the rule <strong>of</strong> law. An example is the state<br />
imprisoning thieves.<br />
4. Provide an example <strong>of</strong> each allocation method that illustrates when it works badly.<br />
Below are examples <strong>of</strong> when each allocation scheme would work poorly:<br />
• Market price: Deciding court cases on the basis <strong>of</strong> who will pay the most for the decision.<br />
• Command: Running an economy.<br />
• Majority rule: Deciding how many acres <strong>of</strong> wheat to plant.<br />
• Contest: Allocating food in a winner-take-all contest.<br />
• First-come, first-served: Admitting students to college based on who applied first.<br />
• Lottery: Assigning grades based on random chance.<br />
• <strong>Personal</strong> characteristics: Renting only to married couples.<br />
• Force: Stealing by threat <strong>of</strong> physical harm.<br />
Page 111<br />
1. How do we measure the value or marginal benefit <strong>of</strong> a good or service?<br />
The value, or marginal benefit, <strong>of</strong> a good or service is measured by the maximum amount that<br />
consumers are willing to pay for one more unit <strong>of</strong> a good or service.<br />
2. What is consumer surplus? How is it measured?<br />
Consumer surplus is the value or marginal benefit <strong>of</strong> a good minus the price paid, summed over the<br />
quantity <strong>of</strong> the good purchased. The price per unit <strong>of</strong> a good is assumed to be equal for all units <strong>of</strong> the<br />
good purchased. The quantity purchased is determined by equating the marginal benefit to the price<br />
paid. This means that the consumer surplus can be measured as the area under the demand curve and<br />
above the price paid, summed over the entire quantity purchased.<br />
Page 113<br />
1. What is the relationship between the marginal cost, minimum supply-price, and supply?<br />
The minimum supply-price <strong>of</strong> producing one more unit <strong>of</strong> a good or service is its marginal cost, and the<br />
marginal cost is the minimum price that producers must receive to induce them to <strong>of</strong>fer one more unit<br />
<strong>of</strong> a good or service for sale.<br />
2. What is producer surplus? How is it measured?<br />
Producer surplus is the price received for each unit <strong>of</strong> a good minus the cost <strong>of</strong> producing it, summed over<br />
all units produced. The price per unit <strong>of</strong> a good is assumed to be the same for all units <strong>of</strong> the good sold.<br />
The quantity purchased is that quantity where the marginal cost is equal to the price received. This<br />
means that the producer surplus can be measured as the area under the price and above the supply curve,<br />
summed over the entire quantity sold.<br />
Page 117<br />
1. Do competitive markets use resources efficiently? Explain why or why not.<br />
In the absence <strong>of</strong> the obstacles mentioned earlier in the chapter, competitive markets use society’s<br />
resources efficiently. For resources to be used efficiently they must be allocated to produce the quantity<br />
<strong>of</strong> a good or service where the marginal cost <strong>of</strong> the last unit produced in the market is equal to the<br />
marginal benefit. This condition will be met in a competitive market because equilibrium quantity<br />
occurs where the demand curve (which equals the marginal social benefit curve) intersects the supply<br />
curve (which equals the marginal social cost curve).<br />
Copyright © 2010 Pearson Education Canada
<strong>EFFICIENCY</strong> <strong>AND</strong> <strong>EQUITY</strong> 75<br />
2. What is deadweight loss and under what conditions does it occur?<br />
The deadweight loss is the is the decrease in total surplus that results from an inefficient level <strong>of</strong><br />
production. This is the decrease in consumer surplus plus the decrease in producer surplus that occurs<br />
when the market either overproduces or underproduces relative to the efficient quantity..<br />
3. What are the obstacles to achieving an efficient allocation <strong>of</strong> resources in the market<br />
economy?<br />
Markets with price or quantity regulations, taxes or subsidies, externalities, public goods or common<br />
resources, monopoly power, or high transactions costs will not produce the efficient quantity <strong>of</strong> a good<br />
or service. In each <strong>of</strong> these situations, the market prices charged or quantities produced and sold will not<br />
result in the efficient allocation <strong>of</strong> resources. Efficiency requires that the marginal social benefit <strong>of</strong> the<br />
last unit produced be equal to the marginal social cost. The equilibrium at the intersection <strong>of</strong> the<br />
demand and supply curves in the competitive market creates this result. When the market price or<br />
quantity is pulled away from the market equilibrium, the marginal social benefit <strong>of</strong> the last unit<br />
produced does not equal its marginal social cost.<br />
Page 121<br />
1. What are the two big approaches to thinking about fairness?<br />
The two big approaches to thinking about fairness are:<br />
• “It’s not fair if the result isn’t fair,” or utilitarianism.<br />
• “It’s not fair if the rules aren’t fair,” or equality <strong>of</strong> opportunity.<br />
2. What is the utilitarian idea <strong>of</strong> fairness and what is wrong with it?<br />
The utilitarian idea <strong>of</strong> fairness implies that equality <strong>of</strong> incomes is necessary for the allocation <strong>of</strong> resources<br />
to be “fair.” There should be income transfers from the rich to the poor until equality is achieved,<br />
because the marginal benefit <strong>of</strong> the last dollar <strong>of</strong> income is the same for everybody. There are two<br />
problem with utilitarianism:<br />
• It ignores the cost <strong>of</strong> implementing the income transfers, which will decrease the total goods and<br />
services that the finite resources <strong>of</strong> society can produce. The size <strong>of</strong> the economic pie will be smaller.<br />
• It assumes that the existence <strong>of</strong> decreasing marginal benefits allows us to make inter-personal<br />
comparisons about value gained and lost at different levels <strong>of</strong> consumption <strong>of</strong> a good or service.<br />
While one can compare the marginal benefits from consuming different levels <strong>of</strong> a good or service<br />
for an individual, this is not the same as comparing the marginal benefits from consuming different<br />
levels <strong>of</strong> a good or service across individuals.<br />
3. Explain the big trade<strong>of</strong>f. What idea <strong>of</strong> fairness has been developed to deal with it?<br />
The big trade<strong>of</strong>f is the trade<strong>of</strong>f between equality and efficiency. Redistributing incomes changes the<br />
incentives facing producers and consumers. Taxing income decreases producer surplus and taxing<br />
purchases decreases consumer surplus. Producers produce less and consumers consume less, and total<br />
economic activity declines, such that the size <strong>of</strong> the economic pie decreases. The big trade<strong>of</strong>f has led to<br />
the idea that the fairest distribution is that which makes the poorest person as well <strong>of</strong>f as possible.<br />
4. What is the idea <strong>of</strong> fairness based on fair rules?<br />
The fair rules idea <strong>of</strong> fairness is that <strong>of</strong> providing equality <strong>of</strong> opportunity is necessary for the allocation <strong>of</strong><br />
resources to be “fair.” This is the economic application <strong>of</strong> the symmetry principle, that people in similar<br />
situations be treated similarly. Equality <strong>of</strong> opportunity can be achieved if two rules are obeyed:<br />
• The government must enforce laws that establish and protect rights to private property that are held<br />
by individuals in society, and<br />
• Private property may be transferred from one person to another only by voluntary exchange and<br />
without fraudulent representation.<br />
Copyright © 2010 Pearson Education Canada
76 CHAPTER 5<br />
Answers to the Problems and Applications<br />
1. At West, recognized as the “jewel <strong>of</strong> Vancouver’s culinary crown,” reservations are essential.<br />
At Le Bistro Chez Michel, a restaurant in North Vancouver, reservations are recommended.<br />
At Viji’s, a restaurant not far from the University <strong>of</strong> British Columbia, reservations are not<br />
accepted.<br />
a. Describe the method <strong>of</strong> allocating scarce table resources at these three restaurants.<br />
All these restaurants use a first-come, first-serve system. Viji’s uses this system directly. West uses a firstcome,<br />
first-serve because the first person to call to make a reservation at a particular time is allocated the<br />
table at that time. Le Bistro Chez Michel uses a combination <strong>of</strong> the immediate first-come, first serve<br />
system and the reservation based first-come, first-serve system.<br />
b. Why do you think restaurants have different reservations policies?<br />
The speed with which tables turn over at the different restaurants probably is quite different and the<br />
customers probably have quite different values <strong>of</strong> time. West has a low turnover rate—only 1 or 2<br />
groups <strong>of</strong> customers can use a table each night—and its customers have a high value <strong>of</strong> time. If West<br />
refused to take reservations, its customers would need to wait an inefficiently long time and would go<br />
elsewhere, so West’s pr<strong>of</strong>its would fall. At Viji’s, the tables have a high turnover rate and the customers<br />
have a lower value <strong>of</strong> time. Allowing reservations would be costly for Viji’s and would spare its<br />
customers only a slight wait at most, so allowing reservations would decrease Viji’s pr<strong>of</strong>its. At Le Bistro<br />
Chez Michel, the turnover rate <strong>of</strong> the tables is between that at West and Viji’s, so it uses a combination<br />
<strong>of</strong> phone reservation first-come, first-serve and appear in person first-come, first serve.<br />
c. Why might each restaurant be using an efficient allocation method?<br />
Each restaurant is using a different allocation method because <strong>of</strong> the relative costs. Each uses the method<br />
that has the lowest cost for the restaurant.<br />
d. Why do you think restaurants don’t use the market price to allocate their tables?<br />
Market allocation requires that customers pay for a table and the price would fluctuate from one hour to<br />
the next depending on the number <strong>of</strong> customers who arrive. Customers would be highly uncertain about<br />
the price they would need to pay and such uncertainty decreases the demand for meals from the<br />
restaurant. The decreased demand lowers the restaurant’s pr<strong>of</strong>it.<br />
2. The table provides<br />
information on the demand<br />
schedules for train travel for<br />
Ann, Beth, and Cy, who are<br />
the only buyers in the<br />
market.<br />
Price<br />
Quantity demanded<br />
(dollars per<br />
(kilometre)<br />
kilometre) Ann Beth Cy<br />
3 30 25 20<br />
4 25 20 15<br />
5 20 15 10<br />
6 15 10 5<br />
7 10 5 0<br />
8 5 0 0<br />
9 0 0 0<br />
Copyright © 2010 Pearson Education Canada
<strong>EFFICIENCY</strong> <strong>AND</strong> <strong>EQUITY</strong> 77<br />
a. Construct the market demand schedule.<br />
The market demand schedule shows the sum <strong>of</strong> the quantities demanded by Ann, Beth, and Cy at each<br />
price.<br />
Price<br />
Quantity demanded<br />
(dollars per<br />
(kilometre)<br />
kilometre) Ann Beth Cy Market<br />
3 30 25 20 75<br />
4 25 20 15 60<br />
5 20 15 10 45<br />
6 15 10 5 30<br />
7 10 5 0 15<br />
8 5 0 0 5<br />
9 0 0 0 0<br />
b. What are the maximum prices that Ann, Beth, and Cy are willing to pay to travel 20<br />
kilometres? Why?<br />
Each person’s demand schedule shows the maximum price that person is willing to pay to travel 20<br />
kilometres. The maximum price Ann is willing to pay to travel 20 kilometres is $5, the maximum price<br />
Beth is willing to pay is $4, and the maximum price Cy is willing to pay is $3.<br />
c. What is the marginal social benefit when the total distance travelled is 60 kilometres?<br />
The marginal social benefit when the quantity is 60 kilometre is $4 per mile. The marginal social benefit<br />
is determined from the consumers’ demands and equals the maximum price that consumers will pay for<br />
the quantity. The demand schedule shows that the maximum price consumers will pay for 60 kilometres<br />
is $4 per kilometre and this price equals the marginal social benefit.<br />
d. What is the marginal benefit for each person when they travel a total distance <strong>of</strong> 60<br />
kilometres and how many kilometres does each <strong>of</strong> the people travel?<br />
The three travel a total distance <strong>of</strong> 60 kilometres when the price is $4 a kilometre. Each person’s<br />
marginal benefit is $4 per kilometre. At this price Ann travels 25 kilometres, Beth travels 20 kilometres,<br />
and Cy travels 15 kilometres.<br />
e. What is each traveler’s consumer surplus when the price is $4 a mile?<br />
Ann’s consumer surplus is $62.50; Beth’s consumer surplus is $40.00; and, Cy’s consumer surplus is<br />
$22.50.<br />
When the price is $4 per kilometre, Ann travels 25 kilometres. Ann’s consumer surplus is the triangular<br />
area under her demand curve and above the price. The demand curve is linear, so Ann’s consumer<br />
surplus is 1/2 × ($9 − $4) × 25, which equals $62.50.<br />
When the price is $4 per kilometre, Beth travels 20 kilometres. Beth’s consumer surplus is the triangular<br />
area under her demand curve and above the price. The demand curve is linear, so Beth’s consumer<br />
surplus is 1/2 × ($8 − $4) × 20, which equals $40.00<br />
When the price is $4 per kilometre, Cy travels 15 kilometres. Cy’s consumer surplus is the triangular<br />
area under his demand curve and above the price. The demand curve is linear, so Cy’s consumer surplus<br />
is 1/2 × ($7 − $4) × 15, which equals $22.50.<br />
f. What is the market consumer surplus when the price is $4 a kilometre?<br />
The market consumer surplus is the sum <strong>of</strong> Ann’s consumer surplus, Beth’s consumer surplus, and Cy’s<br />
consumer surplus, or $125.00.<br />
Copyright © 2010 Pearson Education Canada
78 CHAPTER 5<br />
3. eBay Saves Billions for Bidders<br />
If you think you would save money by bidding on eBay auctions, you would likely be right.<br />
... Two associate pr<strong>of</strong>essors ... calculate the difference between the actual purchase price paid<br />
for auction items and the top price bidders stated they were willing to pay ... and the<br />
Maryland researchers found it averaged at least $4 per auction.<br />
InformationWeek, January 28, 2008<br />
a. What method is used to allocate goods on eBay?<br />
eBay is using market price to allocate the goods. The market price is the price established in the auction.<br />
If someone is willing and able to pay that price, the person will get the item.<br />
b. How do eBay auctions influence consumer surplus?<br />
For the vast majority <strong>of</strong> auctions, the winning bidder will enjoy a consumer surplus. So eBay increases<br />
consumer surplus. For instance, if there are bidders on a unique item, the winning bidder—who sets the<br />
price for the good—will pay a price that is equal to the value <strong>of</strong> the item to the bidder with the secondhighest<br />
valuation plus the minimum bid increment. The winning bidder has some consumer surplus as<br />
long as his or her value <strong>of</strong> the good exceeds the price that must be paid, which will almost always be the<br />
case. Indeed, a person chooses to buy on eBay rather than elsewhere if the person believes that his or her<br />
consumer surplus is largest by purchasing on eBay.<br />
4. The table provides<br />
information on the<br />
supply schedules <strong>of</strong> hot<br />
air balloon rides by<br />
Xavier, Yasmin, and<br />
Zack, who are the only<br />
sellers in the market.<br />
Price<br />
Quantity supplied<br />
(dollars<br />
(rides per week)<br />
per ride) Xavier Yasmin Zack<br />
100 30 25 20<br />
90 25 20 15<br />
80 20 15 10<br />
70 15 10 5<br />
60 10 5 0<br />
50 5 0 0<br />
40 0 0 0<br />
a. Construct the market supply schedule.<br />
The market supply schedule shows the sum <strong>of</strong> the quantities supplied by Xavier, Yasmin, and Zack at<br />
each price.<br />
Price<br />
Quantity supplied<br />
(dollars<br />
(rides per week)<br />
per ride) Xavier Yasmin Zack Market<br />
100 30 25 20 76<br />
90 25 20 15 60<br />
80 20 15 10 45<br />
70 15 10 5 30<br />
60 10 5 0 15<br />
50 5 0 0 5<br />
40 0 0 0 0<br />
Copyright © 2010 Pearson Education Canada
<strong>EFFICIENCY</strong> <strong>AND</strong> <strong>EQUITY</strong> 79<br />
b. What are the minimum prices that Xavier, Yasmin, and Zack are willing to accept to<br />
supply 20 rides? Why?<br />
The minimum supply-price equals the lowest price at which a producer is willing to produce the given<br />
quantity. The supply schedule tells us the minimum supply-price. Xavier’s minimum supply-price for 20<br />
rides is $80; Yasmin’s minimum supply-price is $90; and, Zack’s minimum supply-price is $100.<br />
c. What is the marginal social cost when the total number <strong>of</strong> rides is 30?<br />
The quantity <strong>of</strong> rides is supplied is 30 when the price is $70 per ride. The marginal social cost <strong>of</strong> any<br />
quantity is equal to the price for which that quantity will be supplied, so when the total number <strong>of</strong> rides<br />
is 30, the marginal social cost equals $70 per ride.<br />
d. What is the marginal cost for each supplier when the total number <strong>of</strong> rides is 30 and how<br />
many rides does each <strong>of</strong> the firms supply?<br />
When the total number <strong>of</strong> rides is 30, Xavier supplies 15 rides, Yasmin supplies 10 rides, and Zack<br />
supplies 5 rides. The marginal cost for each firm is $70.<br />
e. What is each firm’s producer surplus when the price is $70 a ride?<br />
Xavier’s producer surplus is $225; Yasmin’s producer surplus is $100; and, Zack’s producer surplus is<br />
$25.<br />
When the price is $70 per ride, Xavier supplies 15 rides. Xavier’s producer surplus is the triangular area<br />
under the price and above his supply curve. The supply curve is linear, so Xavier’s producer surplus is<br />
1/2 × ($70 − $40) × 15, which equals $225.<br />
When the price is $70 per ride, Yasmin supplies 10 rides. Yasmin’s producer surplus is the triangular<br />
area under the price and above his supply curve. The supply curve is linear, so Yasmin’s producer surplus<br />
is 1/2 × ($70 − $50) × 10, which equals $100.<br />
When the price is $70 per ride, Zack supplies 5 rides. Zack’s producer surplus is the triangular area<br />
under the price and above his supply curve. The supply curve is linear, so Zack’s producer surplus is 1/2<br />
× ($70 − $60) × 5, which equals $25.<br />
f. What is the market producer surplus when the price is $70 a ride?<br />
The market producer surplus is equal to the sum <strong>of</strong> Xavier’s producer surplus plus Yasmin’s producer<br />
surplus plus Zack’s producer surplus, which is $225 + $100 + $25 or $350.<br />
5. Based on the information provided in the news clip in problem 3,<br />
a. Can an eBay auction give the seller a surplus?<br />
Yes, an eBay auction can give a seller a surplus. The seller has a minimum supply price for which the<br />
item will be sold. If the price established in the auction exceeds that minimum supply price, the seller<br />
has a surplus.<br />
b. Draw a graph to illustrate an eBay auction<br />
and show the consumer surplus and<br />
producer surplus that it generates.<br />
Figure 5.1 illustrates an eBay auction. The figure<br />
assumes that there are many suppliers <strong>of</strong> this<br />
good, each with a different minimum supply price<br />
so that the supply curve is upward sloping. The<br />
consumer surplus is area A, the area under the<br />
demand curve and above the (auctiondetermined)<br />
market price. The producer surplus is<br />
area B, the area under the market price and above<br />
the supply curve.<br />
Copyright © 2010 Pearson Education Canada
80 CHAPTER 5<br />
6. The figure illustrates the market for cell<br />
phones.<br />
a. What are the equilibrium price and<br />
equilibrium quantity <strong>of</strong> cell phones?<br />
The equilibrium price is $30 per cell phone and<br />
the equilibrium quantity is 100 cell phones per<br />
month.<br />
b. Shade in and label the consumer surplus and<br />
the producer surplus.<br />
In Figure 5.3 (on the next page) the consumer<br />
surplus is the shaded area A and the producer<br />
surplus is the shaded area B.<br />
c. Shade in and label the cost <strong>of</strong> producing the<br />
cell phones sold.<br />
In Figure 5.3 (on the next page) the cost <strong>of</strong><br />
producing the cell phones sold is equal to area C.<br />
d. Calculate total surplus.<br />
The total surplus is equal to the sum <strong>of</strong> the<br />
consumer surplus plus the producer surplus, or<br />
the triangle with area A + area B. The amount <strong>of</strong><br />
the total surplus equals ½ × ($60 per cell phone −<br />
$15 per cell phone) × 100 cell phones, which is<br />
$2,250.<br />
e. What is the efficient quantity <strong>of</strong> cell<br />
phones?<br />
The efficient quantity <strong>of</strong> cell phones is 100 cell<br />
phones per month.<br />
Copyright © 2010 Pearson Education Canada
7. The table gives the demand and supply<br />
schedules for sunscreen. Sunscreen<br />
factories are required to limit<br />
production to 100 bottles a day.<br />
a. What is the maximum price that<br />
consumers are willing to pay for the<br />
100th bottle?<br />
Consumers are willing to pay a<br />
<strong>EFFICIENCY</strong> <strong>AND</strong> <strong>EQUITY</strong> 81<br />
Quantity Quantity<br />
Price demanded supplied<br />
(dollars per bottle) (bottles per day)<br />
0 400 0<br />
5 300 100<br />
10 200 200<br />
15 100 300<br />
20 0 400<br />
maximum price <strong>of</strong> $15 for the 100th bottle <strong>of</strong> sunscreen. The demand schedule shows the maximum<br />
price that consumers will pay for each bottle <strong>of</strong> sunscreen. The maximum price that consumers will pay<br />
for the 100th bottle is $15.<br />
b. What is the minimum price that producers are willing to accept for the 100th bottle?<br />
Producers are willing to accept a minimum price <strong>of</strong> $5 for the 100th bottle <strong>of</strong> sunscreen. The supply<br />
schedule shows the minimum price that producers will accept for each bottle <strong>of</strong> sunscreen. The<br />
minimum price that produces will accept for the 100th bottle is $5.<br />
c. Describe the situation in this market.<br />
There is less than the efficient quantity being produced. The efficient quantity is the equilibrium<br />
quantity, 200 bottles.<br />
d. How can the 100 bottles be allocated to beachgoers? Which possible methods would be fair<br />
and which would be unfair?<br />
The bottles can be allocated using a contest (a raffle for the bottles, perhaps), first-come, first-served (a<br />
line until all 100 bottles are distributed), personal characteristics (perhaps all fair-haired people are<br />
allocated the sun screen), or force (a fight). Using the “fair results” criteria, none <strong>of</strong> the allocation<br />
schemes are necessarily fair because there is no guarantee that poorer people will receive the sun screen.<br />
Using the “fair rules” criteria, the force method is definitely unfair and the others are fair.<br />
8. Wii Sells Out Across Japan<br />
… Japan finally came in for its share <strong>of</strong> Wii madness this weekend. … However, given the<br />
large amount <strong>of</strong> interest in the console—which Nintendo has flogged with a TV-ad blitz for<br />
the past two months—demand is expected to be much higher than supply. … Yodobashi<br />
Camera was selling Wii games on a first-come, first-served basis, so eager customers showed<br />
up early so as not to miss out on their favorite titles. [But] customers who tried to get in the<br />
… line after 6 or 7 a.m. were turned away. … [and] many could be spotted rushing <strong>of</strong>f to<br />
the smaller Akihabara stores that were holding raffles to decide who got a Wii.<br />
Gamespot News, Dec 1, 2006<br />
a. Why was the quantity demanded <strong>of</strong> Wii expected to exceed the quantity supplied?<br />
At the price <strong>of</strong> a Wii set by Nintendo, the quantity demanded was forecast to exceed the quantity<br />
supplied. Stores could run surveys to determine how many customers were likely to buy a Wii from the<br />
store. The survey could be as informal as clerks reporting how many people asked about a Wii during<br />
the clerk’s shift to more formal by asking customers to sign up in advance to buy a Wii. Given these<br />
surveys, the quantity demanded was expected to exceed the quantity Nintendo released for sale.<br />
b. Did Nintendo produce the efficient quantity <strong>of</strong> Wii? Explain<br />
At the price Nintendo set, Nintendo did not produce the efficient quantity <strong>of</strong> Wii. There was a shortage<br />
<strong>of</strong> Wii consoles. The MSB <strong>of</strong> a Wii exceeds the MSC so the market is inefficient.<br />
Copyright © 2010 Pearson Education Canada
82 CHAPTER 5<br />
c. Can you think <strong>of</strong> reasons why Nintendo might want to underproduce and leave the market<br />
with fewer Wii than people want to buy?<br />
Nintendo might have wanted to create a shortage to gain more publicity for its Wii. If news reporters<br />
had story after story about the shortage, then Nintendo would gain free publicity. Additionally, given<br />
the very high initial demand for a Wii, if the price was set so that the quantity supplied equaled the<br />
initial (very high) quantity demanded, then the price would be high. After the initial adopters were<br />
satisfied, the price would then fall and Nintendo would get a reputation for price gouging.<br />
d. What are the two methods <strong>of</strong> resource allocation described in the news clip?<br />
The first store was using a first-come, first serve method <strong>of</strong> allocation. The second, smaller stores were<br />
allocating Wii using a lottery so that winners would obtain a Wii.<br />
e. Is either method <strong>of</strong> allocating Wii efficient?<br />
Neither method is likely efficient. But given that the price was not going to charge to allocate the Wii,<br />
some other method or methods had to be used to allocate the Wii.<br />
f. What do you think some <strong>of</strong> the people who managed to buy a Wii did with it?<br />
Some <strong>of</strong> the people who acquired a Wii resold it to other people.<br />
g. Explain which is the fairer method <strong>of</strong> allocating the Wii: the market price or the two<br />
methods described in the news clip.<br />
Allocating Wii according to the market price is not necessarily fair using the “fair results” approach but<br />
is fair using the “fair rules” approach. The other two methods <strong>of</strong> allocation are fair according to either <strong>of</strong><br />
fairness measures only by random chance.<br />
9. New Zealand’s Private Forests<br />
In the late 1980s, New Zealand decided it was time to quit cold turkey. Its addiction was<br />
government. … By the early 1990s, New Zealand had [sold] half <strong>of</strong> the country’s total<br />
plantation forests to the highest bidder, introducing an era <strong>of</strong> privately-owned forests. “We<br />
want [timber companies] to behave like farmers. Farmers make sure they don’t destroy the<br />
soil or run down its fertility. Farmers look after their farms to make them continuously<br />
productive.” … The argument right from the start was … [i]t’s a commercial decision. These<br />
are supposedly commercial forests planted to make a pr<strong>of</strong>it. …<br />
Reuters, September 7, 2007<br />
a. In the late 1980s, was the New Zealand timber industry efficient? Did logging companies<br />
operate in the social interest or self-interest?<br />
In the late 1980s, the logging companies were operating in their self-interest. They were producing<br />
more than the efficient quantity. Marginal cost exceeded marginal benefit. The logging companies were<br />
not considering all <strong>of</strong> the costs <strong>of</strong> production because they did not own the land on which they were<br />
working. They had no incentive to preserve forestland or to cut timber in a way that would make<br />
future harvesting <strong>of</strong> trees pr<strong>of</strong>itable.<br />
b. Since the early 1990s, has the New Zealand timber industry been efficient? Have logging<br />
companies operated in the social interest or self-interest?<br />
Since the early 1990s, the logging companies have been operating in the self-interest and the social<br />
interest. They are producing the efficient quantity. Marginal social cost equals marginal social benefit<br />
because the private forest owners charge the logging companies for the use <strong>of</strong> the land.<br />
The logging companies now must consider all <strong>of</strong> the costs <strong>of</strong> producing.<br />
c. What incentive do private timber companies have to ensure that they “operate like<br />
farmers”?<br />
The incentive that private companies have to ensure that they "operate like farmers" is pr<strong>of</strong>it.<br />
If loggers deplete the forests this year, they will have no pr<strong>of</strong>it in the years to come. The private timber<br />
company has the incentive to maximize its pr<strong>of</strong>it over the long term. This incentive means that the<br />
Copyright © 2010 Pearson Education Canada
<strong>EFFICIENCY</strong> <strong>AND</strong> <strong>EQUITY</strong> 83<br />
timber company will preserve the efficient quantity <strong>of</strong> young trees and allow them to grow to maturity,<br />
and will plant new trees to have trees to harvest in the future.<br />
10. The table gives the supply<br />
schedules for jet-ski rides by<br />
three owners: Rick, Sam, and<br />
Tom, the only suppliers <strong>of</strong> jetski<br />
rides.<br />
a. What is each owner’s<br />
minimum supply-price <strong>of</strong> 10<br />
rides a day?<br />
Rick’s minimum supply- price for 10 rides is $15.00, Sam’s minimum supply-price is $17.50, and<br />
Tom’s minimum supply-price is $20.00.<br />
b. Which owner has the largest producer surplus when the price <strong>of</strong> a ride is $17.50? Explain.<br />
Rick has the largest producer surplus when the price is $17.50. Rick’s producer surplus is largest because<br />
he produces the largest quantity and his costs are lower than those <strong>of</strong> the other producers. More<br />
formally, each supplier’s producer surplus is equal to the area under the price and above that producer’s<br />
supply curve. Calculating these areas <strong>of</strong> producer surplus, Rick’s producer surplus is $56.25, Sam’s<br />
producer surplus is $25.00, and Tom’s producer surplus is $6.25.<br />
c. What is the marginal social cost <strong>of</strong> producing 45 rides a day?<br />
45 rides are produced when the price is $20.00, so the marginal social cost <strong>of</strong> producing 45 rides a day is<br />
$20.00.<br />
d. Construct the market supply schedule <strong>of</strong> jet-ski rides.<br />
When the price is $10.00, the quantity <strong>of</strong> rides supplied is 0; when the price is $12.50, the quantity<br />
supplied is 5 rides; when the price is $15.00, the quantity supplied is 15; when the price is $17.50, the<br />
quantity supplied is 30; and, when the price is $20, the quantity supplied is 45.<br />
11. The table gives the demand and<br />
supply schedules for sandwiches.<br />
a. What is the maximum price that<br />
consumers are willing to pay for<br />
the 200th sandwich?<br />
The demand schedule shows the<br />
maximum price that consumers will<br />
pay for each sandwich. The maximum<br />
price consumers will pay for the 200th<br />
sandwich is $2.<br />
b. What is the minimum price that<br />
Price<br />
Quantity supplied<br />
(dollars<br />
(rides per week)<br />
per ride) Rick Sam Tom<br />
10.00 0 0 0<br />
12.50 5 0 0<br />
15.00 10 5 0<br />
17.50 15 10 5<br />
20.00 20 15 10<br />
Quantity Quantity<br />
Price demanded supplied<br />
(dollars per sandwich) (sandwiches per hour)<br />
0 300 0<br />
1 250 50<br />
2 200 100<br />
3 150 150<br />
4 100 200<br />
5 50 250<br />
6 0 300<br />
producers are willing to accept for the 200th sandwich?<br />
The supply schedule shows the minimum price that producers will accept for each sandwich. The<br />
minimum price for which produces will produce the 200th sandwich is $4.<br />
c. Are 200 sandwiches a day less than or greater than the efficient quantity?<br />
200 sandwiches a day are more than the efficient quantity because the marginal social benefit (the<br />
maximum price consumers will pay) is less than the marginal social cost (the minimum price suppliers<br />
will accept).<br />
Copyright © 2010 Pearson Education Canada
84 CHAPTER 5<br />
d. If sandwich makers produce 200 a day, what is the deadweight loss?<br />
The deadweight loss is $50. Deadweight loss is the sum <strong>of</strong> the consumer surplus and producer surplus<br />
that is lost because the quantity produced is not the efficient quantity. The deadweight loss equals the<br />
quantity (200 − 150) multiplied by ($4 − $2)/2, which is $50.<br />
e. If the sandwich market is efficient, what is the consumer surplus, what is the producer<br />
surplus, and what is the total surplus?<br />
150 sandwiches is the efficient quantity and the equilibrium price is $3. The consumer surplus is the<br />
area <strong>of</strong> the triangle under the demand curve above the price. The area <strong>of</strong> the consumer surplus triangle is<br />
½ × ($6 − $3) × 150, which is $225. The producer surplus is the area <strong>of</strong> the triangle above the supply<br />
curve below the price. The price is $3 and the quantity is 150. The area <strong>of</strong> the triangle is 1.2 × ($3 −<br />
$0) × 150, which is $225. The total surplus is the sum <strong>of</strong> the consumer surplus plus the producer<br />
surplus, which is $450.<br />
f. If the demand for sandwiches increases and sandwich makers produce the efficient<br />
quantity, what happens to consumer surplus and producer surplus?<br />
If the demand for sandwiches increases, the price and quantity <strong>of</strong> sandwiches both rise. The producer<br />
surplus definitely increases. The effect on consumer surplus is ambiguous. It rises if the quantity<br />
increases by a larger percentage than does the price but it falls if the price rises by a larger percentage<br />
than does the quantity.<br />
12. The Right Price for Digital Music: Why 99 Cents per Song is Too Much, and Too Little.<br />
Apple’s 99-cents-for-everything model isn’t perfect. Isn’t 99 cents too much to pay for music<br />
that appeals to just a few people? What we need is a system that will continue to pack the<br />
corporate c<strong>of</strong>fers yet be fair to music lovers. The solution: a real-time commodities market<br />
that combines aspects <strong>of</strong> Apple’s iTunes, Nasdaq, the Chicago Mercantile Exchange,<br />
Priceline, and eBay. ... Songs would be priced strictly on demand. The more people who<br />
download [a particular song] ... the higher the price [<strong>of</strong> that song] will go. ... The fewer<br />
people who buy a [particular] song, the lower the price [<strong>of</strong> that song] goes. ... In essence,<br />
this is a pure free-market solution—the market alone would determine price.<br />
Slate, December 5, 2005<br />
Assume that the marginal social cost <strong>of</strong> downloading a song from the iTunes store is zero.<br />
(This assumption means that the cost <strong>of</strong> operating the iTunes store doesn’t change if people<br />
download more songs.)<br />
a. Draw a graph <strong>of</strong> the market for downloadable music with a price <strong>of</strong> 99 cents for<br />
everything. On your graph, show consumer surplus and producer surplus.<br />
Figure 5.4 shows this market. The marginal social<br />
cost curve runs along the horizontal axis. The<br />
consumer surplus is area A and the producer<br />
surplus is area B.<br />
b. With a price <strong>of</strong> 99 cents for everything, is<br />
the market efficient or inefficient? If it is<br />
inefficient, show the deadweight loss on<br />
your graph.<br />
The market is inefficient. Efficiency requires that<br />
the amount be the quantity for which the<br />
marginal social benefit equals the marginal social<br />
cost, which in this case is the quantity at which<br />
the marginal social benefit curve intersects the<br />
Copyright © 2010 Pearson Education Canada
<strong>EFFICIENCY</strong> <strong>AND</strong> <strong>EQUITY</strong> 85<br />
horizontal axis. The deadweight loss is area C in Figure 5.4.<br />
c. If the pricing scheme described in the news clip were adopted, how would consumer<br />
surplus, producer surplus, and the deadweight loss change?<br />
The price <strong>of</strong> popular songs rises, so the consumer surplus for popular songs decreases and the producer<br />
surplus increases. A larger deadweight loss is created. The price <strong>of</strong> unpopular songs falls, so the consumer<br />
surplus for unpopular songs increases and the producer surplus decreases. A smaller deadweight loss is<br />
created.<br />
d. If the pricing scheme described in the news clip were adopted would the market be<br />
efficient or inefficient? Explain.<br />
The market would likely become more inefficient because the inefficiency <strong>of</strong> the popular songs—the<br />
songs most people want—increases. The price exceeds the marginal social cost.<br />
e. Is the pricing scheme described in the news clip a “pure free-market solution”? Explain.<br />
With a pure free-market solution the price is determined by supply and demand. The pricing method<br />
discussed in the clip uses only demand and so it is not the same as a pure free-market solution. A pure<br />
free market solution produces the efficient quantity <strong>of</strong> 200 downloads and the price is zero.<br />
13. A winter storm cuts the power supply and isolates a small town in the mountains. The<br />
people rush to buy candles from the town store, which is the only source <strong>of</strong> candles. The<br />
store owner decides to ration the candles to one per family but to keep the price <strong>of</strong> a candle<br />
unchanged.<br />
a. Who gets to use the candles? Who receives the consumer surplus and who receives the<br />
producer surplus on candles?<br />
The people who buy candles from the town store are not necessarily the people who use the candles. A<br />
buyer from the town store can sell a candle and will do so if he or she can get a price that exceeds his or<br />
her marginal benefit. The people who value the candles most—who are willing to pay the most—will<br />
use the candles.<br />
Only the people who are willing to pay the most for candles receive the consumer surplus on candles,<br />
and the store owner receives the same producer surplus as normal. People who sell the candles they buy<br />
from the store receive additional producer surplus.<br />
b. Is the allocation efficient? Is the allocation fair?<br />
The allocation is efficient because the people who value the candles most use them. Two views <strong>of</strong><br />
fairness: The rules view is that if the rule <strong>of</strong> one candle per family is followed and exchange is voluntary,<br />
then the outcome is fair. But the results view is that if the candles are allocated unequally, then the<br />
allocation is unfair.<br />
14. Ticketmaster Accused <strong>of</strong> “Price-Gouging” in Canada<br />
As if the imminent Live Nation ticketing venture wasn’t enough for Ticketmaster, the<br />
company now has to deal with accusations <strong>of</strong> “price gouging” by angry Elton John fans in<br />
Saskatchewan. When tickets for Elton John’s performance in the capital city <strong>of</strong> Saskatoon<br />
went on sale, fans discovered that Ticketmaster had already sold out <strong>of</strong> their allotment, and<br />
instead recommended fans try to buy tickets at Tickets Now, a secondary ticketing site<br />
owned by Ticketmaster. Not only did Tickets Now already have tickets for sale, but they<br />
were also demanding much higher prices than originally posted on Ticketmaster, leading<br />
fans to accuse the company <strong>of</strong> scalping. ... Ticketmaster said they were not aware they were<br />
shuffling fans to Tickets Now and has since removed the link. The company’s head <strong>of</strong><br />
ticketing in Saskatchewan said, “The inventory belongs to the promoter and artist, and the<br />
artist determines who has what privileges in advance <strong>of</strong> the public on sale or not, like fan<br />
clubs for instance.”<br />
Rolling Stone, July 14, 2008<br />
Copyright © 2010 Pearson Education Canada
86 CHAPTER 5<br />
a. What is “price-gouging”? Is price gouging in the social interest or self-interest?<br />
"Price gouging" is a term used to describe a situation in which a seller sells a good at a price that is<br />
higher than what is considered reasonable or fair. In common usage, "price gouging" also refers to<br />
prices that are set by practices inconsistent with a competitive market.<br />
Choices made in self-interest are the choices that you think are the best ones available for you. Choices<br />
in the social interest are choices that are the best ones for society as a whole. If the higher price arises<br />
because <strong>of</strong> an increase in demand or a decrease in supply or a combination <strong>of</strong> both, then the higher price<br />
is the equilibrium price, the market is efficient, and the higher price is in the social interest. Total<br />
surplus is maximized.The higher price is also in the self-interest <strong>of</strong> Ticketmaster. It is setting the<br />
price to maximize pr<strong>of</strong>it.<br />
b. Explain the effect <strong>of</strong> the company’s “scalping” on consumer surplus and producer surplus.<br />
A person who buys a ticket from a scalper and attends the concert receives a smaller consumer surplus<br />
than he or she would have received if he or she had paid the original price for the ticket. The scalper sells<br />
the ticket for more than he paid for it, so he receives a producer surplus. The scalper converts some<br />
consumer surplus to producer surplus. Total surplus, the sum <strong>of</strong> consumer surplus and producer surplus,<br />
does not change. So “scalping” reduces the consumer surplus and increases the producer surplus but<br />
does not change total surplus.<br />
c. Evaluation the “fairness” <strong>of</strong> Ticketmaster “shuffling fans to Tickets Now” when the<br />
concert tickets went on sale to the public.<br />
Ticketmaster's actions were unfair by the fair results view because the tickets did not necessarily go to the<br />
poorest people. The tickets went to the richer people who could afford the higher priced tickets on sale<br />
at “Tickets Now”. Ticketmaster' actions were fair by the fair rules view because the ticket transactions<br />
involved voluntary exchange.<br />
d. Describe the allocation method used when the “artist determines who has what privileges<br />
in advance <strong>of</strong> the public on sale or not, like fan clubs for instance.”<br />
A command system allocates resources by the order (command) <strong>of</strong> someone in authority. When "the<br />
artist determines who has what privileges in advance <strong>of</strong> the public on sale or not, like fan clubs for<br />
instance", the artist orders or commands who will get the tickets.<br />
15. Fight Over Water Rates; Escondido Farmers Say Increase Would Put Them Out <strong>of</strong> Business<br />
The city is considering significant increases in water rates for agriculture, which historically<br />
has paid less than residential and business users. . . . [S]ince 1993, water rates have gone up<br />
more than 90 percent for residential customers while agricultural users. . .have seen<br />
increases <strong>of</strong> only about 50 percent, . . .<br />
The San Diego Union-Tribune, June 14, 2006<br />
a. Do you think that the allocation <strong>of</strong> water among San Diego agricultural and residential<br />
users is likely to be efficient? Explain your answer.<br />
The allocation <strong>of</strong> water is almost surely inefficient. If the marginal social cost curve <strong>of</strong> distributing water<br />
is the same for agricultural and residential users, as is probably the case, the only way that the allocation<br />
scheme can be efficient is if the marginal social benefit curve <strong>of</strong> agricultural lies below the marginal<br />
social benefit curve <strong>of</strong> residential users. Such a situation seems unlikely because water is necessary for<br />
agricultural users to grow their crops so the marginal social benefit <strong>of</strong> water to farmers probably exceeds<br />
that for residential users.<br />
b. If agricultural users pay a higher price for water, will the allocation <strong>of</strong> resources become<br />
more efficient?<br />
If agricultural users pay a higher rate for water, probably the allocation <strong>of</strong> resources will be more<br />
efficient. Efficiency requires that marginal social benefit equals marginal social cost. Currently it is likely<br />
the case that the marginal social benefit <strong>of</strong> the last unit <strong>of</strong> water for agricultural users is less than the<br />
marginal social cost <strong>of</strong> producing the last unit <strong>of</strong> water.<br />
Copyright © 2010 Pearson Education Canada
<strong>EFFICIENCY</strong> <strong>AND</strong> <strong>EQUITY</strong> 87<br />
c. If agricultural users pay a higher price for water, what will happen to consumer surplus<br />
and producer surplus from water?<br />
If the price paid by agricultural users rises, the consumer surplus <strong>of</strong> agricultural users decreases and the<br />
producer surplus increases.<br />
d. Is the difference in price paid by agricultural and residential users fair?<br />
According to the “fair results” approach, the difference in price is fair only if agricultural users are poorer<br />
than residential users. If, however, agricultural users are wealthier than or comparable to residential<br />
users, the difference in price is not fair. The difference in price is not fair according to the “fair rules”<br />
approach because the price <strong>of</strong> water is not determined in competitive markets.<br />
15. After you have studied Reading Between the Lines on pp. 122–123, answer the following<br />
questions:<br />
a. What is the major problem in achieving an efficient use <strong>of</strong> the world’s water?<br />
Water needs to be transported from where it is available to where it is needed. This basic issue leads to<br />
two major problems: Overproduction in some areas and underproduction in other areas. Often<br />
overproduction in an area leads to underproduction later in the same area. In particular, markets in<br />
water are not competitive. In many areas, water is “free” to whomever digs a deep enough well. As a<br />
result, too many people dig wells and water is overproduced. If the overproduction is bad enough, the<br />
level <strong>of</strong> groundwater can be reduced so far that it becomes literally impossible to extract any water. Then<br />
water needs to be transported to the now arid area. In this case, <strong>of</strong>ten the government transports the<br />
water and sells it at a very low price or gives it away. But because the government does not sell the water<br />
at an equilibrium price (and because the government is not motivated by seeking pr<strong>of</strong>it) less water is<br />
transported than the efficient quantity.<br />
b. If there were a global market in water, like there is in oil, how do you think the market<br />
would work?<br />
The market for water would be more efficient than the current situation. Areas with a great deal <strong>of</strong><br />
water, say Canada, could export water to areas with less water, say Mexico. If water was purchased and<br />
sold in markets, there would be greater incentive to build desalination plants where they are practical as<br />
well as greater incentive to conserve water where it is in abundance.<br />
c. Would a free world market in water achieve an efficient use <strong>of</strong> the world’s water resources?<br />
Explain why or why not.<br />
A free world market in water likely would (eventually) bring an efficient use <strong>of</strong> resources as the necessary<br />
infrastructure was constructed. Of the factors that can lead to inefficiency (government price and<br />
quantity regulations, monopoly power, and so forth) the only issue that could possibly lead to<br />
inefficiency is the point that water is a common resource in some situations.<br />
d. Would a free world market in water achieve a fair use <strong>of</strong> the world’s water resources?<br />
Explain why or why not and be clear about the concept <strong>of</strong> fairness that you are using.<br />
A “fair results” approach to fairness would argue that in third world countries, very poor inhabitants (for<br />
example, nomads) would not be able to afford “enough” water and so some redistribution is needed for<br />
the sake <strong>of</strong> fairness. A “fair rules” approach to fairness asserts that a competitive market is enough to<br />
insure fairness.<br />
Copyright © 2010 Pearson Education Canada
88 CHAPTER 5<br />
17. Use the link on MyEconLab (Chapter Resources, Chapter 5, <strong>Web</strong> links) to visit the <strong>Web</strong> site<br />
<strong>of</strong> Health Action International and read the article by Catrin Schulte-Hillen entitled “Study<br />
concerning the availability and price <strong>of</strong> AZT.” Then answer the following questions and<br />
explain your answers using the concepts <strong>of</strong> marginal benefit, marginal cost, price, consumer<br />
surplus, and producer surplus.<br />
a. What is the range <strong>of</strong> retail prices <strong>of</strong> AZT across the countries covered by the study?<br />
The retail (pharmacy) prices range from $0.67 in Thailand to $2.80 in Germany.<br />
b. What, if anything, do you think could be done to increase the quantity <strong>of</strong> AZT and decrease<br />
its price?<br />
The article states that “The major determining factor is the existence <strong>of</strong> alternative products on the<br />
market, i.e. competition.” So one factor that will lead to lower prices and increased quantities is either<br />
disregard the patent or wait until the patent expires. In either case, the increased competition will lead to<br />
lower prices and increased quantities. If the government does not want to disregard the patent, it could<br />
try to negotiate lower prices by perhaps arranging purchases <strong>of</strong> larger quantities. Or the government<br />
could simply lower the allowable legal price for AZT in the nation. The drawback with this last policy is<br />
that it might lead to a decrease in the quantity <strong>of</strong> AZT available.<br />
c. Canadian online pharmacies sell AZT to Americans for a price below the U.S. price. Does<br />
this practice increase or decrease consumer surplus, producer surplus, and deadweight loss<br />
from AZT in the United States?<br />
The practice <strong>of</strong> Canadian on-line pharmacies selling AZT in the United States at a price below the U.S.<br />
price increases consumer surplus in the United States. U.S. producers sell AZT to Canadian pharmacies,<br />
but at a lower price than they can sell the drug in the United States. To the extent that the Canadian<br />
sales replace sales <strong>of</strong> U.S.-sold products, producer surplus in the Untied States decreases. However, to<br />
the extent that the product is manufactured in the United States and to the extent that these sales are<br />
“new,” that is, would not have been made except for the lower price, the sales increase U.S. producer<br />
surplus. Producer surplus in Canada increases.<br />
Copyright © 2010 Pearson Education Canada