Muc Mhara Ireland's Smallest Whale - Marine Institute Open Access ...
Muc Mhara Ireland's Smallest Whale - Marine Institute Open Access ...
Muc Mhara Ireland's Smallest Whale - Marine Institute Open Access ...

Create successful ePaper yourself
Turn your PDF publications into a flip-book with our unique Google optimized e-Paper software.
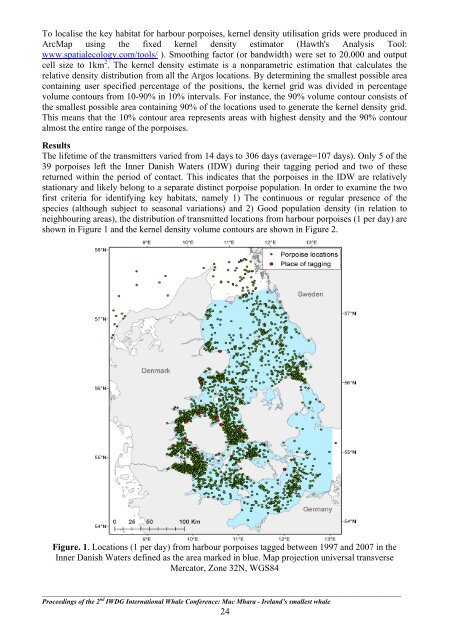
To localise the key habitat for harbour porpoises, kernel density utilisation grids were produced in<br />
ArcMap using the fixed kernel density estimator (Hawth's Analysis Tool:<br />
www.spatialecology.com/tools/ ). Smoothing factor (or bandwidth) were set to 20.000 and output<br />
cell size to 1km 2 . The kernel density estimate is a nonparametric estimation that calculates the<br />
relative density distribution from all the Argos locations. By determining the smallest possible area<br />
containing user specified percentage of the positions, the kernel grid was divided in percentage<br />
volume contours from 10-90% in 10% intervals. For instance, the 90% volume contour consists of<br />
the smallest possible area containing 90% of the locations used to generate the kernel density grid.<br />
This means that the 10% contour area represents areas with highest density and the 90% contour<br />
almost the entire range of the porpoises.<br />
Results<br />
The lifetime of the transmitters varied from 14 days to 306 days (average=107 days). Only 5 of the<br />
39 porpoises left the Inner Danish Waters (IDW) during their tagging period and two of these<br />
returned within the period of contact. This indicates that the porpoises in the IDW are relatively<br />
stationary and likely belong to a separate distinct porpoise population. In order to examine the two<br />
first criteria for identifying key habitats, namely 1) The continuous or regular presence of the<br />
species (although subject to seasonal variations) and 2) Good population density (in relation to<br />
neighbouring areas), the distribution of transmitted locations from harbour porpoises (1 per day) are<br />
shown in Figure 1 and the kernel density volume contours are shown in Figure 2.<br />
Figure. 1. Locations (1 per day) from harbour porpoises tagged between 1997 and 2007 in the<br />
Inner Danish Waters defined as the area marked in blue. Map projection universal transverse<br />
Mercator, Zone 32N, WGS84<br />
_________________________________________________________________________________________________________<br />
Proceedings of the 2 nd IWDG International <strong>Whale</strong> Conference: <strong>Muc</strong> <strong>Mhara</strong> - Ireland’s smallest whale<br />
24