Multicolor Flow Cytometry: Setup and Optimization ... - BD Biosciences
Multicolor Flow Cytometry: Setup and Optimization ... - BD Biosciences
Multicolor Flow Cytometry: Setup and Optimization ... - BD Biosciences

You also want an ePaper? Increase the reach of your titles
YUMPU automatically turns print PDFs into web optimized ePapers that Google loves.
23-13660-00<br />
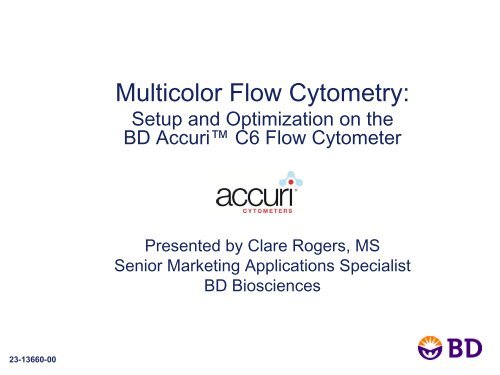
<strong>Multicolor</strong> <strong>Flow</strong> <strong>Cytometry</strong>:<br />
<strong>Setup</strong> <strong>and</strong> <strong>Optimization</strong> on the<br />
<strong>BD</strong> Accuri C6 <strong>Flow</strong> Cytometer<br />
Presented by Clare Rogers, MS<br />
Senior Marketing Applications Specialist<br />
<strong>BD</strong> <strong>Biosciences</strong>
Webinar Overview<br />
• <strong>Multicolor</strong> flow: successful application prerequisites<br />
o Proper cytometer performance, setup, <strong>and</strong> data collection<br />
o Careful reagent selection <strong>and</strong> sample preparation<br />
o Proper classification (analysis) of multiple combinations of<br />
positive <strong>and</strong> negative populations: CD markers as example
Typical problems <strong>and</strong> challenges<br />
• Instrument setup considerations.<br />
• Markers are expressed at different levels.<br />
• Some dyes are much brighter than others.<br />
• Emission spillover contributes to optical background.<br />
• Markers may be available only in certain dyes.<br />
• Additional complexity increases error possibilities.
The <strong>BD</strong> Accuri C6 flow cytometer: unique system attributes<br />
An affordable, full-featured, easy-to-use flow cytometer<br />
Two lasers <strong>and</strong> six detectors
<strong>BD</strong> Accuri C6 features that simplify multicolor analysis<br />
• Four fluorescence detectors<br />
• Totally digital system<br />
• Easy setup for data collection<br />
o Locked down optical alignment<br />
o No laser delay to set<br />
o Validate system with beads <strong>and</strong> collect data<br />
• Predictable fluorescence spillover values<br />
• Flexibility in fluorochrome choice using:<br />
o Optional optical filters<br />
o Selectable Lasers option
System innovation: alignment <strong>and</strong> signal detection are optimized<br />
<strong>and</strong> locked down at manufacture<br />
488-nm<br />
solid state laser<br />
640-nm diode laser<br />
PMTs for fluorescence<br />
detection<br />
Diodes for scatter<br />
detection<br />
FL1<br />
533/30<br />
FL4<br />
675/25<br />
FL2<br />
585/40<br />
SSC<br />
FL3<br />
670 LP<br />
FSC
Fluorescence detection sensitivity is pre-optimized,<br />
obviating the need for voltage control<br />
FL1 = 533/30 FL2 = 585/40<br />
FL4 = 675/25<br />
FL3 = 670LP<br />
SPHERO Rainbow Calibration Particles (Cat. No. 653144)<br />
Allophycocyanin (APC) Calibration<br />
Particles (Cat. No. 653145)<br />
FL4 = 675/25
Validate system performance before each experiment, set<br />
appropriate threshold, collect data<br />
Keep daily bead runs all together in one <strong>BD</strong> Accuri software file.<br />
View data in the Statistics Tab.
Pre-optimizing voltage <strong>and</strong> gain settings does not reduce the<br />
fluorescence detection range<br />
4-log<br />
5.2-log<br />
6.2-log
Fixing optical alignment <strong>and</strong> pre-optimizing voltage <strong>and</strong> gain<br />
settings results in predictable spillover<br />
Suggested Compensation Values for the <strong>BD</strong> Accuri C6<br />
FITC PE PerCP PerCP-<br />
Cy5.5<br />
PE-Cy7 APC<br />
FL1 (533 BP) ___ 3.2 0.00 0.0 0.50 0.0<br />
FL2 (585 BP) 7.5 ___ 0.00 0.00 1.50 0.0<br />
FL3 (670 BP) 1.0 19.5 ___ ___ ___ 0.8<br />
FL4 (675 BP) 0.0 0.0 3.00 12.00 0.00 ___
Flexible fluorochrome choice: optional filters<br />
User<br />
changeable<br />
optical filters<br />
510/15<br />
540/20<br />
565/20<br />
610/20<br />
780/60<br />
FL2: 585/40<br />
Separation of GFP <strong>and</strong> YFP signals<br />
St<strong>and</strong>ard Filters GFP/YFP Combo<br />
YFP<br />
FL1: 533/30<br />
GFP<br />
YFP<br />
FL2: 540/20<br />
FL1: 510/15<br />
GFP
Flexible fluorochrome choice: Selectable Lasers option<br />
Selectable Lasers Module:<br />
Reassign laser <strong>and</strong> detector associations<br />
St<strong>and</strong>ard: 488 FL1,2,3 640 FL4<br />
2-blue 2-red: 488 FL1,2 640 FL3,4<br />
4-blue: 488 FL1,2,3,4<br />
FL1 FL2 FL3 FL4<br />
St<strong>and</strong>ard: FITC PE PerCP-Cy5.5 APC<br />
2-blue 2-red: FITC PE APC-Cy7 APC<br />
4-blue: FITC PE PE-Cy5 PE-Cy7
Webinar Overview<br />
• <strong>Multicolor</strong> flow: successful application prerequisites:<br />
o Proper cytometer performance, setup, <strong>and</strong> data collection<br />
o Careful reagent selection <strong>and</strong> sample preparation<br />
o Proper classification (analysis) of multiple combinations of<br />
positive <strong>and</strong> negative populations: CD markers as example
Example: 4-color T-cell immunophenotyping<br />
• Goals<br />
o Identify lymphs, monos, <strong>and</strong> grans by CD45<br />
<strong>and</strong> SSC properties<br />
o Within the lymphocyte population, determine the<br />
percentage of helper (CD3 + CD4 + ) <strong>and</strong> cytotoxic<br />
(CD3 + CD8 + ) T cells<br />
o Within the monocyte population, determine the<br />
percentage of CD4 + cells
1<br />
2<br />
3<br />
4<br />
5<br />
6<br />
Principles of Panel Design: Reagent Selection<br />
Identify required markers <strong>and</strong> reagents (CD45, 3, 4, 8).<br />
Match fluorochromes by brightness (values from stain<br />
index) according to antigen density <strong>and</strong> distribution<br />
(published values or TDS).<br />
Minimize spectral overlap.<br />
Use t<strong>and</strong>em dyes with consideration of their technical<br />
limitations.<br />
Check reagent availability.<br />
Lay out experimental plan with appropriate controls<br />
included.
Glossary: Antigen Density<br />
• Level of antigen expression<br />
on a cell:<br />
o Antigen expression can vary<br />
due to cell activation level <strong>and</strong><br />
functional differences.<br />
o Antigen density can be a<br />
range (i.e., smeared<br />
population).
Pick possible fluorochromes based on your instrument configuration<br />
3-blue, 1-red (St<strong>and</strong>ard Config)<br />
Detector<br />
Position<br />
Filter<br />
Options Fluorophore<br />
FL1 533/30 FITC, GFP, YFP,<br />
CFSE,<br />
AlexaFluor®488<br />
510/15<br />
GFP<br />
FL2 585/40 PE, PI, PE-CF594<br />
540/20<br />
YFP<br />
FL3 670 LP PerCP, PE-Cy5,<br />
PerCP-Cy5.5, PE-<br />
Cy7, PI, 7-AAD<br />
610/20<br />
RFP, PI<br />
PE-CF594<br />
FL4 675/25 APC,<br />
AlexaFluor®647<br />
780/60<br />
APC-H7, APC-Cy7
Choose antigen-fluor pairing based on relative intensities<br />
Antigen density C6 fluor intensity<br />
CD45 lym<br />
CD3<br />
CD8<br />
CD4 lym<br />
CD45 mon<br />
CD4 mon<br />
CD45 gran<br />
high<br />
low<br />
PE<br />
APC<br />
PerCP-Cy5.5<br />
PE-Cy7<br />
FITC<br />
PerCP
Choose antigen-fluor pairing based on relative intensities<br />
Antigen density Fluor intensity<br />
CD45 lym<br />
CD3<br />
CD8<br />
CD4 lym<br />
CD45 mon<br />
CD4 mon<br />
CD45 gran<br />
high<br />
low<br />
PE<br />
APC<br />
PerCP-Cy5.5<br />
PE-Cy7<br />
FITC<br />
PerCP<br />
CD4 PE<br />
CD3 APC<br />
CD45 PerCP-Cy5.5<br />
CD8 FITC
1<br />
2<br />
3<br />
4<br />
5<br />
6<br />
Principles of panel design: reagent selection<br />
Identify required markers <strong>and</strong> reagents (CD45, 3, 4, 8).<br />
Match fluorochromes by brightness (values from stain<br />
index) according to antigen density <strong>and</strong> distribution<br />
(published values or TDS).<br />
Minimize spectral overlap.<br />
Use t<strong>and</strong>em dyes with consideration of their technical<br />
limitations.<br />
Check reagent availability.<br />
Lay out experimental plan with appropriate controls<br />
included.
Fluorescence spillover<br />
• The single most important factor affecting<br />
resolution sensitivity (SI) in multicolor flow<br />
cytometry experiments.<br />
• Fluorescence spillover from other channels:<br />
o Directly <strong>and</strong> irreversibly reduces the resolution<br />
sensitivity of that channel<br />
o Contributes to background<br />
• This “background” is mathematically accounted<br />
for in the process called compensation.
Spillover irreversibly decreases resolution sensitivity<br />
Population resolution for a<br />
given fluorescence parameter<br />
is decreased by increased<br />
spread due to spillover from<br />
other fluorochromes.<br />
• The dim CD4 + cells, when negative for CD8 (orange ball), are easily<br />
resolved from the double negative.<br />
• The same dim CD4 + cells, when positive for CD8, cannot be resolved<br />
from CD4 – , CD8 + cells.<br />
• To improve resolution (sensitivity) of subpopulations, including dim<br />
subpopulations, one must minimize the amount of spillover from<br />
other fluorochromes.
Spillover irreversibly decreases resolution sensitivity<br />
This spread is NOT eliminated by compensation.<br />
More colors = more spillover = higher background
Average compensation values for various fluor combos: <strong>BD</strong> Accuri C6<br />
FITC, PE, PerCp-Cy5.5, APC, Compensation dialog layout:<br />
Correct FL1 by: PE PerCP-Cy5.5 APC<br />
3.20 0.00 0.00<br />
Correct FL2 by: FITC PerCP-Cy5.5 APC<br />
7.50 0.00 0.00<br />
Correct FL3 by: FITC PE APC<br />
0.5 19.50 0.80<br />
Correct FL4 by: FITC PE PerCP-Cy5.5<br />
0.00 0.00 12.00
Strategies to minimize spillover issues<br />
• Minimize the potential for spectral overlap<br />
• Spillover estimates available in the spectrum viewer
1<br />
2<br />
3<br />
4<br />
5<br />
6<br />
Principles of panel design: reagent selection<br />
Identify required markers <strong>and</strong> reagents (CD45, 3, 4, 8).<br />
Match fluorochromes by brightness (values from stain<br />
index) according to antigen density <strong>and</strong> distribution<br />
(published values or TDS).<br />
Minimize spectral overlap.<br />
Use t<strong>and</strong>em dyes with consideration of their technical<br />
limitations.<br />
Check reagent availability.<br />
Lay out experimental plan with appropriate controls<br />
included.
Use t<strong>and</strong>em dyes with consideration of their technical limitations<br />
• Compensation requirements for t<strong>and</strong>em dye<br />
conjugates can vary<br />
• Certain t<strong>and</strong>em dye conjugates (APC-Cy7,<br />
PE-Cy7) can degrade with exposure to light,<br />
elevated temperature, <strong>and</strong> fixation.<br />
o Minimize exposure to these conditions.<br />
o Use <strong>BD</strong> Stabilizing Fixative for final fixation.<br />
o Use APC-H7 when possible.
1<br />
2<br />
3<br />
4<br />
5<br />
6<br />
Principles of panel design: reagent selection<br />
Identify required markers <strong>and</strong> reagents (CD45, 3, 4, 8).<br />
Match fluorochromes by brightness (values from stain<br />
index) according to antigen density <strong>and</strong> distribution<br />
(published values or TDS).<br />
Minimize spectral overlap.<br />
Use t<strong>and</strong>em dyes with consideration of their technical<br />
limitations.<br />
Check reagent availability.<br />
Lay out experimental plan with appropriate controls<br />
included.
Availability: Use <strong>BD</strong> FACSelect <strong>Multicolor</strong> Panel Designer<br />
Antigen density Fluor intensity<br />
CD45 lym<br />
CD3<br />
CD8<br />
CD4 lym<br />
CD45 mon<br />
CD4 mon<br />
CD45 gran<br />
high<br />
low<br />
PE<br />
APC<br />
PerCP-Cy5.5<br />
PE-Cy7<br />
FITC<br />
PerCP<br />
CD4 PE<br />
CD3 APC<br />
CD45 PerCP-Cy5.5<br />
CD8 FITC
Tools: <strong>BD</strong> FACSelect <strong>Multicolor</strong> Panel Designer<br />
bdbiosciences.com/research/multicolor
Tools: <strong>BD</strong> FACSelect <strong>Multicolor</strong> Panel Designer<br />
Step 1: Select target species<br />
Step 2: Select specificities<br />
Step 3: Select lasers available or fluors desired<br />
Step 4: Search<br />
1 2<br />
3<br />
4
Tools: <strong>BD</strong> FACSelect <strong>Multicolor</strong> Panel Designer<br />
View available conjugates
Tools: <strong>BD</strong> FACSelect <strong>Multicolor</strong> Panel Designer<br />
Select desired clone Close window
Tools: <strong>BD</strong> FACSelect <strong>Multicolor</strong> Panel Designer<br />
Review the selected panel
Before you perform your first experiment:<br />
Optimize your new antibodies!<br />
<strong>Optimization</strong> data: CD4 + to CD4 -<br />
281<br />
25,000<br />
5 µL Ab/50 µL whole blood (1/10)<br />
275<br />
2,154<br />
1 µL Ab/50 µL whole blood (1/50)
1<br />
2<br />
3<br />
4<br />
5<br />
6<br />
Principles of panel design: reagent selection<br />
Identify required markers <strong>and</strong> reagents (CD45, 3, 4, 8).<br />
Match fluorochromes by brightness (values from stain<br />
index) according to antigen density <strong>and</strong> distribution<br />
(published values or TDS).<br />
Minimize spectral overlap.<br />
Use t<strong>and</strong>em dyes with consideration of their technical<br />
limitations.<br />
Check reagent availability.<br />
Lay out experimental plan with appropriate controls<br />
included.
What controls do you need <strong>and</strong> why?<br />
• Instrument setup controls (eg, <strong>BD</strong> CompBead<br />
particles)<br />
• Gating controls (eg, FMO)<br />
• Biological controls (eg, unstimulated samples)<br />
This will allow you to:<br />
• Obtain consistent setup <strong>and</strong> compensation<br />
• Gate populations reproducibly<br />
• Make appropriate biological comparisons <strong>and</strong><br />
conclusions
Use FMO controls for accurate data analysis<br />
• Fluorescence minus one (FMO) controls contain<br />
all the lineage markers except the one of interest.<br />
• For low-density or smeared populations (eg,<br />
activation markers), FMOs allow accurate<br />
delineation of positively vs negatively stained<br />
cells.
Example: 4-color T-cell immunophenotyping<br />
• Goals<br />
o Identify lymphs, monos, <strong>and</strong> grans by CD45<br />
<strong>and</strong> SSC properties<br />
o Within the lymphocyte population, determine<br />
the percentage of helper (CD3 + CD4 + ) <strong>and</strong><br />
cytotoxic (CD3 + CD8 + ) T cells<br />
o Within the monocyte population, determine<br />
the percentage of CD4 + cells
Lay out your experimental plan<br />
Filter 533/30 585/40 670 LP 675/25<br />
FL1 FL2 FL3 FL4<br />
Tube FITC PE PerCP‐Cy5.5 APC Purpose<br />
1 ‐ ‐ ‐ ‐ Background signal<br />
2 CD8 ‐ ‐ ‐ Spillover of FITC<br />
3 ‐ CD4 ‐ ‐ Spillover of PE<br />
4 ‐ ‐ CD45 ‐ Spillover PerCP‐Cy5.5<br />
5 ‐ ‐ ‐ CD3 Spillover APC<br />
6 ‐ ‐ CD45 CD3 Gating control:FMO (Fluorescence Minus One)<br />
7 CD8 ‐ CD45 CD3 FMO<br />
8 ‐ CD4 CD45 CD3 FMO<br />
9 CD8 CD4 CD45 CD3 Test sample
Using the controls to analyze the data<br />
(1) Apply compensation using single-color controls<br />
Lymph<br />
gate<br />
FITC PE PerCP-Cy5.5 APC
Using the controls to analyze the data<br />
(2) Set the gate on the desired population using a primary classifier:<br />
In this case it is the lymphocytes, defined as CD45 bright SSC low<br />
Goal 1: Identify lymphocytes, monocytes, <strong>and</strong> granulocytes
Using the controls to analyze the data<br />
(3) Apply the primary classifier gate to the appropriate FMO plots to<br />
determine gate placement.<br />
FMO (CD45 + , CD3 + )<br />
FMO to set PE background:<br />
Contains: FITC, PerCP-Cy5.5, APC<br />
FMO to set FITC background:<br />
Contains: PE, PerCP-Cy5.5, APC
Obtain your data!!<br />
(4) Subtract the background from the FMO plots to obtain percent<br />
positives for each population.<br />
Goal 2: Of the lymphocyte population, what percentage are:<br />
CD3 + CD4 + : 60.1 - 0.2 = 59.9% CD3 + CD8 + : 12.7 - 0.1 = 12.6%
Obtain your data!!<br />
Goal 3: Of the monocyte population, what percentage are CD4 + ?<br />
96.13% - 0.3% = 95.83%
Webinar Summary<br />
• <strong>Multicolor</strong> flow: successful application<br />
prerequisites<br />
o Proper cytometer performance, setup, <strong>and</strong> data<br />
collection<br />
The <strong>BD</strong> Accuri C6 is well suited for these applications.<br />
Fluorescence detection <strong>and</strong> the optical bench are<br />
optimized at manufacture.<br />
Easy to use: validate <strong>and</strong> collect samples<br />
o Careful reagent selection <strong>and</strong> sample preparation<br />
<strong>BD</strong> FACSelect multicolor panel designer, along with<br />
antigen density <strong>and</strong> stain index charts, are <strong>BD</strong> tools<br />
that simplify this step.<br />
o Proper classification (analysis) of multiple<br />
combinations of positive <strong>and</strong> negative<br />
populations
• Maria Dinkelmann<br />
• Stacey Roys<br />
• Collin Rich<br />
• Leo Ostruszka<br />
• <strong>BD</strong> Accuri Eng. Team<br />
Acknowledgments<br />
• Maria Jaimes<br />
• Mark Edinger<br />
• Ming Yan<br />
• Alan Stall<br />
• Joe Trotter<br />
• Skip Maino<br />
• Margaret Inokuma<br />
• Bob Hoffman<br />
For Research Use Only. Not for use in diagnostic or therapeutic procedures.<br />
Class 1 Laser Product.<br />
Alexa Fluor® is a registered trademark of Molecular Probes, Inc.<br />
Cy is a trademark of Amersham <strong>Biosciences</strong> Corp. Cy dyes are subject to proprietary rights of Amersham<br />
<strong>Biosciences</strong> Corp <strong>and</strong> Carnegie Mellon University <strong>and</strong> are made <strong>and</strong> sold under license from Amersham<br />
<strong>Biosciences</strong> Corp only for research <strong>and</strong> in vitro diagnostic use. Any other use requires a commercial sublicense<br />
from Amersham <strong>Biosciences</strong> Corp, 800 Centennial Avenue, Piscataway, NJ 08855-1327, USA.<br />
Microsoft <strong>and</strong> Excel are registered trademarks of Microsoft Corporation.<br />
SPHERO is a trademark of Spherotech, Inc.<br />
<strong>BD</strong>, <strong>BD</strong> Logo <strong>and</strong> all other trademarks are property of Becton, Dickinson <strong>and</strong> Company. © 2011 <strong>BD</strong><br />
• Pat Collins<br />
• Joerg Hildmann<br />
• Holden Maecker<br />
• Mirion Schultz<br />
• Barny Abrams<br />
• Laurel Nomura<br />
• Dennis Sasaki