Mapping microphytobenthos in the intertidal zone of Northern ...
Mapping microphytobenthos in the intertidal zone of Northern ...
Mapping microphytobenthos in the intertidal zone of Northern ...

You also want an ePaper? Increase the reach of your titles
YUMPU automatically turns print PDFs into web optimized ePapers that Google loves.
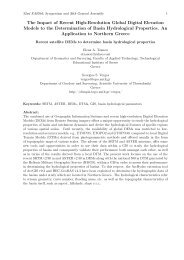
Figure 8. Chlorophyll a surface concentration maps derived from ROSIS data: a – “false color composite” (red: 752.5 nm;<br />
green: 672.5 nm; blue: 632.5 nm); b – simple band ratio; c – normalized ratio; d – scaled band area<br />
Table 2 . Comparison between Chl a concentrations (mg.m -2 ) derived from field samples and from ROSIS data –<br />
NR: Normalized ratio; SBA: Scaled Band Area.<br />
SITES SAMPLES RATIO NR SBA<br />
I 474.39 12.90 10.23 27.44<br />
J 199.05 13.99 13.4 23.53<br />
K 360.45 8.38 6.92 22.37<br />
L 91.76 10.56 6.78 19.98<br />
M 517.88 47.36 48.37 69.04<br />
N 204.72 11.20 10.17 25.23<br />
O 98.86 24.55 20.86 39.80<br />
P 5.12 42.43 35.70 53.60<br />
Q 108.14 52.62 49.90 71.07<br />
R 149.04 11.34 13.42 31.25<br />
S 17.93 6.09 7.37 15.53<br />
T 3.39 2.19 1.12 4.72<br />
U 12.28 4.73 7.23 14.38<br />
406