Mapping microphytobenthos in the intertidal zone of Northern ...
Mapping microphytobenthos in the intertidal zone of Northern ...
Mapping microphytobenthos in the intertidal zone of Northern ...

You also want an ePaper? Increase the reach of your titles
YUMPU automatically turns print PDFs into web optimized ePapers that Google loves.
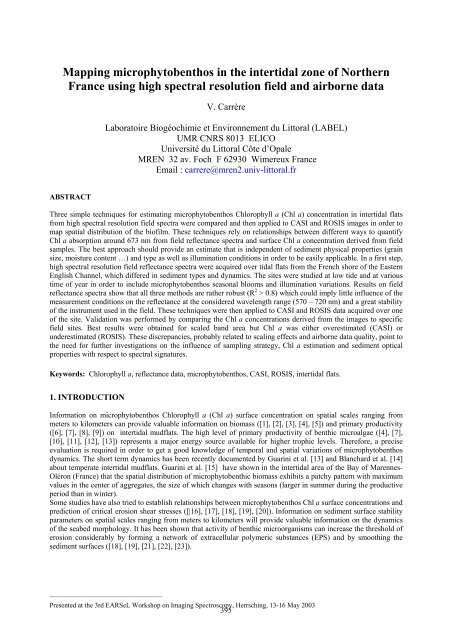
<strong>Mapp<strong>in</strong>g</strong> <strong>microphytobenthos</strong> <strong>in</strong> <strong>the</strong> <strong>in</strong>tertidal <strong>zone</strong> <strong>of</strong> Nor<strong>the</strong>rn<br />
France us<strong>in</strong>g high spectral resolution field and airborne data<br />
ABSTRACT<br />
V. Carrère<br />
Laboratoire Biogéochimie et Environnement du Littoral (LABEL)<br />
UMR CNRS 8013 ELICO<br />
Université du Littoral Côte d’Opale<br />
MREN 32 av. Foch F 62930 Wimereux France<br />
Email : carrere@mren2.univ-littoral.fr<br />
Three simple techniques for estimat<strong>in</strong>g <strong>microphytobenthos</strong> Chlorophyll a (Chl a) concentration <strong>in</strong> <strong>in</strong>tertidal flats<br />
from high spectral resolution field spectra were compared and <strong>the</strong>n applied to CASI and ROSIS images <strong>in</strong> order to<br />
map spatial distribution <strong>of</strong> <strong>the</strong> bi<strong>of</strong>ilm. These techniques rely on relationships between different ways to quantify<br />
Chl a absorption around 673 nm from field reflectance spectra and surface Chl a concentration derived from field<br />
samples. The best approach should provide an estimate that is <strong>in</strong>dependent <strong>of</strong> sediment physical properties (gra<strong>in</strong><br />
size, moisture content …) and type as well as illum<strong>in</strong>ation conditions <strong>in</strong> order to be easily applicable. In a first step,<br />
high spectral resolution field reflectance spectra were acquired over tidal flats from <strong>the</strong> French shore <strong>of</strong> <strong>the</strong> Eastern<br />
English Channel, which differed <strong>in</strong> sediment types and dynamics. The sites were studied at low tide and at various<br />
time <strong>of</strong> year <strong>in</strong> order to <strong>in</strong>clude <strong>microphytobenthos</strong> seasonal blooms and illum<strong>in</strong>ation variations. Results on field<br />
reflectance spectra show that all three methods are ra<strong>the</strong>r robust (R 2 > 0.8) which could imply little <strong>in</strong>fluence <strong>of</strong> <strong>the</strong><br />
measurement conditions on <strong>the</strong> reflectance at <strong>the</strong> considered wavelength range (570 – 720 nm) and a great stability<br />
<strong>of</strong> <strong>the</strong> <strong>in</strong>strument used <strong>in</strong> <strong>the</strong> field. These techniques were <strong>the</strong>n applied to CASI and ROSIS data acquired over one<br />
<strong>of</strong> <strong>the</strong> site. Validation was performed by compar<strong>in</strong>g <strong>the</strong> Chl a concentrations derived from <strong>the</strong> images to specific<br />
field sites. Best results were obta<strong>in</strong>ed for scaled band area but Chl a was ei<strong>the</strong>r overestimated (CASI) or<br />
underestimated (ROSIS). These discrepancies, probably related to scal<strong>in</strong>g effects and airborne data quality, po<strong>in</strong>t to<br />
<strong>the</strong> need for fur<strong>the</strong>r <strong>in</strong>vestigations on <strong>the</strong> <strong>in</strong>fluence <strong>of</strong> sampl<strong>in</strong>g strategy, Chl a estimation and sediment optical<br />
properties with respect to spectral signatures.<br />
Keywords: Chlorophyll a, reflectance data, <strong>microphytobenthos</strong>, CASI, ROSIS, <strong>in</strong>tertidal flats.<br />
1. INTRODUCTION<br />
Information on <strong>microphytobenthos</strong> Chlorophyll a (Chl a) surface concentration on spatial scales rang<strong>in</strong>g from<br />
meters to kilometers can provide valuable <strong>in</strong>formation on biomass ([1], [2], [3], [4], [5]) and primary productivity<br />
([6], [7], [8], [9]) on <strong>in</strong>tertidal mudflats. The high level <strong>of</strong> primary productivity <strong>of</strong> benthic microalgae ([4], [7],<br />
[10], [11], [12], [13]) represents a major energy source available for higher trophic levels. Therefore, a precise<br />
evaluation is required <strong>in</strong> order to get a good knowledge <strong>of</strong> temporal and spatial variations <strong>of</strong> <strong>microphytobenthos</strong><br />
dynamics. The short term dynamics has been recently documented by Guar<strong>in</strong>i et al. [13] and Blanchard et al. [14]<br />
about temperate <strong>in</strong>tertidal mudflats. Guar<strong>in</strong>i et al. [15] have shown <strong>in</strong> <strong>the</strong> <strong>in</strong>tertidal area <strong>of</strong> <strong>the</strong> Bay <strong>of</strong> Marennes-<br />
Oléron (France) that <strong>the</strong> spatial distribution <strong>of</strong> microphytobenthic biomass exhibits a patchy pattern with maximum<br />
values <strong>in</strong> <strong>the</strong> center <strong>of</strong> aggregates, <strong>the</strong> size <strong>of</strong> which changes with seasons (larger <strong>in</strong> summer dur<strong>in</strong>g <strong>the</strong> productive<br />
period than <strong>in</strong> w<strong>in</strong>ter).<br />
Some studies have also tried to establish relationships between <strong>microphytobenthos</strong> Chl a surface concentrations and<br />
prediction <strong>of</strong> critical erosion shear stresses ([|16], [17], [18], [19], [20]). Information on sediment surface stability<br />
parameters on spatial scales rang<strong>in</strong>g from meters to kilometers will provide valuable <strong>in</strong>formation on <strong>the</strong> dynamics<br />
<strong>of</strong> <strong>the</strong> seabed morphology. It has been shown that activity <strong>of</strong> benthic microorganisms can <strong>in</strong>crease <strong>the</strong> threshold <strong>of</strong><br />
erosion considerably by form<strong>in</strong>g a network <strong>of</strong> extracellular polymeric substances (EPS) and by smooth<strong>in</strong>g <strong>the</strong><br />
sediment surfaces ([18], [19], [21], [22], [23]).<br />
_________________________________<br />
Presented at <strong>the</strong> 3rd EARSeL Workshop on Imag<strong>in</strong>g Spectroscopy, Herrsch<strong>in</strong>g, 13-16 May 2003<br />
395
At present, mapp<strong>in</strong>g sediments or biomass <strong>in</strong> <strong>in</strong>tertidal areas by conventional methods <strong>in</strong>volves extensive sampl<strong>in</strong>g<br />
programs that are <strong>of</strong>ten difficult <strong>in</strong> practice and expensive <strong>in</strong> time and manpower ([15], [24]). No matter how<br />
extensive such programs are, <strong>the</strong> accuracy <strong>of</strong> <strong>the</strong> resultant maps is limited by <strong>the</strong> need to extrapolate from sample<br />
sites to <strong>the</strong> whole area, usually by l<strong>in</strong>k<strong>in</strong>g similar sites <strong>in</strong> a series <strong>of</strong> contours. Remote sens<strong>in</strong>g may <strong>of</strong>fer a more<br />
efficient method <strong>of</strong> mapp<strong>in</strong>g sediment distribution if sediment types or features are unique <strong>in</strong> <strong>the</strong>ir reflection <strong>of</strong><br />
light and <strong>in</strong>frared radiation, s<strong>in</strong>ce a much less extensive sampl<strong>in</strong>g program with more accurate extrapolation to <strong>the</strong><br />
whole would be <strong>in</strong>volved. The potential <strong>of</strong> remote sens<strong>in</strong>g for mapp<strong>in</strong>g and monitor<strong>in</strong>g <strong>in</strong>tertidal areas has been<br />
realized and successfully applied by workers us<strong>in</strong>g both aerial photography and satellite imagery ([25], [26]).<br />
Detailed mapp<strong>in</strong>g <strong>of</strong> <strong>in</strong>tertidal seaweeds has been carried out <strong>in</strong> Canada by Zacharias et al. [27] and <strong>in</strong> France by<br />
Bajjouk et al. [28] us<strong>in</strong>g Compact Airborne Spectrographic Imager (CASI). Remote sens<strong>in</strong>g at higher spectral and<br />
spatial resolutions us<strong>in</strong>g <strong>in</strong>strument such as CASI <strong>of</strong>fers <strong>the</strong> prospect <strong>of</strong> extremely detailed land cover mapp<strong>in</strong>g and<br />
<strong>the</strong> potential to model erosion and accretion rates <strong>of</strong> <strong>in</strong>tertidal surfaces. Developments <strong>in</strong> hyperspectral remote<br />
sens<strong>in</strong>g have opened up <strong>the</strong> possibility <strong>of</strong> quantify<strong>in</strong>g <strong>in</strong>dividual photosyn<strong>the</strong>tic pigments with<strong>in</strong> vegetation.<br />
However, most published papers present empirical relationships between pigment concentration and various <strong>in</strong>dices<br />
([29], for example). Very few rely on <strong>the</strong> understand<strong>in</strong>g <strong>of</strong> <strong>the</strong> physics <strong>of</strong> <strong>the</strong> reflectance signal to quantitatively<br />
estimate pigment concentrations.<br />
The objective <strong>of</strong> this paper is to present a comparison between three simple, physically based, techniques developed<br />
to quantitatively estimate Chl a surface concentration <strong>in</strong> <strong>the</strong> <strong>in</strong>tertidal <strong>zone</strong> from high spectral resolution field<br />
spectrometer reflectance data. To test <strong>the</strong> robustness <strong>of</strong> <strong>the</strong>se approaches, regression equations developed were used<br />
to predict <strong>the</strong> concentrations <strong>in</strong> newly acquired field data sets.. These algorithms were <strong>the</strong>n applied to airborne<br />
CASI and ROSIS data. F<strong>in</strong>ally, validation was performed, when possible, by us<strong>in</strong>g reference sites to compare Chl a<br />
estimation from <strong>the</strong> images to field samples concentrations.<br />
2. METHODOLOGY<br />
2.1. Study sites<br />
Selected study sites for field spectral measurements are located along <strong>the</strong> French coast <strong>of</strong> <strong>the</strong> Eastern English<br />
Channel (Figure 1). To allow a wide range <strong>of</strong> concentrations and variable species, several campaigns took place at<br />
various times <strong>of</strong> year. Measurements were performed at low tide, <strong>in</strong> 4 different test sites, reflect<strong>in</strong>g different<br />
conditions. From North to South:<br />
- Site 1, Wimereux: this site is typical <strong>of</strong> an hydrodynamically exposed sandy beach habitat that can be<br />
encountered on this shore. Measurements were performed on an area located <strong>in</strong> <strong>the</strong> upper <strong>in</strong>tertidal <strong>zone</strong>, ra<strong>the</strong>r flat<br />
and without sharp topographical features such as ripple marks, high p<strong>in</strong>nacles or deep surge channels. The substrate<br />
was homogeneous medium size sand (200-250 µm, modal size), typical <strong>of</strong> <strong>the</strong> surround<strong>in</strong>g sandy habitat. Due to<br />
<strong>the</strong> highly dynamic environment, <strong>microphytobenthos</strong> is resuspended and surface concentrations at low tide are low.<br />
- Site 2, Baie d’Authie: here, several sites were measured <strong>in</strong> this macrotidal estuary where sandy to mixed<br />
sandy flats prevail. The substrate composition varied from f<strong>in</strong>e to medium gra<strong>in</strong> sand ma<strong>in</strong>ly, with some coarse and<br />
very f<strong>in</strong>e gra<strong>in</strong> mixed sandy sites. Microphytobenthos Chl a surface concentration varies as a function <strong>of</strong> sediment<br />
gra<strong>in</strong> size, estuary dynamics and seasonal blooms.<br />
- Site 3, Baie de Somme: <strong>the</strong> Baie de Somme is <strong>the</strong> second ranked estuar<strong>in</strong>e system, after <strong>the</strong> Se<strong>in</strong>e<br />
estuary, and <strong>the</strong> largest sandy-muddy (72 km 2 ) <strong>in</strong>tertidal area on <strong>the</strong> French coasts <strong>of</strong> <strong>the</strong> Eastern English Channel.<br />
This site is similar to <strong>the</strong> Baie d’Authie but <strong>the</strong> estuary be<strong>in</strong>g larger, sediment spatial variation occurs at a larger<br />
scale, mean<strong>in</strong>g that <strong>the</strong> measurements performed covered less diverse sediment types. The substrate gra<strong>in</strong> size<br />
varied ma<strong>in</strong>ly between 125 and 250 µm where most measurements were performed.<br />
- Site 4, Baie de Se<strong>in</strong>e: this site is very different from <strong>the</strong> previous ones as mudflats dom<strong>in</strong>ate where<br />
measurements were performed. Particle size < 63 µm corresponded to more than 50% <strong>of</strong> <strong>the</strong> sediment composition.<br />
396
Figure 1. Location <strong>of</strong> <strong>the</strong> test sites used to develop <strong>the</strong> general relationships between field spectral reflectance and<br />
Chl a concentration.<br />
2.2. Spectral measurements and field sampl<strong>in</strong>g<br />
Reflectance spectra cover<strong>in</strong>g <strong>the</strong> 350 – 2500 nm spectral range with a spectral resolution <strong>of</strong> 1 (Visible) to 3 nm<br />
(Infrared) were acquired for each station with a portable field spectrometer (ASD FieldSpec FR). Two optics were<br />
selected (8° and 18°) depend<strong>in</strong>g on surface characteristics, cover<strong>in</strong>g a field <strong>of</strong> view <strong>of</strong> roughly 154 and 784 cm 2 at 1<br />
m height. For each study sites, several stations were measured (between 10 and 22) to cover a wide range <strong>of</strong><br />
concentrations and sediment types. Ten spectra were acquired for each station and mean reflectance and standard<br />
deviation were calculated for each set. Fewer measurements were acquired <strong>in</strong> Wimereux where, as <strong>in</strong>dicated by<br />
spectra visualization, <strong>the</strong>re was very little evidence <strong>of</strong> <strong>microphytobenthos</strong> most <strong>of</strong> <strong>the</strong> time. The result<strong>in</strong>g mean<br />
reflectance is <strong>the</strong> spectral signature <strong>of</strong> <strong>the</strong> station. This spectral signature reflects surface composition (sediment<br />
m<strong>in</strong>eralogical composition, pigments related to <strong>microphytobenthos</strong> species, moisture content, etc.) through <strong>the</strong><br />
presence <strong>of</strong> specific, well located, absorption features and surface physical properties (sediment gra<strong>in</strong> size, etc.)<br />
through <strong>the</strong> general spectral shape related to wavelength dependent diffusion for example.<br />
Sampl<strong>in</strong>g and spectra acquisition occurred <strong>in</strong> spr<strong>in</strong>g 2001 and 2002 and summer 2001. An additional data set,<br />
acquired on May 30th 2002 <strong>in</strong> Baie de Somme, was used for algorithm validation. All data sets were acquired on<br />
days when low tide was close to solar noon <strong>in</strong> order to m<strong>in</strong>imize directional effects on reflectance and optimize<br />
surface exposure conditions.<br />
For each station, sediment samples were randomly collected <strong>in</strong> <strong>the</strong> <strong>in</strong>strument field <strong>of</strong> view (FOV) us<strong>in</strong>g a 1.55 cm<br />
diameter syr<strong>in</strong>ge or a 3.6 cm diameter corer, with 4 and 6 samples per measurement site for <strong>the</strong> 8° and 18° optics<br />
respectively when us<strong>in</strong>g syr<strong>in</strong>ges and 3 samples for corers and <strong>the</strong> 18° FOV. The cores were pushed <strong>in</strong>to <strong>the</strong><br />
sediment to a depth <strong>of</strong> 1 cm, where most <strong>of</strong> <strong>the</strong> cells are concentrated ([30], [31], [32], [33], [34]), carefully<br />
removed and <strong>the</strong>n stored <strong>in</strong> a cool box, brought back to <strong>the</strong> laboratory and stored <strong>in</strong> <strong>the</strong> dark at -20°C. In <strong>the</strong><br />
laboratory, sections <strong>of</strong> sediment were placed <strong>in</strong> acetone and pigments were extracted for 4 hours <strong>in</strong> <strong>the</strong> dark at 4°C<br />
([35]). After extraction, samples were centrifuged at 4000 rpm for 15 m<strong>in</strong>. Chlorophyll a concentrations (Chl a,<br />
mg) <strong>in</strong> <strong>the</strong> supernatant were determ<strong>in</strong>ed by spectrophotometry follow<strong>in</strong>g Lorenzen [36]:<br />
Chl a = V [(11.64 (O.D.663 – O.D.750) – 2.16(O.D.645 – O.D.750) + 0.1(O.D.630 – O.D.750)], (1)<br />
Where V: extraction volume and O.D.λ : optical density at wavelength λ (nm)<br />
397
Chl a concentrations <strong>in</strong> <strong>the</strong> supernatant have <strong>the</strong>n been converted <strong>in</strong> terms <strong>of</strong> Chl a per surface unit (Chl a, mg.m -2 )<br />
tak<strong>in</strong>g <strong>in</strong>to account <strong>the</strong> surface <strong>of</strong> <strong>the</strong> sampl<strong>in</strong>g units.<br />
2.3. Reflectance spectra analysis<br />
In <strong>the</strong> field reflectance spectra, Chl a absorption is located around 673 nm which is a different wavelength position<br />
than what is published for pure pigment (665 nm, [37], [38]). This is probably due to <strong>the</strong> fact that this wavelength<br />
position is for pure pigment <strong>in</strong> a solvent and not <strong>in</strong> a leav<strong>in</strong>g cell. Some tests we performed <strong>in</strong> <strong>the</strong> laboratory with<br />
monospecific cultures also show an absorption located around 673 nm. The importance <strong>of</strong> <strong>the</strong> absorption is directly<br />
related to pigment concentration and was estimated us<strong>in</strong>g three different and simple approaches (Figure 2).<br />
2.3.1. S<strong>in</strong>gle band ratio (Figure 2a)<br />
This approach is a method that has been classically used <strong>in</strong> spectroscopy and remote sens<strong>in</strong>g <strong>in</strong> general to measure<br />
amounts <strong>of</strong> atmospheric or surface components. It is based on differential absorption concept ([39], [40]) which<br />
consists <strong>of</strong> a simple ratio between reflectance at maximum absorption (Rb) and reflectance outside <strong>the</strong> absorption,<br />
referred to as <strong>the</strong> cont<strong>in</strong>uum (Rc). Here we used a ratio between reflectance at 673 nm (absorption) and reflectance<br />
at 720 nm (cont<strong>in</strong>uum).<br />
2.3.2. Normalized ratio (or scaled band depth) (Figure 2b, 2c)<br />
S<strong>in</strong>ce <strong>the</strong> objective is to develop a simple method that has to be <strong>in</strong>dependent from measurement conditions, one<br />
needs to perform some k<strong>in</strong>d <strong>of</strong> normalization <strong>in</strong> order to remove <strong>the</strong> <strong>in</strong>fluence <strong>of</strong> o<strong>the</strong>r parameters on <strong>the</strong> spectral<br />
signature and concentrate on <strong>the</strong> chlorophyll absorption itself. For example, it is well known that sediment gra<strong>in</strong><br />
size <strong>in</strong>fluences <strong>the</strong> diffus<strong>in</strong>g part <strong>of</strong> light, <strong>the</strong>refore chang<strong>in</strong>g <strong>the</strong> general shape <strong>of</strong> <strong>the</strong> spectrum through a<br />
modification <strong>of</strong> <strong>the</strong> spectral dependency <strong>of</strong> <strong>the</strong> diffusion ([41], [42]). Spectral shape is also <strong>in</strong>fluenced by sediment<br />
optical properties such as refract<strong>in</strong>g <strong>in</strong>dex related to sediment composition. Sediment moisture content will also<br />
modify <strong>the</strong> spectral signature (enhanced liquid water absorptions, level change <strong>of</strong> <strong>the</strong> general reflectance).<br />
Remov<strong>in</strong>g <strong>the</strong> cont<strong>in</strong>uum <strong>of</strong> <strong>the</strong> spectrum allows isolat<strong>in</strong>g <strong>the</strong> spectral feature from o<strong>the</strong>r effects. This approach was<br />
proposed by Clark and Roush [43] who determ<strong>in</strong>ed <strong>the</strong> depth <strong>of</strong> a spectral absorption feature and related it to frost<br />
gra<strong>in</strong> size and by Clark [44] and Clark et al. [45] and references <strong>the</strong>re<strong>in</strong> for applications to rocks and m<strong>in</strong>erals. The<br />
scaled band depth Db is calculated as <strong>the</strong> difference between <strong>the</strong> cont<strong>in</strong>uum reflectance Rc and <strong>the</strong> reflectance<br />
spectrum Rb <strong>in</strong> <strong>the</strong> deepest part <strong>of</strong> <strong>the</strong> absorption band, normalized by <strong>the</strong> cont<strong>in</strong>uum reflectance:<br />
Db = (Rc – Rb) / Rc. (2)<br />
While this band depth method is a valuable approach to <strong>the</strong> problem, its reliance on a s<strong>in</strong>gle band causes <strong>the</strong><br />
accuracy <strong>of</strong> <strong>the</strong> results to suffer <strong>in</strong> <strong>the</strong> presence <strong>of</strong> noise <strong>in</strong> <strong>the</strong> reflectance spectrum. Noise-<strong>in</strong>duced changes <strong>in</strong> <strong>the</strong><br />
spectrum affect <strong>the</strong> depth <strong>of</strong> <strong>the</strong> absorption feature and may give erroneous chlorophyll concentration estimates.<br />
2.3.3. Integral after cont<strong>in</strong>uum removal (scaled band area) (Figure 2d)<br />
To m<strong>in</strong>imize any effects <strong>of</strong> <strong>in</strong>strumental noise on chlorophyll retrievals, we also tested <strong>the</strong> use <strong>of</strong> <strong>the</strong> scaled area <strong>of</strong><br />
<strong>the</strong> absorption feature Ab ra<strong>the</strong>r than simply <strong>the</strong> scaled absorption band depth. This approach was used by Nol<strong>in</strong> and<br />
Dozier [46] to estimate snow gra<strong>in</strong> size from hyperspectral data. Scaled band area is a dimensionless quantity and is<br />
calculated by <strong>in</strong>tegrat<strong>in</strong>g <strong>the</strong> scaled absorption band depth over <strong>the</strong> wavelengths <strong>of</strong> <strong>the</strong> absorption feature:<br />
Ab = ∫λ (Rc – Rb) / Rc. (3)<br />
The basic assumption is that <strong>the</strong> noise is randomly distributed Gaussian noise (“white noise”). While <strong>the</strong> exact<br />
distribution <strong>of</strong> sensor noise is not known, a normal distribution is a reasonable assumption and has been used by<br />
o<strong>the</strong>rs <strong>in</strong> exam<strong>in</strong><strong>in</strong>g sensor noise characteristics ([47]). By <strong>in</strong>tegrat<strong>in</strong>g over <strong>the</strong> absorption feature, <strong>the</strong> fluctuations<br />
caused by noise should average out and produce an estimate closer to <strong>the</strong> true value. Integration was restricted to<br />
<strong>the</strong> [650 – 720 nm] wavelength range <strong>in</strong> order to exclude <strong>in</strong>fluence <strong>of</strong> o<strong>the</strong>r absorb<strong>in</strong>g pigments such as Chlorophyll<br />
c (absorption at 590 and 635 nm).<br />
398
For each method, regression laws where calculated between absorption estimated from spectra and mean Chl a<br />
concentration as determ<strong>in</strong>ed from <strong>the</strong> samples. Abnormal values that could be related to sampl<strong>in</strong>g strategy were<br />
elim<strong>in</strong>ated before calculat<strong>in</strong>g <strong>the</strong> mean Chl a concentration and <strong>the</strong> goodness <strong>of</strong> fit <strong>in</strong> each case.<br />
Figure 2. Estimation <strong>of</strong> chlorophyll a absorption: a – simple band ratio; b – pr<strong>in</strong>ciple <strong>of</strong> cont<strong>in</strong>uum removal. Dashed l<strong>in</strong>es<br />
represent mean surface reflectance (10 measurements) plus or m<strong>in</strong>us standard deviation; c – normalized ratio (after cont<strong>in</strong>uum<br />
removal); d – scaled band area after cont<strong>in</strong>uum removal.<br />
2.4. Airborne data<br />
Airborne data were acquired over <strong>the</strong> Baie d’Authie site. This site was selected because it is characteristic <strong>of</strong> <strong>the</strong><br />
estuaries <strong>of</strong> <strong>the</strong> French shore <strong>of</strong> <strong>the</strong> Eastern English Channel. Baie d’Authie is a macrotidal estuary show<strong>in</strong>g a great<br />
variety <strong>of</strong> sediment types and areas where <strong>the</strong> bi<strong>of</strong>ilm is present at low tide.<br />
399
2.4.1. CASI data<br />
CASI overflights occurred <strong>in</strong> September 2000, under poor wea<strong>the</strong>r conditions (overcast skies), prevent<strong>in</strong>g<br />
concurrent atmospheric measurements. Field reflectance spectra were none<strong>the</strong>less acquired over four reference<br />
sites. Empirical atmospheric corrections were performed us<strong>in</strong>g <strong>the</strong> empirical l<strong>in</strong>e technique and two <strong>of</strong> <strong>the</strong> reference<br />
sites. Three flight l<strong>in</strong>es were necessary to cover <strong>the</strong> entire Bay but we tested <strong>the</strong> algorithms on a subscene<br />
correspond<strong>in</strong>g to <strong>the</strong> area were <strong>the</strong> reference sites were located and <strong>the</strong> bi<strong>of</strong>ilm was present.<br />
The CASI <strong>in</strong>strument was flown <strong>in</strong> a “MERIS like” configuration with an additional band centered at 673.9 nm to<br />
map Chl a. Table 1 summarizes <strong>the</strong> ma<strong>in</strong> characteristics <strong>of</strong> <strong>the</strong> CASI data.<br />
Table 1. Characteristics <strong>of</strong> CASI data<br />
2.4.2. ROSIS data<br />
Band # Central wavelength (nm) Band width (nm)<br />
1 411.9 14.0<br />
2 443.3 14.2<br />
3 489.8 14.2<br />
4 510.3 14.2<br />
5 560.1 12.4<br />
6 619.7 14.4<br />
7 665.4 10.6<br />
8 673.9 8.8<br />
9 681.9 8.8<br />
10 704.5 12.6<br />
11 733.2 10.6<br />
12 760.8 6.8<br />
13 776.1 18.4<br />
14 865.2 24.0<br />
Spatial resolution: 2 m<br />
ROSIS data were acquired <strong>in</strong> <strong>the</strong> framework <strong>of</strong> <strong>the</strong> 2001 HySens Campaign, <strong>in</strong> August 2001. The wea<strong>the</strong>r<br />
conditions were good, allow<strong>in</strong>g for concurrent atmospheric and reflectance measurements. Aerosol optical depth<br />
derived from atmospheric measurements was used by DLR <strong>in</strong> <strong>the</strong>ir atmospheric correction procedure. Data were<br />
also georeferenced us<strong>in</strong>g aircraft and ground GPS <strong>in</strong>formation. Field reference sites were spatially located us<strong>in</strong>g<br />
GPS.<br />
ROSIS is an airborne imag<strong>in</strong>g spectrometer, mak<strong>in</strong>g use <strong>of</strong> a two-dimensional CCD array for imag<strong>in</strong>g<br />
simultaneously 115 spectral bands <strong>of</strong> 512 picture elements perpendicular to <strong>the</strong> flight direction. The spatial<br />
resolution was 2 m, <strong>the</strong> spectral range 416.5 – 872.5 nm with a spectral sampl<strong>in</strong>g <strong>in</strong>terval <strong>of</strong> 4 nm.<br />
The data appeared fairly noisy so additional preprocess<strong>in</strong>g was necessary. MNF transform was performed to<br />
remove most <strong>of</strong> <strong>the</strong> noise, <strong>the</strong> first 5 channels were removed and a reference site (dry sand) was used to ref<strong>in</strong>e<br />
atmospheric corrections.<br />
3. RESULTS<br />
3.1. Field reflectance spectra<br />
Results for <strong>the</strong> regression <strong>of</strong> simple ratio, normalized ratio and scaled band area versus field samples Chl a<br />
concentration are presented <strong>in</strong> Figure 3. The dependency <strong>of</strong> absorption depth (simple ratio) or normalized<br />
absorption depth (normalized ratio) to Chl a concentration can be approximated by an exponential function fit<br />
(Beer-Lambert-like law) (Figure 4a and b). The functional relationship between scaled band area and Chl a<br />
concentration was assumed a l<strong>in</strong>ear function (Figure 4c).<br />
400
Figure 3. Regression laws to estimate chlorophyll a<br />
concentration: a – simple band ratio; b – normalized<br />
ratio; c – scaled band area.<br />
These prelim<strong>in</strong>ary results are ra<strong>the</strong>r satisfactory as <strong>the</strong> R 2 > 0.8 for all three approaches which seem to give<br />
equivalent results. This would <strong>in</strong>dicate very little impact <strong>of</strong> measurement conditions on <strong>the</strong> estimation <strong>of</strong> <strong>the</strong><br />
absorption due to Chl a. This might po<strong>in</strong>t to <strong>the</strong> fact that <strong>the</strong>re is little variation <strong>in</strong> sediment gra<strong>in</strong> size with respect<br />
to <strong>the</strong> wavelength range considered or little change <strong>in</strong> water content or that our sampl<strong>in</strong>g was not fully<br />
representative <strong>of</strong> <strong>the</strong> observed conditions. A more detailed analysis <strong>of</strong> <strong>the</strong> <strong>in</strong>fluence <strong>of</strong> sampl<strong>in</strong>g strategy and<br />
sediment optical properties with respect to spectral signatures is under progress.<br />
Ano<strong>the</strong>r po<strong>in</strong>t is that <strong>the</strong> <strong>in</strong>strument we used is ra<strong>the</strong>r stable, with very little noise that is obviously already removed<br />
by averag<strong>in</strong>g 10 spectra at a time (very small standard deviation, see Figure 3b).<br />
401
Figure 4. Inversion <strong>of</strong> data from <strong>the</strong> Bay <strong>of</strong> Somme May<br />
2002 campaign: a – simple band ratio; b – normalized<br />
ratio; c – scaled band area.<br />
Each technique was <strong>the</strong>n validated us<strong>in</strong>g a newly acquired data set <strong>in</strong> Baie de Somme (May 30, 2002). Chl a<br />
concentration was estimated by <strong>in</strong>vert<strong>in</strong>g <strong>the</strong> result<strong>in</strong>g functions and compared to <strong>the</strong> concentrations measured from<br />
<strong>the</strong> samples. As shown on Figure 4, <strong>the</strong>re is a strong correlation (R 2 > 0.9) between estimated and measured Chl a<br />
concentration, no matter which algorithm is used, for <strong>the</strong> range <strong>of</strong> Chl a concentrations encountered that day (50 –<br />
200 mg.m -2 ). More measurements under different conditions are still needed to crosscheck <strong>the</strong>se results.<br />
3.2. Airborne data<br />
In a first step, field reflectance spectra were convolved to airborne sensor bandpasses. New regressions were<br />
derived for <strong>the</strong> three approaches. Then a ratio image was produced as well as, after cont<strong>in</strong>uum removal, normalized<br />
402
atio and scaled band area images. Chl a maps were derived by <strong>in</strong>vert<strong>in</strong>g <strong>the</strong> appropriate regressions. Validation<br />
was performed, when possible, by us<strong>in</strong>g reference sites to compare Chl a estimation from <strong>the</strong> images to field<br />
samples concentrations.<br />
3.2.1. CASI data<br />
As shown on Figure 5, <strong>the</strong> results are ra<strong>the</strong>r satisfactory but not as good as for field spectra. This can probably be<br />
related to <strong>the</strong> lower spectral resolution <strong>of</strong> CASI data. This assumption is consistent with a better fit for scaled band<br />
area which <strong>in</strong> fact is equivalent to degrad<strong>in</strong>g spectral resolution.<br />
403<br />
Figure 5. Regression laws to estimate chlorophyll a<br />
concentration after convolution to CASI bandpasses :<br />
a – simple band ratio; b – normalized ratio; c – scaled<br />
band area.
Result<strong>in</strong>g Chl a maps (Figure 6) appear qualitatively correct but <strong>the</strong> retrieved concentration range seems to show an<br />
overestimation <strong>of</strong> Chl a based on our knowledge <strong>of</strong> <strong>the</strong> area. Unfortunately, it was impossible to validate <strong>the</strong>se<br />
concentrations because field samples collected at <strong>the</strong> time <strong>of</strong> <strong>the</strong> overflight were not properly frozen, prevent<strong>in</strong>g an<br />
accurate estimate <strong>of</strong> Chl a concentration.<br />
Figure 6. Chlorophyll a surface concentration maps derived from CASI data: a – “false color composite” (red: 865 nm; green:<br />
673 nm; blue: 489 nm); b – simple band ratio; c – normalized ratio; d – scaled band area.<br />
3.2.2. ROSIS<br />
As shown <strong>in</strong> Figure 7, regressions show a better fit than for CASI data. This is probably due to <strong>the</strong> fact that ROSIS<br />
spectral resolution is closer to field spectra resolution. All three approaches appear aga<strong>in</strong> equally robust (R 2 = 0.86).<br />
When applied to ROSIS images (Figure 8), as for CASI maps, Chl a spatial distribution is qualitatively correct but<br />
<strong>the</strong> concentration range is narrower.<br />
Validation through comparison with field samples (Table 2) shows a strong underestimation <strong>of</strong> Chl a concentration.<br />
This discrepancy could be expla<strong>in</strong>ed <strong>in</strong> part by <strong>the</strong> noise <strong>in</strong> <strong>the</strong> data, assumption which seems to be confirmed by<br />
<strong>the</strong> fact that <strong>the</strong> Scaled Band Area gives better results than <strong>the</strong> o<strong>the</strong>r approaches. Instrument calibration can also be<br />
404
a potential factor. More certa<strong>in</strong>ly, it can also be attributed to <strong>the</strong> scal<strong>in</strong>g factor between field spectral measurements<br />
and pixel size. It is well known that <strong>the</strong> bi<strong>of</strong>ilm is not spatially homogeneous. Therefore, field sampl<strong>in</strong>g and field<br />
spectral measurements are not fully representative <strong>of</strong> <strong>the</strong> spatial distribution <strong>of</strong> <strong>the</strong> <strong>microphytobenthos</strong>. Moreover,<br />
we are estimat<strong>in</strong>g Chl a concentration from <strong>the</strong> field samples up to a 1 cm depth which also leads to an<br />
overestimation <strong>of</strong> Chl a with respect to what <strong>the</strong> field or <strong>the</strong> airborne <strong>in</strong>strument measures.<br />
405<br />
Figure 7. Regression laws to estimate chlorophyll a<br />
concentration after convolution to ROSIS bandpasses: a –<br />
simple band ratio; b – normalized ratio; c – scaled band<br />
area.
Figure 8. Chlorophyll a surface concentration maps derived from ROSIS data: a – “false color composite” (red: 752.5 nm;<br />
green: 672.5 nm; blue: 632.5 nm); b – simple band ratio; c – normalized ratio; d – scaled band area<br />
Table 2 . Comparison between Chl a concentrations (mg.m -2 ) derived from field samples and from ROSIS data –<br />
NR: Normalized ratio; SBA: Scaled Band Area.<br />
SITES SAMPLES RATIO NR SBA<br />
I 474.39 12.90 10.23 27.44<br />
J 199.05 13.99 13.4 23.53<br />
K 360.45 8.38 6.92 22.37<br />
L 91.76 10.56 6.78 19.98<br />
M 517.88 47.36 48.37 69.04<br />
N 204.72 11.20 10.17 25.23<br />
O 98.86 24.55 20.86 39.80<br />
P 5.12 42.43 35.70 53.60<br />
Q 108.14 52.62 49.90 71.07<br />
R 149.04 11.34 13.42 31.25<br />
S 17.93 6.09 7.37 15.53<br />
T 3.39 2.19 1.12 4.72<br />
U 12.28 4.73 7.23 14.38<br />
406
4. CONCLUSIONS<br />
Prelim<strong>in</strong>ary results regard<strong>in</strong>g <strong>the</strong> simple approaches developed here <strong>in</strong>dicate that all three methods are ra<strong>the</strong>r robust<br />
(R 2 > 0.8) when applied to field spectra. There seems to be very little difference between <strong>the</strong> three, <strong>in</strong>dicat<strong>in</strong>g ei<strong>the</strong>r<br />
that <strong>the</strong>re is very little <strong>in</strong>fluence <strong>of</strong> measurement conditions <strong>in</strong> <strong>the</strong> spectral range considered or that <strong>the</strong> field<br />
sampl<strong>in</strong>g technique averages out this impact. In addition, <strong>the</strong> <strong>in</strong>strument used <strong>in</strong> <strong>the</strong> field is fairly stable which<br />
expla<strong>in</strong>s why <strong>in</strong>tegrat<strong>in</strong>g over <strong>the</strong> absorption feature does not dramatically improve <strong>the</strong> estimation.<br />
When applied to airborne CASI and ROSIS data, all three techniques appear also equally robust when look<strong>in</strong>g at<br />
<strong>the</strong> new regression laws derived from field spectra convolved to <strong>in</strong>strument bandpasses. Better results were<br />
obta<strong>in</strong>ed for ROSIS data which was to be expected as ROSIS has a higher spectral resolution than CASI and<br />
contiguous bands.<br />
Inversion <strong>of</strong> <strong>the</strong> result<strong>in</strong>g functions on <strong>the</strong> images produced Chl a concentration maps that appeared qualitatively<br />
correct. Unfortunately, CASI maps could not be validated through comparison with field samples but appeared<br />
overestimated based on our knowledge <strong>of</strong> <strong>the</strong> area. On <strong>the</strong> o<strong>the</strong>r hand, ROSIS Chl a maps could be validated and<br />
show an underestimation <strong>of</strong> Chl a concentration when compared to reference sites.<br />
These discrepancies could ma<strong>in</strong>ly be expla<strong>in</strong>ed by <strong>the</strong> scal<strong>in</strong>g factor between field spectral measurements and<br />
airborne <strong>in</strong>strument pixel size. It is well known that <strong>the</strong> spatial distribution <strong>of</strong> <strong>the</strong> bi<strong>of</strong>ilm is generally fairly patchy;<br />
<strong>the</strong>refore field sampl<strong>in</strong>g and spectral measurements might not be representative <strong>of</strong> a 2 x 2 m pixel. In addition, both<br />
data sets present different characteristics for <strong>the</strong> same spatial resolution. CASI data have a coarser spectral<br />
resolution than field spectra and were acquired under poor wea<strong>the</strong>r conditions, prevent<strong>in</strong>g for an accurate<br />
atmospheric correction. ROSIS data have a higher spectral resolution and contiguous bands but are fairly noisy<br />
which partly expla<strong>in</strong>s why <strong>the</strong> scaled band area approach gives better results as it “smoo<strong>the</strong>s” <strong>the</strong> noise. In both<br />
cases, <strong>in</strong>strument calibration might also be an important factor.<br />
These prelim<strong>in</strong>ary results clearly show that fur<strong>the</strong>r studies are required to better understand <strong>the</strong> <strong>in</strong>fluence <strong>of</strong> <strong>the</strong><br />
sampl<strong>in</strong>g strategy (particularly estimat<strong>in</strong>g Chl a concentration with<strong>in</strong> <strong>the</strong> first centimeter <strong>of</strong> sediment) and sediment<br />
optical properties on <strong>the</strong> spectral signature at various scales. Field measurements have to be extended to o<strong>the</strong>r sites<br />
with different sediment characteristics. Sampl<strong>in</strong>g strategies have to be compared and validated <strong>in</strong> order to<br />
extrapolate to airborne <strong>in</strong>strument pixel size. We are also <strong>in</strong>vestigat<strong>in</strong>g <strong>the</strong> possibility <strong>of</strong> us<strong>in</strong>g this approach to<br />
identify and quantify o<strong>the</strong>r pigments, lead<strong>in</strong>g to an estimation <strong>of</strong> biodiversity as pigments can be used as<br />
f<strong>in</strong>gerpr<strong>in</strong>ts for different groups <strong>of</strong> microalgae.<br />
ACKNOWLEDGEMENTS<br />
This work was supported by <strong>the</strong> French “Programme National d’Environnement Côtier”. CASI data were acquired<br />
thanks to special fund<strong>in</strong>g from Université des Sciences et Techniques de Lille. ROSIS data were acquired as part <strong>of</strong><br />
<strong>the</strong> 2001 HySens campaign. The author would particularly like to thank <strong>the</strong> DLR HySens Team for provid<strong>in</strong>g<br />
atmospherically and geometrically corrected data and for <strong>the</strong>ir great flexibility <strong>in</strong> acquir<strong>in</strong>g data under such strong<br />
constra<strong>in</strong>ts. Samuel Degézelle and Nicolas Spilmont helped with <strong>the</strong> Chlorophyll a extraction and Aurélie Rob<strong>in</strong><br />
characterized <strong>the</strong> Bay d’Authie sediment samples.<br />
REFERENCES<br />
[1] BLANCHARD, G.F., GUARINI, J.M., RICHARD, P., GROS, P., AND MORNET, F., 1996: Quantify<strong>in</strong>g <strong>the</strong> short-term<br />
temperature effect <strong>of</strong> light-saturated photosyn<strong>the</strong>sis <strong>of</strong> <strong>in</strong>tertidal <strong>microphytobenthos</strong>. Mar. Ecol. Prog. Ser.<br />
134:309-313.<br />
[2] BLANCHARD, G.F., GUARINI, J.M., GROS, P., AND RICHARD, P., 1997: Seasonal effect on <strong>the</strong> relationship<br />
between <strong>the</strong> photosyn<strong>the</strong>tic capacity <strong>of</strong> <strong>in</strong>tertidal <strong>microphytobenthos</strong> and temperature. J. Phycol. 33:723-728.<br />
[3] JONGE DE, V.N., 1980: Fluctuations <strong>in</strong> <strong>the</strong> organic carbon to chlorophyll a ratio for estuar<strong>in</strong>e benthic diatom<br />
populations. Mar Ecol Prog Ser 2:345-353.<br />
[4] MCINTYRE, H.L., GEIDER, R.J., AND MILLER, D.C., 1996: Microphytobenthos: <strong>the</strong> ecological role <strong>of</strong> <strong>the</strong> ‘secret<br />
garden’ <strong>of</strong> unvegetated, shallow-water mar<strong>in</strong>e habitats. Distribution, abundance and primary production. Estuaries<br />
19:186-201.<br />
407
[5] CARIOU-LE GALL, V., AND BLANCHARD, G.F., 1995: Monthly HPLC measurements <strong>of</strong> pigment concentration<br />
from an <strong>in</strong>tertidal muddy sediment <strong>of</strong> Marennes-Oléron Bay, France. Mar Ecol Prog Ser 121:171-179.<br />
[6] PINCKNEY, J.L., AND ZINGMARK, R.G., 1991: Effects <strong>of</strong> tidal stage and sun angles on <strong>in</strong>tertidal benthic<br />
microalgal productivity. Mar Ecol Prog. Ser. 76:81-89.<br />
[7] PINCKNEY, J.L., AND ZINGMARK, R.G., 1993: Model<strong>in</strong>g <strong>the</strong> annual production <strong>of</strong> <strong>in</strong>tertidal benthic microalgae<br />
<strong>in</strong> estuar<strong>in</strong>e ecosystems. J Phycol 29:396-407.<br />
[8] BLANCHARD, G.F., 1994 : Caractéristiques photosynthétiques du <strong>microphytobenthos</strong> d’une vasière <strong>in</strong>tertidale.<br />
C.R.A.Sc. Paris (Life Sciences) 317:633-673.<br />
[9] BLANCHARD, G.F., AND CARIOU–LE GALL, V., 1994: Photosyn<strong>the</strong>tic characteristics <strong>of</strong> <strong>microphytobenthos</strong> <strong>in</strong><br />
Marennes- Oléron bay, France : prelim<strong>in</strong>ary results. J. Exp. Mar. Biol. Ecol. 182:1-14.<br />
[10] ADMIRAAL, W., 1984: The ecology <strong>of</strong> estuar<strong>in</strong>e sediment-<strong>in</strong>habit<strong>in</strong>g diatoms. Progress <strong>in</strong> Phycological<br />
Research 3:269-322.<br />
[11] COLIJN, F., AND DE JONGE, V.N., 1984: Primary production <strong>of</strong> <strong>microphytobenthos</strong> <strong>in</strong> <strong>the</strong> Ems-Dollard Estuary.<br />
Mar Ecol Prog Ser. 4:9-21.<br />
[12] MILLER, D.C., GEIDER, R.J., AND MCINTYRE, H.L., 1996: Microphytobenthos: <strong>the</strong> ecological role <strong>of</strong> <strong>the</strong><br />
“secret garden“ <strong>of</strong> unvegetated, shallow-water mar<strong>in</strong>e habitats: II Role <strong>in</strong> sediment stability and shallow water food<br />
webs. Estuaries 19:202-212.<br />
[13] GUARINI, J.M., BLANCHARD, G.F., GROS, P., GOULEAU, D., AND BACHER, C., 2000: Dynamic model <strong>of</strong> <strong>the</strong><br />
short term variability <strong>of</strong> microphytobenthic biomass on temperate <strong>in</strong>tertidal mudflats. Mar Ecol Prog Ser 195:291-<br />
303.<br />
[14] BLANCHARD, G.F., GUARIN,I J.M., BACHER, C., AND HUET, V., 1998 : Contrôle de la dynamique à court terme<br />
du <strong>microphytobenthos</strong> <strong>in</strong>tertidal par le cycle exondation-submersion. C.R.A.Sc. Paris (Life Sciences) 321:501-508.<br />
[15] GUARINI, J.M., BLANCHARD, G., BACHER, C., GROS, P., RIERA, P., RICHARD, P., GOULEAU, D., GALOIS, R.,<br />
PROU, J., AND SAURIAU, P.G., 1998: Dynamics <strong>of</strong> spatial patterns <strong>of</strong> microphytobenthic biomass : <strong>in</strong>ferences from a<br />
geostatistical analysis <strong>of</strong> two comprehensive surveys <strong>in</strong> Marennes-Oléron Bay (France). Mar Ecol Prog Ser<br />
166:131-141.<br />
[16] RIETHMÜLLER, R., HAKVOORT, J.H.M., HEINEKE, M., HEYMANN, K., KÜHL, H., AND WITTE, G., 1998:<br />
Relat<strong>in</strong>g erosion shear stress to tidal flat surface color. In: Black K.S., Paterson D.M., Cramp A. (Eds): Sedimentary<br />
Processes <strong>in</strong> <strong>the</strong> Intertidal Zone, 139:283-293.<br />
[17 RIETHMÜLLER, R., HEINEKE, M., KÜHL, H., AND KEUKER-RÜDIGER, R., 2000: Chlorophyll a concentration as<br />
an <strong>in</strong>dex <strong>of</strong> sediment stabilization by <strong>microphytobenthos</strong>? Cont<strong>in</strong>ental Shelf Research 20:1351-1372.<br />
[18] UNDERWOOD, G.J.C., AND PATERSON, D.M., 1993: Seasonal changes <strong>in</strong> diatom biomass, sediment stability<br />
and biogenic stabilization <strong>in</strong> <strong>the</strong> Severn Estuary. J. Mar. Biol. Ass. UK 73:871-887.<br />
[19] MADSEN, K.N., NILSON, P., AND SUNDBÄCK, K., 1993: The <strong>in</strong>fluence <strong>of</strong> benthic micro algae on <strong>the</strong> stability <strong>of</strong><br />
a subtidal sediment. J. Exp. Mar. Biol. Ecol. 170:159-177.<br />
[20] HAKVOORT, J.H.M., HEINEKE, M., HEYMANN, K., KÜHL, H., RIETHMÜLLER, R., AND WITTE, G., 1998: A<br />
basis for mapp<strong>in</strong>g <strong>the</strong> erodability <strong>of</strong> tidal flats by optical remote sens<strong>in</strong>g. Mar. Freshwater Res. 49:867-873.<br />
[21] DADE, W.B., DAVIS, J.D., NICHOLS, P.D., NOWELL, A.R.M., THISTLE, D., TREXLER, M.B., AND WHITE, D.C.,<br />
1990: Effects <strong>of</strong> bacterial exopolymer adhesion on <strong>the</strong> entra<strong>in</strong>ment <strong>of</strong> sand. Geomicrobiology Journal 8:1-16.<br />
[22] PATERSON, D.M., YALLOP, M.L., AND GEORGE, C., 1994: Spatial variability <strong>in</strong> <strong>the</strong> sediment erodability on <strong>the</strong><br />
Island <strong>of</strong> Texel. In: W.Krummbe<strong>in</strong>, D.M. Paterson and L.J. Stal (Eds): Biostabilization <strong>of</strong> sediments, pp.107-120.<br />
[23] AMOS, C.L., BRYLINSKY, T.F., SUTHERLAND, T.F., O’BRIEN, D., LEE, S., AND CRAMP, A. 1998: The stability<br />
<strong>of</strong> a mudflat <strong>in</strong> <strong>the</strong> Humber estuary, South Yorkshire, UK. In: K.S., Paterson D.M., Cramp A. (Eds): Sedimentary<br />
Processes <strong>in</strong> <strong>the</strong> Intertidal Zone, Black, 139:25-43.<br />
[24] SEURONT, L., AND SPILMONT, N., 2002: Self-organized criticality <strong>in</strong> <strong>in</strong>tertidal <strong>microphytobenthos</strong> patch<br />
patterns. Physica A<br />
[25] FOLVING, S., 1984: The Danish Wadden Sea: Thematic mapp<strong>in</strong>g by means <strong>of</strong> remote sens<strong>in</strong>g. Folia<br />
Geographica Danica 15:1-56.<br />
[26] DOERFFER, R., MURPHY, D., 1989: Factor analysis and classification <strong>of</strong> remotely sensed data for monitor<strong>in</strong>g<br />
tidal flats. Helgolander Meeresunters 43:275-293.<br />
[27] ZACHARIAS, M., OLAF, N., AND BORSTAD, G., 1992: An assessment and classification <strong>of</strong> a multispectral<br />
bandset for <strong>the</strong> remote sens<strong>in</strong>g <strong>of</strong> <strong>in</strong>tertidal seaweeds. Can. J. Remote Sens. 18:263-274.<br />
[28] BAJJOUK, T., GUILLAUMONT, B., AND POPULUS, J., 1996: Application <strong>of</strong> airborne imag<strong>in</strong>g spectrometry<br />
system data to <strong>in</strong>tertidal seaweed classification and mapp<strong>in</strong>g. Hydrobiologia 326/327:463-471.<br />
[29] BLACKBURN, G.A., 1998: Quantify<strong>in</strong>g Chlorophylls and Carotenoids at Leaf and Canopy Scales: An<br />
Evaluation <strong>of</strong> Some Hyperspectral Approaches. Remote Sens. Environ. 66:273-235.<br />
[30] CADÉE, G.C., AND HEGEMAN, J., 1974: Primary production <strong>of</strong> <strong>the</strong> benthic micr<strong>of</strong>lora liv<strong>in</strong>g on tidal flats <strong>in</strong> <strong>the</strong><br />
Dutch Wadden Sea. Neth. J. Sea Res. 8:260-291.<br />
408
[31] BAILLIE, P.W., 1987: Diatom size distribution and community stratification <strong>in</strong> estuar<strong>in</strong>e <strong>in</strong>tertidal sediments.<br />
Estuar. Coast. Shelf Sci. 25:193-209.<br />
[32] ADMIRAAL, W., ARKEL, M.A., VAN, BARETTA, J.W., COLIJN, F., EBENHÖH, W., JONGE, V.N., DE KOP, A.,<br />
RUARDIJ, P., AND , H.G.J., 1988: The construction <strong>of</strong> <strong>the</strong> benthic submodel. In: Baretta, J. & Ruardij, P. (Eds.):<br />
Tidal flat estuaries. Simulation and analysis <strong>of</strong> <strong>the</strong> Ems estuary. Ecological studies 71, Spr<strong>in</strong>ger-Verlag, Heidelberg,<br />
p. 105-152.<br />
[33] DELGADO, M., 1989: Abundance and distribution <strong>of</strong> <strong>microphytobenthos</strong> <strong>in</strong> <strong>the</strong> bays <strong>of</strong> Ebro Delta (Spa<strong>in</strong>).<br />
Estuar. Coast. Shelf Sci. 29:183-194.<br />
[34] JONGE DE, V.N., AND COLIJN, F., 1994: Dynamics <strong>of</strong> <strong>microphytobenthos</strong> biomass <strong>in</strong> <strong>the</strong> Ems estuary. Mar<br />
Ecol Prog Ser 104:185-196.<br />
[35] BRUNET, C., 1994 : Analyse des pigments photosynthétiques par HPLC : communautés phytoplanctoniques et<br />
productivité primaire en Manche orientale. Ph. D. Thesis. Univ. Paris VI 367 p.<br />
[36] LORENZEN, C.J., 1967: Determ<strong>in</strong>ation <strong>of</strong> chlorophyll and phaeopigments : spectrometric equations. Limnol<br />
Oceanogr 12:343-346.<br />
[37] JEFFREY, S.W., AND HUMPHREY, G.F., 1975: New spectrophotometric equations for determ<strong>in</strong><strong>in</strong>g chlorophylls<br />
a, b, c1 and c2 <strong>in</strong> higher plants algae and natural phytoplankton. Biochem. Physiol. Pflanz 167:191-194.<br />
[38] JEFFREY, S.W., MATOURA, R.F.C., AND WRIGHT, S.W., 1977: Phytoplankton pigments <strong>in</strong> Oceanography.<br />
SCOR, UNESCO Publish<strong>in</strong>g, 661 p.<br />
[39] FOWLE, F.E., 1912: The spectroscopic determ<strong>in</strong>ation <strong>of</strong> aqueous vapor. Astrophys. J. 35:149-153.<br />
[40] FOWLE, F.E., 1913: The determ<strong>in</strong>ation <strong>of</strong> aqueous water vapor above Mount Wilson. Astrophys. J. 37:359-<br />
372.<br />
[41] HUNT, G.R., AND SALISBURY, J.W., 1970: Visible and near-<strong>in</strong>frared spectra <strong>of</strong> m<strong>in</strong>erals and rocks: I Silicate<br />
m<strong>in</strong>erals. Modern Geology 1:283-300.<br />
[42] LEU, D.J., 1977: Visible and near-<strong>in</strong>frared reflectance <strong>of</strong> beach sands : A study on <strong>the</strong> spectral<br />
reflectance/gra<strong>in</strong> size relationship. Remote Sens. Environ. 6:169-182.<br />
[43] CLARK, R.N., AND ROUSH, T., 1984: Reflectance spectroscopy: quantitative analysis techniques for remote<br />
sens<strong>in</strong>g applications. J.Geoph.Res. 89:6329-6340.<br />
[44] CLARK, R.N., 1999: Chapter 1: Spectroscopy <strong>of</strong> rocks and m<strong>in</strong>erals and pr<strong>in</strong>ciples <strong>of</strong> spectroscopy. In: A.N.<br />
Rencz (Ed:) Manual <strong>of</strong> Remote Sens<strong>in</strong>g, John Wiley and Sons, New York, p. 3-58.<br />
[45] CLARK, R.N., SWAIZE, G.A., LIVO, K.E., KOKALY, R.F., SUTLEY, S.J., DALTON, J.B., MCDOUGAL, R.R., AND<br />
GENT, C.A., 2002: Imag<strong>in</strong>g spectroscopy: Earth and planetary remote sens<strong>in</strong>g with <strong>the</strong> USGS Tetracorder and<br />
Expert Systems. J. Geoph. Res., <strong>in</strong> Press.<br />
[46] NOLIN, A.W., AND DOZIER, J., 2000: A hyperspectral method for remotely sens<strong>in</strong>g <strong>the</strong> gra<strong>in</strong> size <strong>of</strong> snow.<br />
Remote Sens Environ 74:207-216.<br />
[47] SABOL, D.E., JR., ADAMS, J.B., AND SMITH, M.O., 1992: Quantitative subpixel spectral detection <strong>of</strong> targets <strong>in</strong><br />
multispectral images. J. Geoph. Res. 97:2659-2672.<br />
409