Half-Time SPECT Myocardial Perfusion Imaging with Attenuation ...
Half-Time SPECT Myocardial Perfusion Imaging with Attenuation ...
Half-Time SPECT Myocardial Perfusion Imaging with Attenuation ...

Create successful ePaper yourself
Turn your PDF publications into a flip-book with our unique Google optimized e-Paper software.
<strong>Half</strong>-<strong>Time</strong> <strong>SPECT</strong> <strong>Myocardial</strong> <strong>Perfusion</strong><br />
<strong>Imaging</strong> <strong>with</strong> <strong>Attenuation</strong> Correction<br />
Iftikhar Ali 1 , Terrence D. Ruddy 1,2 , Abdulaziz Almgrahi 1 , Frank G. Anstett 3 , and R. Glenn Wells 1,2<br />
1 Division of Cardiology, University of Ottawa Heart Institute, Ottawa, Ontario, Canada; 2 Division of Nuclear Medicine, The Ottawa<br />
Hospitals, University of Ottawa, Ottawa, Ontario, Canada; and 3 GE Healthcare, Waukesha, Wisconsin<br />
Reducing acquisition time may improve patient throughput, increase<br />
camera efficiency, and reduce costs; reducing acquisition<br />
time also increases image noise. Newly available software controls<br />
the effects of noise by maximum a posteriori reconstruction while<br />
maintaining resolution <strong>with</strong> resolution-recovery methods. This<br />
study compares half-time (HT) gated myocardial <strong>SPECT</strong> images<br />
processed <strong>with</strong> ordered-subset expectation maximization <strong>with</strong><br />
resolution recovery (OSEM-RR) (<strong>with</strong> and <strong>with</strong>out CT-based attenuation<br />
correction [AC]) <strong>with</strong> full-time (FT) images obtained <strong>with</strong> a<br />
standard clinical protocol and reconstructed <strong>with</strong> filtered backprojection<br />
(FBP) and OSEM (<strong>with</strong> and <strong>with</strong>out AC). Methods: Atotalof<br />
212 patients (mean age, 57 y; age range, 27–86 y) underwent 1-d<br />
rest/stress 99mTc-tetrofosmin gated <strong>SPECT</strong>. FT (12.5 min, both<br />
rest and stress) and HT (rest, 7.5 min; stress, 6.0 min) images<br />
were acquired <strong>with</strong> low-dose CT for AC in 112 patients. HT acquisitions<br />
were processed <strong>with</strong> OSEM-RR (<strong>with</strong> and <strong>with</strong>out AC) using<br />
software, and FT acquisitions were processed <strong>with</strong> FBP and<br />
OSEM (<strong>with</strong> and <strong>with</strong>out AC). In another 100 patients, test–retest<br />
repeatability was assessed using 2 sets of FT images (FBP reconstruction)<br />
that were acquired one immediately after the other. Radiologists<br />
unaware of the acquisition and reconstruction protocols<br />
visually assessed all reconstructed images for summed stress,<br />
summed rest, and summed difference scores and regional wall<br />
motion using a 17-segment model. Automated analysis on gated<br />
<strong>SPECT</strong> was used to determine left ventricular volumes, ejection<br />
fraction, and dilation (end-diastolic volume, end-systolic volume,<br />
left ventricular ejection fraction, and transient ischemic dilation<br />
[TID]). A clinical diagnosis was also determined. Results: All measurements<br />
resulted in significant correlations (P , 0.01) between<br />
the HT and FT images. The only significant difference in mean<br />
values was for OSEM-RR plus AC; this method led to an increase<br />
in TID by 4% over FT imaging. The concordance in the clinical diagnosis<br />
for HT versus FT was 106 to 112 (k 5 0.88) for no AC and<br />
102 to 106 (k 5 0.91) for AC, similar to the repeatability of FT versus<br />
FT (98/100, k 5 0.95). Conclusion: HT images processed <strong>with</strong> the<br />
new algorithm provided a clinical diagnosis in concordance <strong>with</strong><br />
that from FT images in 95% (no AC) to 96% (AC) of cases. This concordance<br />
is similar to the test–retest repeatability of FT imaging.<br />
Key Words: <strong>SPECT</strong>; myocardial perfusion imaging; resolution<br />
recovery; attenuation correction<br />
J Nucl Med 2009; 50:554–562<br />
DOI: 10.2967/jnumed.108.058362<br />
Received Sep. 22, 2008; revision accepted Dec. 8, 2008.<br />
For correspondence or reprints contact: R. Glenn Wells, Division of<br />
Cardiology Cardiac <strong>Imaging</strong>, First Floor, University of Ottawa Heart<br />
Institute, 40 Ruskin St., Ottawa, ON, K1Y 4W7, Canada.<br />
E-mail: gwells@ottawaheart.ca<br />
COPYRIGHT ª 2009 by the Society of Nuclear Medicine, Inc.<br />
554 THE JOURNAL OF NUCLEAR MEDICINE • Vol. 50 • No. 4 • April 2009<br />
Coronary heart disease is a leading cause of death in the<br />
United States and the most prevalent form of cardiovascular<br />
disease, affecting 16 million people. Gated <strong>SPECT</strong> cardiac<br />
perfusion imaging plays a fundamental role in prediction,<br />
diagnosis, prognosis, and the selection of appropriate treatment<br />
for patients <strong>with</strong> suspected or known ischemic heart<br />
disease (1,2).<br />
In <strong>SPECT</strong>, there is a trade-off between image-acquisition<br />
time and noise levels. A shorter acquisition time would<br />
reduce the time during which the patient is required to lie still<br />
and reduce the likelihood of patient motion artifacts. A<br />
shorter scan time might also improve camera use and reduce<br />
the cost of the test. There was some success in reducing scan<br />
times <strong>with</strong> the introduction of multihead g-cameras in the<br />
1990s, which increased the detector surface area and allowed<br />
simultaneous acquisition of multiple-projection views. Other<br />
groups have suggested that diagnostic accuracy could be<br />
maintained <strong>with</strong> noisier studies (3) or studies <strong>with</strong> reduced<br />
spatial resolution (4), but these approaches had limited<br />
acceptance. More recently, there have been exciting advances<br />
in image processing and reconstruction algorithms<br />
that improve the image quality of count-poor studies.<br />
The new algorithms incorporate noise regularization and<br />
resolution recovery (RR). To compensate for the increased<br />
noise in the shorter-duration acquisitions, some form of<br />
statistically based noise suppression, based on prior knowledge<br />
of the type of activity distribution, is applied to the data<br />
during image reconstruction. This form of noise suppression,<br />
like low-pass filtering, tends to reduce the spatial resolution<br />
of the image. To compensate for these effects, the algorithms<br />
also include distance-dependent RR. The resolution of gcamera<br />
images decreases as the source increases its distance<br />
from the collimator surface. By modeling the point-spread<br />
function (PSF) and other sources of image blurring inside the<br />
image-creation process, it is possible to compensate for these<br />
effects and improve the image quality (5). The PSF can be<br />
integrated into reconstruction as part of an iterative algorithm.<br />
The PSF has 4 components: septal penetration, septal<br />
scatter, intrinsic detector response, and, most important,<br />
geometric response function (GRF) (6). The GRF component<br />
is defined as the normalized 2-dimensional Fourier transform<br />
of the point-source image formed in a plane behind the
collimator by photons that are accepted geometrically<br />
through the collimator holes. It is often assumed that GRF<br />
is spatially invariant in planes parallel to the face of the<br />
collimator and that the intrinsic response is spatially invariant<br />
in the detection plane. However, a more accurate description<br />
of specific collimators can be obtained by Monte Carlo<br />
simulation or experimental measurements of collimator<br />
geometry (7,8).<br />
Our objective in this study was to compare gated myocardial<br />
perfusion images obtained using half-time (HT)<br />
acquisition and processed using one of the new RR reconstruction<br />
algorithms <strong>with</strong> those obtained using a standard<br />
clinical protocol and reconstructed using filtered backprojection<br />
(FBP) or ordered-subset expectation maximization<br />
(OSEM) in a patient population of intermediate-to-high<br />
pretest probability of coronary artery diseases (CAD).<br />
MATERIALS AND METHODS<br />
HT Reconstruction Algorithm<br />
The Evolution for Cardiac software package (GE Healthcare) is<br />
a new reconstruction algorithm that has recently become available<br />
for clinical cardiac imaging. This algorithm incorporates RR and<br />
maximum a posteriori (MAP) noise regularization, permitting<br />
cardiac <strong>SPECT</strong> images to be acquired in approximately half of the<br />
time (HT acquisition) needed for reconstruction <strong>with</strong> the standard<br />
OSEM algorithm (9,10). The PSF is stored as a look-up table, and<br />
the radial distance of the detector is recorded as part of the<br />
projection data. Equipment-related information for a variety of<br />
different collimators is stored in an additional look-up table that is<br />
part of the reconstruction package; acquisition parameters are<br />
TABLE 1. Study Population Demographics<br />
retrieved from all projection data. The RR process can produce<br />
noise hot spots that detrimentally affect image quality. The MAP<br />
algorithm is used to suppress the formation of hot spots. It is a<br />
1-step late implementation using a Green’s prior <strong>with</strong> parameters<br />
that have been tuned for each clinical protocol and for gated and<br />
attenuation-corrected images (11). <strong>Attenuation</strong> correction (AC)<br />
<strong>with</strong> Evolution for Cardiac also includes scatter correction based<br />
on a dual-energy window. A median root prior is used in the last<br />
iteration of the reconstruction to preserve edge sharpness (12).<br />
This scheme has been found to give an image of equal or superior<br />
quality on limited clinical studies and on physical phantom data<br />
(13–20).<br />
Patient Population<br />
We prospectively evaluated 212 patients from July 2007<br />
through March 2008 at the Nuclear Cardiology Diagnostic <strong>Imaging</strong><br />
laboratory, University of Ottawa Heart Institute, Ottawa,<br />
Canada. Patients were selected from those who were scheduled<br />
to have routine rest/stress myocardial perfusion <strong>SPECT</strong> for<br />
suspected or known CAD. A total of 112 patients underwent<br />
full-time (FT) and HT acquisitions. Another 100 patients underwent<br />
2 FT acquisitions to evaluate test–retest reproducibility. The<br />
patients had a mean age of 57 y (age range, 27–86 y), and their<br />
clinical characteristics are provided in Table 1. The test–retest<br />
group had more males and a higher pretest likelihood of CAD.<br />
However, most cases in both groups were of moderate risk<br />
(10%290%). The study was approved by the University of<br />
Ottawa’s Human Ethics Review Board, and patients gave written<br />
consent before enrollment.<br />
Radiopharmaceutical Injection and Image Acquisition<br />
99m Tc-tetrofosmin (Myoview; GE Healthcare) was used in all<br />
the studies. The radiopharmaceutical doses were administered,<br />
Patient characteristic FT–HT (n 5 112) FT–FT (n 5 100) P<br />
Male 67 (60%) 74 (74%) 0.03<br />
Age (y) NS<br />
Mean 58 56<br />
Range 32–86 27–80<br />
Body mass index (mean 6 SD) 28.3 6 4.4 28.3 6 4.0 NS<br />
Hypertension 74 (66%) 58 (58%) NS<br />
Dyslipidemia 62 (55%) 56 (56%) NS<br />
Smoking (current and previous) 59 (53%) 54 (54%) NS<br />
Diabetes 18 (16%) 14 (14%) NS<br />
Family history of premature CAD 46 (41%) 41 (41%) NS<br />
Previous event<br />
<strong>Myocardial</strong> infarction 23 (21%) 20 (20%) NS<br />
Percutaneous coronary intervention 19 (17%) 25 (25%) NS<br />
Coronary artery bypass graft 10 (9%) 8 (8%) NS<br />
Pretest likelihood of CAD (combined<br />
Diamond/Forrester)<br />
Low risk (,10%) 42 (38%) 20 (20%) 0.004<br />
Moderate risk (10%290%) 63 (56%) 73 (73%) 0.009<br />
High risk (.90%) 7 (6%) 7 (7%) NS<br />
Stress test<br />
Exercise 53 (47%) 56 (56%) NS<br />
Dipyridamole 59 (53%) 44 (44%) NS<br />
Data in parentheses are percentages unless otherwise noted.<br />
NS 5 not significant.<br />
HALF-TIME <strong>SPECT</strong> MPI WITH AC • Ali et al. 555
and images were acquired according to the guidelines of the<br />
American Society of Nuclear Cardiology (ASNC) (21). A 1-d rest<br />
and stress imaging protocol was used in all patients. For rest<br />
images, the injected dose of 99m Tc-tetrofosmin was, on average,<br />
344 MBq (9.3 mCi), <strong>with</strong> a range of 286–445 MBq (7.7–12 mCi).<br />
For the stress images, the average injected dose was 1,053 MBq<br />
(28.5 mCi), <strong>with</strong> a range of 930–1,281 MBq (25.1–34.6 mCi). All<br />
rest images were acquired at 45 min after tetrofosmin injection,<br />
and all stress images were acquired between 30 and 60 min after<br />
tetrofosmin injection.<br />
Exercise and Dipyridamole Stressing Protocols<br />
Patients were advised, at the discretion of their referring physician,<br />
to stop taking nitrates, calcium antagonists, and b-blockers at<br />
the time of the myocardial perfusion study. They were also asked<br />
to refrain from ingesting caffeine-containing foods and beverages,<br />
drugs, and dipyridamole for 24 h before their study.<br />
Unless contraindicated or at the request of the referring physician,<br />
all patients underwent a symptom-limited Bruce protocol<br />
treadmill exercise test. Targeted heart rate was 85% of maximum<br />
age-adjusted predicted heart rate (22). At peak stress, the radiotracer<br />
was injected intravenously, and exercise was continued for<br />
an additional 60 s. The patients who were unable to achieve the<br />
targeted heart rate or exercise were stressed pharmacologically.<br />
Dipyridamole (0.142 mg/kg/min) was infused intravenously for<br />
5 min, and 99m Tc-tetrofosmin was injected at 2 min after infusion<br />
completion (7 min into the study). Aminophyline (100–200 mg)<br />
was given intravenously 2 min after injection of the radiotracer.<br />
Data Acquisition and Reconstruction<br />
All studies were completed <strong>with</strong> a 90°-angled dual-head integrated<br />
<strong>SPECT</strong>/CT camera (Infinia Hawkeye 4; GE Healthcare)<br />
using standard (FT) and short (HT) protocols. All images were<br />
acquired <strong>with</strong> a low-energy high-resolution collimator using a<br />
15% energy window centered on the 140-keV photopeak of 99m Tc,<br />
based on ASNC guidelines for cardiac 99m Tc studies (21). In the<br />
standard protocol, <strong>SPECT</strong> data were acquired for 25 s per<br />
projection (30 projections/head; total of 180° of data) for both<br />
the rest and the stress studies. In the short protocol, data were<br />
acquired for 15 s per projection for the rest study and 10 s per<br />
projection for the stress study. Both rest and stress studies were<br />
gated at 8 frames per cardiac cycle. In one half of the 112 patients,<br />
the HT scan was acquired first, followed by the FT scan; in the<br />
other half of the patients, the scan order was reversed. A single<br />
low-dose CT scan (helical, 140 keV, 1 mA <strong>with</strong> 1.9 pitch) was<br />
acquired at the end of both rest and stress acquisitions for AC.<br />
Vendor-supplied quality-assurance software was used to ensure<br />
the CT scan was registered <strong>with</strong> both HT and FT <strong>SPECT</strong> images.<br />
Projections and reconstructed matrix size for all scans were 64 ·<br />
64 pixels, <strong>with</strong> a pixel size of 6.8 · 6.8 mm. Reconstruction was<br />
done on a Xeleris 2.0 (GE Healthcare) workstation running on<br />
xw6200 hardware (Hewlett Packard). For the 100 patients undergoing<br />
the test–retest portion of the study, 2 standard <strong>SPECT</strong> scans<br />
were obtained, one immediately after the other and <strong>with</strong> the same<br />
acquisition parameters as described above.<br />
All FT scans were reconstructed <strong>with</strong> both FBP and OSEM.<br />
Both gated and ungated images were used for evaluation. The FBP<br />
images were created <strong>with</strong> a 10th-order Butterworth filter, using<br />
different cutoff frequencies for the ungated (0.4 cycles/cm) and<br />
gated (0.35 cycles/cm) data. The OSEM iterative reconstruction (2<br />
iterations, 10 subsets) was done both <strong>with</strong> CT-based AC (IRAC)<br />
556 THE JOURNAL OF NUCLEAR MEDICINE • Vol. 50 • No. 4 • April 2009<br />
and <strong>with</strong>out CT-based AC (IRNC). The OSEM images were also<br />
filtered after reconstruction <strong>with</strong> a 10th-order Butterworth filter:<br />
ungated (0.4 cycles/cm) and gated (0.35 cycles/cm).<br />
All HT scans were reconstructed <strong>with</strong> Evolution for Cardiac<br />
using manufacturer-recommended RR and noise-reduction parameters<br />
(12 iterations, 10 subsets) both <strong>with</strong> CT-based AC (IRACRR)<br />
and <strong>with</strong>out CT-based AC (IRNCRR). The factory-recommended<br />
Butterworth filters were applied to the ungated rest (0.4 cycles/<br />
cm), ungated stress (0.52 cycles/cm), and gated rest and stress (0.4<br />
cycles/cm) data.<br />
The resulting images were randomized and analyzed in a<br />
masked manner by 2 experienced American Board of Nuclear<br />
Medicine–certified nuclear medicine physicians using 4DM-<br />
<strong>SPECT</strong> (Invia Medical <strong>Imaging</strong> Solutions) on a Hermes Gold<br />
workstation (Hermes Medical Solutions). Differences between the<br />
readers were resolved <strong>with</strong> consensus.<br />
Data Collection and Statistical Analysis<br />
The reconstructed images were assessed subjectively for image<br />
quality as poor, good, or excellent. The summed stress score (SSS)<br />
(graded from 0 [normal tracer uptake] to 4 [absent tracer]),<br />
summed rest score (SRS), and regional wall motion (graded as<br />
normal, hypokinetic, akinetic, or dyskinetic) were visually assessed<br />
using a 17-segment model. Automated analysis on gated<br />
<strong>SPECT</strong> was used to determine the end-diastolic volume (EDV),<br />
end-systolic volume (ESV), left ventricular ejection fraction<br />
(LVEF), and transient ischemic dilation (TID). Finally, a clinical<br />
diagnosis was determined from perfusion, TID, and wall motion<br />
as normal, probably normal, equivocal, probably abnormal, or<br />
abnormal. Fixed defects <strong>with</strong> normal wall motion were considered<br />
to be normal perfusion <strong>with</strong> an attenuation artifact. For this study,<br />
an SSS greater than or equal to 2 and a TID greater than 1.2 (23)<br />
were considered abnormal. A more typical cutoff value for normal<br />
SSS is less than 4 (24), but we have chosen a stricter criterion of<br />
less than 2 for this study to emphasize any minor differences in<br />
apparent perfusion.<br />
The concordance of clinical diagnosis for the FT and HT<br />
images was evaluated using the intraclass correlation coefficient<br />
(ICC-r) and k-coefficient. The SSS, SRS, summed difference<br />
scores (SDS), and quantitative parameters (LVEF, LVEDV, and<br />
LVESV) were compared using linear regression analysis, the ICC-r,<br />
and Bland–Altman analysis. Mean values were compared using a<br />
Bonferroni-corrected 2-tailed paired t test, <strong>with</strong> a value of P less<br />
than 0.05 considered significant.<br />
RESULTS<br />
FBP Analysis<br />
There were no differences in subjective image quality<br />
among the FT images reconstructed <strong>with</strong> FBP and IRNC.<br />
Image quality was excellent in 111 of 112 images reconstructed<br />
<strong>with</strong> both FBP and IRNC, and the last image was<br />
adequate on IRNC. No significant difference in SSS, SRS,<br />
SDS, and wall motion were observed between FBP and IRNC<br />
(Supplemental Table 1; supplemental materials are available<br />
online only at http://jnm.snmjournals.org). Quantitative<br />
analysis of left ventricular volumes (LVEDV, LVESV, and<br />
LVEF) also showed no significant difference between FBP<br />
and IRNC. With respect to clinical diagnosis, there were 2 of<br />
112 (1.8%) discordant cases. Both cases were normal on FBP.
The patient in the first discordant case had mild ischemia in<br />
the right coronary artery territory on IRNC, and subsequent<br />
82 Rb-PET findings were normal. The patient in the second<br />
discordant case also had mild ischemia in the left circumflex<br />
artery territory on IRNC but was unavailable for follow-up.<br />
This level of disagreement is similar to the discordance seen<br />
in the test–retest repeatability.<br />
For the 100-patient test–retest portion of the study, all<br />
measures (SSS, SRS, SDS, wall motion, LVEDV, LVESV,<br />
LVEF, and TID) showed significant correlation and no<br />
significant differences in the mean values (Supplemental<br />
Table 1). Bland–Altman analysis of the LV volumes and<br />
ejection fraction showed no changes in the distribution of<br />
differences as a function of mean values. The clinical<br />
diagnosis of the 100 patients from the test–retest portion<br />
of this study showed excellent reproducibility: ICCr 5 0.98<br />
(P 5 0.001). The patient in the first discordant case had<br />
mild-to-moderate ischemia in the inferior wall in the initial<br />
acquisition. However, in the subsequent acquisition there<br />
was scatter from the gut that led to a diagnosis of subdiaphragmatic<br />
attenuation, <strong>with</strong> normal wall motion. The<br />
patient in the second discordant case had normal perfusion<br />
in both acquisitions but had a change from normal-tomoderate<br />
global hypokinesis.<br />
Visual Analysis<br />
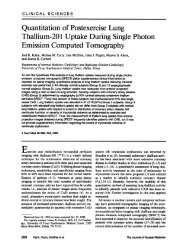
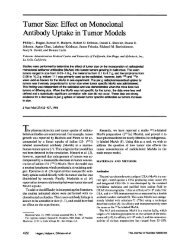
No differences in subjective image quality between FT<br />
and HT images were observed (Fig. 1). Image quality was<br />
excellent in 110 of 112 for HT images reconstructed <strong>with</strong><br />
IRNCRR, 112 of 112 for HT images reconstructed <strong>with</strong><br />
IRACRR, and 111 of 112 for FT images reconstructed<br />
<strong>with</strong> both IRNC and IRAC. Highly significant correlations<br />
for SSS and SRS were observed between IRNCRR and<br />
IRNC (ICCr 5 0.94 for both SSS and SRS) and between<br />
IRAC and IRACRR (ICCr 5 0.96 for both) (Supplemental<br />
Table 2). The correlation for the SDS measure was reduced<br />
FIGURE 1. Stress/rest 99m Tc-tetrofosmin <strong>SPECT</strong> study. FT acquisition reconstructed <strong>with</strong> OSEM <strong>with</strong>out AC (IRNC) (A), HT<br />
acquisition reconstructed <strong>with</strong> OSEM and RR <strong>with</strong>out AC (IRNCRR) (B), FT acquisition reconstructed <strong>with</strong> OSEM <strong>with</strong> CT-based<br />
AC (IRAC) (C), and HT acquisition reconstructed <strong>with</strong> OSEM and RR <strong>with</strong> CT-based AC (IRACRR) (D). No difference in image<br />
quality or clinical diagnosis was observed in 95% of cases between IRNC and IRNCRR and 96% of cases between IRAC and<br />
IRACRR. S 5 stress; R 5 rest.<br />
HALF-TIME <strong>SPECT</strong> MPI WITH AC • Ali et al. 557
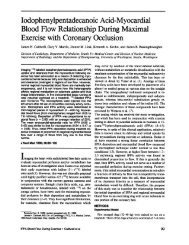
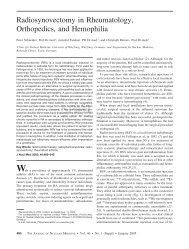
FIGURE 2. Histogram analysis comparing<br />
HT and FT myocardial perfusion<br />
<strong>SPECT</strong> reconstructed <strong>with</strong> (IRAC vs.<br />
IRACRR) and <strong>with</strong>out (IRNC vs.<br />
IRNCRR) CT-based AC. Results for<br />
test–retest repeatability (FBP1 vs.<br />
FBP2) are also shown. SSS (A) and<br />
SDS (B) are presented separately.<br />
(<strong>with</strong>out AC, ICCr 5 0.55; <strong>with</strong> AC, ICCr 5 0.39). The<br />
reduced correlation was caused by the large number of<br />
patients <strong>with</strong> an SDS of 0 and the small range of SDS<br />
differences in our patient sample (range, 25 to 4). The<br />
concordance in SDS remained good; the SDS differences<br />
between FT and HT images (Fig. 2) were 0 in 95 of 112<br />
patients <strong>with</strong>out AC and 96 of 106 patients <strong>with</strong> AC and<br />
were greater than or equal to 4 in only 3 of 112 patients<br />
<strong>with</strong>out AC and 2 of 106 patients <strong>with</strong> AC.<br />
Quantitative Analysis of LV Volume and Function<br />
Quantitative analyses were performed on both FT and<br />
HT gated stress acquisitions. We compared HT and FT<br />
images <strong>with</strong>out (IRNCRR and IRNC) and <strong>with</strong> CT-based<br />
AC (IRACRR and IRAC) and found no significant differences<br />
in LVEDV, LVESV, and LVEF (Supplemental Table<br />
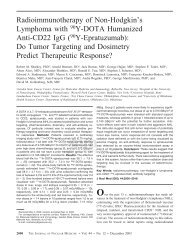
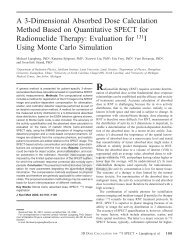
2). LVEF determined from HT <strong>SPECT</strong> correlated well <strong>with</strong><br />
that of FT <strong>with</strong>out AC (IRNC vs. IRNCRR, ICCr 5 0.90)<br />
and <strong>with</strong> CT-based AC (IRACRR vs. IRAC, ICCr 5 0.88)<br />
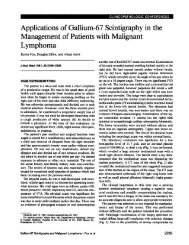
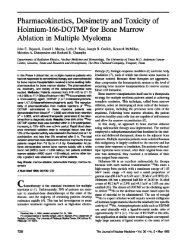
(Fig. 3). The Bland–Altman plot analysis of IRNCRR <strong>with</strong><br />
IRNC and IRACRR <strong>with</strong> IRAC showed no significant<br />
differences in LVEF (Fig. 4). Similar results were seen<br />
for LVEDV and LVESV (Supplemental Table 2). The only<br />
difference observed was a small but significant (P 5 0.04)<br />
increase in the average TID for IRACRR (TID 5 0.96),<br />
compared <strong>with</strong> IRAC (TID 5 0.92).<br />
Clinical Diagnosis<br />
Clinical diagnoses obtained from IRNCRR were 95%<br />
(106/112) concordant <strong>with</strong> IRNC, and the k-coefficient was<br />
0.88. Clinical diagnoses obtained from IRACRR were 96%<br />
(102/106) concordant <strong>with</strong> IRAC, and the k-coefficient was<br />
0.91. The differences in SSS in the 6 discordant cases were<br />
mild; they were <strong>with</strong>in the range of 2 to 4. Frequently an<br />
SSS greater than or equal to 4 is required for a scan to be<br />
considered abnormal. In this study, we use an SSS cutoff of<br />
2. We also used a TID value greater than or equal to 1.2 as<br />
abnormal and considered fixed defects <strong>with</strong> normal wall<br />
motion to be attenuation artifacts (for a scan <strong>with</strong>out AC).<br />
The discordant clinical diagnoses (Table 2) are detailed in<br />
Table 3. CT-based AC resolved all of the differences in<br />
perfusion (cases 2–6) (Fig. 5). In case 1, the patient was<br />
claustrophobic and a CT scan could not be acquired. An<br />
558 THE JOURNAL OF NUCLEAR MEDICINE • Vol. 50 • No. 4 • April 2009<br />
82 Rb-PET follow-up study showed normal perfusion. Patients<br />
in cases 5 and 6 were also followed up <strong>with</strong> an<br />
electrocardiogram-gated 82 Rb-PET scans, and both PET<br />
studies had normal perfusion and normal TID. The patient<br />
in case 7 underwent a subsequent angiogram during the<br />
course of clinical evaluation, which showed no significant<br />
stenosis supplying the inferolateral wall, the area of ischemia<br />
noted in both no-AC studies and the IRAC study. The<br />
patient in case 8 relocated and was unavailable for further<br />
follow-up.<br />
DISCUSSION<br />
This study compared images obtained <strong>with</strong> HT acquisition<br />
and processed <strong>with</strong> the Evolution for Cardiac reconstruction<br />
algorithm <strong>with</strong> conventional image acquisition<br />
and processing protocols using FBP and OSEM. Our results<br />
indicate that the new reconstruction algorithm <strong>with</strong> RR can<br />
reduce acquisition time and provide similar image quality<br />
and diagnostic accuracy for myocardial perfusion in terms<br />
of perfusion, wall motion, and volumes for the evaluation<br />
FIGURE 3. Linear regression analysis of LVEF comparing<br />
HT and FT myocardial perfusion <strong>SPECT</strong> <strong>with</strong> (IRAC vs.<br />
IRACRR) and <strong>with</strong>out (IRNC vs. IRNCRR) CT-based AC.
of CAD. Moreover, these results are similar both <strong>with</strong> and<br />
<strong>with</strong>out the application of CT-based AC. Mild discrepancies<br />
in FT–HT are similar to test–retest repeatability of<br />
FT imaging.<br />
The depth-dependant RR approach has been adapted by<br />
various vendors in their new reconstruction algorithms <strong>with</strong><br />
various methods of modeling components: Evolution for<br />
Cardiac (10,13,15,20), Wide-Beam Reconstruction (WBR)<br />
(Ultra<strong>SPECT</strong>) (10,13,15,16), Astonish (Philips Medical System)<br />
(17,18), and 3D Flash (Siemens Medical Solutions) (19).<br />
Our study supports and expands on the results and conclusions<br />
of other work done previously <strong>with</strong> the Evolution for Cardiac<br />
package. DePuey et al. compared 2 new reconstruction algorithms<br />
<strong>with</strong> FBP. These authors demonstrated that for cardiac<br />
perfusion <strong>SPECT</strong>, HT Evolution for Cardiac (OSEM-RR) and<br />
WBR offered stress and rest image quality and diagnostic<br />
accuracy equivalent to FT FBP (13,15). DePuey et al. also<br />
demonstrated that these new methods (OSEM-RR and WBR)<br />
offered gated myocardial perfusion <strong>SPECT</strong> functional image<br />
quality <strong>with</strong> HTacquisitions equivalent to or possibly superior<br />
to that achieved <strong>with</strong> FT acquisition processed <strong>with</strong> FBP (10).<br />
In the studies by these authors, images were acquired on a<br />
Ventri 90°-angled dual-head scintillation camera (GE Healthcare),<br />
and we have demonstrated similar results here on an<br />
Infinia Hawkeye (GE Healthcare). DePuey et al. compared HT<br />
OSEM-RR and WBR <strong>with</strong> FT FBP using metrics of image<br />
quality, LV volumes, LVEF, and wall motion. In our study, we<br />
extended these results to clinical diagnosis, SSS, SRS, SDS,<br />
and CT-based AC. We had also compared 2 sets of FT<br />
acquisitions reconstructed <strong>with</strong> a clinically used FBP algorithm<br />
for test–retest reproducibility.<br />
This study suggests that CT-based AC may improve<br />
concordance between HT and FT images. In those cases for<br />
which there was discordance between the IRNC and<br />
IRNCRR results, the inclusion of CT-based AC removed<br />
the differences in perfusion. A possible explanation is that<br />
the addition of AC in the algorithm improves the accuracy of<br />
the camera over RR alone and leads to greater consistency in<br />
the data and a more accurate reconstructed image. Narayanan<br />
et al. demonstrated that iterative reconstruction provides<br />
better performance than does FBP reconstruction for the<br />
overall detection of CAD and the localization of perfusion<br />
defects in the 3 arterial territories (25). They noted a steady<br />
improvement in defect detection as attenuation, scatter, and<br />
FIGURE 4. Bland–Altman analysis of<br />
LVEF comparing HT and FT myocardial<br />
perfusion <strong>SPECT</strong> <strong>with</strong>out (IRNC vs.<br />
IRNCRR) (A) and <strong>with</strong> (IRAC vs.<br />
IRACRR) (B) CT-based AC. LVEF (IRNC<br />
vs. IRNCRR): mean difference, 0.1; 1.96<br />
SDs, 9.4. LVEF (IRAC vs. IRACRR):<br />
mean difference, 0.4; 1.96 SDs, 11.0.<br />
resolution losses were progressively compensated for in the<br />
reconstruction, suggesting that improved modeling of physical<br />
degradations can improve the quality of cardiac perfusion<br />
images. Thus, use of both resolution and attenuation<br />
compensation might be expected to yield a better result than<br />
would resolution compensation alone, although <strong>with</strong> the<br />
small number of cases in this study the differences were not<br />
shown to be significant.<br />
A 100-patient test–retest study was performed on the same<br />
camera <strong>with</strong> the same methodology to determine the reproducibility<br />
for specific parameters (SSS, SRS, SDS, LVEDV,<br />
LVESV, LVEF, and wall motion) and clinical diagnosis<br />
through masked reading of separate studies performed one<br />
immediately after the other. This study yielded a discrepancy<br />
rate for the clinical diagnosis of 2%. Although this rate is<br />
slightly lower than the discrepancy rate seen between the FT<br />
and HT images, the small test–retest variability would<br />
account for some of the discrepancy seen, making the true<br />
difference between the HT and FT images even less.<br />
In this study, we observed a small but significant (P 5 0.04)<br />
increase of 4% in the average TID for IRACRR, compared<br />
<strong>with</strong> IRAC. TID may be caused by an apparent thinning of the<br />
myocardial wall due to reduced uptake in the endocardium<br />
(26). TID is measured on the basis of the change in LV volume<br />
between rest and stress images. Resolution recovery has the<br />
potential to alter the spatial resolution of images and thereby<br />
influence the accuracy of edge detection and measured vol-<br />
TABLE 2. Clinical Diagnosis Without and With<br />
CT-Based AC<br />
HT<br />
FT<br />
No AC<br />
Normal Abnormal<br />
Normal 69 5<br />
Abnormal<br />
AC<br />
1 37<br />
Normal 71 2<br />
Abnormal 2 31<br />
Normal studies had normal perfusion, TID, and wall motion.<br />
Abnormal studies had SSS greater than or equal to 2 or TID<br />
greater than 1.2 or wall motion abnormalities greater than or<br />
equal to 2.<br />
HALF-TIME <strong>SPECT</strong> MPI WITH AC • Ali et al. 559
TABLE 3. Discordance in Clinical Diagnosis Between HT and FT Images<br />
No AC (IRNC vs. IRNCRR) CT-based AC (IRAC vs. IRACRR)<br />
Case no. <strong>Perfusion</strong> (SDS) TID WM <strong>Perfusion</strong> TID WM<br />
1 X (2, 0) *<br />
2 X (0, 3)<br />
3 X (0, 4)<br />
4 X (0, 2)<br />
5 X (0, 2) X (1.03, 1.25)<br />
6 X (0, 1) X (1.03, 1.3) X (1.04, 1.27)<br />
7 X<br />
8 X<br />
*CT was unavailable (because of patient’s claustrophobia).<br />
Differences in perfusion were mild in all cases (SDS of #4). In cases of discordant TID results, values of TID for 2 image sets are noted<br />
in parentheses.<br />
umes. In light of this and the observed increase in TID, it may<br />
be necessary to redefine the reference range for TID using the<br />
HT reconstruction algorithm.<br />
A disadvantage of the new reconstruction algorithm is<br />
that there is a significant increase in image reconstruction<br />
time <strong>with</strong> RR (11 min for each IRNCRR and IRACRR),<br />
FIGURE 5. Stress/rest 99m Tc-tetrofosmin <strong>SPECT</strong> study. FT acquisition reconstructed <strong>with</strong> OSEM <strong>with</strong>out AC (IRNC) shows<br />
breast attenuation in anterior wall (A), HT acquisition reconstructed <strong>with</strong> OSEM and RR <strong>with</strong>out AC (IRNCRR) shows reversible<br />
defect in anterior wall (B), FT acquisition reconstructed <strong>with</strong> OSEM <strong>with</strong> AC (IRAC) shows normal perfusion (C), and HT<br />
acquisition reconstructed <strong>with</strong> OSEM and RR <strong>with</strong> CT-based AC (IRACRR) also shows normal perfusion (D). S 5 stress<br />
tetrofosmin study; R 5 rest tetrofosmin study.<br />
560 THE JOURNAL OF NUCLEAR MEDICINE • Vol. 50 • No. 4 • April 2009
compared <strong>with</strong> standard clinical reconstruction (1–2 min<br />
for FBP and 2–3 min for IRNC). The increase in processing<br />
time might have the potential to affect workflow, offsetting<br />
the reduced acquisition time. However, for the purposes of<br />
image-quality assurance, the projection data are immediately<br />
available. In addition, the total reconstruction time is<br />
still considerably less than camera time required for each<br />
patient when the time for patient positioning and camera<br />
set-up are included. Thus, reconstructed images are completed<br />
before the next patient’s projection data become<br />
available and no backlog in processing should occur.<br />
Study Limitations<br />
The RR and noise reduction described in this study for HT<br />
acquisition are modeled specifically for each camera and<br />
collimator; thus, the result of 1 camera cannot be completely<br />
generalized to other types of cameras and collimators. The<br />
result of the study described in this report is validated only for<br />
the Infinia Hawkeye 4 <strong>SPECT</strong>/CT dual-head camera. Therefore,<br />
care should be taken in extending these results to other<br />
systems, and further validation may be necessary.<br />
The filters used for the FT images were different from<br />
those recommended for the HT images. Incorporating RR<br />
and MAP priors into the reconstruction alters the noise and<br />
resolution properties of the resultant images, making it<br />
unlikely that the optimal filters for the new algorithm will<br />
coincide <strong>with</strong> those currently used as optimal for our clinical<br />
(FT) images. In this study, we chose to use the manufacturerrecommended<br />
postfiltering parameters. These are expected<br />
to be a reasonable choice for filtering but may not represent<br />
the optimal choice for our patient population. The differences<br />
in filtering combined <strong>with</strong> RR may alter the definition of the<br />
myocardial wall and could, therefore, alter the automatic<br />
computation of the valve plane or ventricular volume, for<br />
example. The filters could possibly be adjusted to improve<br />
further the already high concordance between the FTand HT<br />
images. In addition, some studies have shown that imaging<br />
early after stress (,30 min) can result in transient wall<br />
motion abnormalities (27). This effect may have contributed<br />
to differences seen in some cases because of the serial nature<br />
of our imaging protocol.<br />
Differences were noted between some FT and HT images<br />
for which follow-up was not available. This was true for<br />
images both <strong>with</strong> and <strong>with</strong>out AC, although there was a trend<br />
toward a smaller number of discrepancies <strong>with</strong> the inclusion<br />
of AC. Because of the lack of an independent standard, it<br />
remains uncertain which of the approaches yields a more<br />
accurate result in this small number of cases. Additionally,<br />
the total number of discrepancies between the HT and FT<br />
images is small, making it difficult to draw any meaningful<br />
conclusion as to whether the images from one approach are<br />
superior to those of the other. Further investigation <strong>with</strong> an<br />
independent standard such as PET would be necessary to<br />
settle this question, and the results are unlikely to be clinically<br />
meaningful as the number of studies in question is 4% or<br />
fewer.<br />
Clinical Relevance<br />
The advantages of reducing acquisition time by 50% are<br />
considerable and include improvement in image quality<br />
through reduced patient motion, improvement in patient<br />
experience <strong>with</strong> less discomfort and anxiety, improvement<br />
in patient throughput, and, finally, possible increase in<br />
camera efficiency. Alternatively, the radiopharmaceutical<br />
dose could be halved while maintaining a FT acquisition, to<br />
decrease radiation exposure to patients and staff.<br />
CONCLUSION<br />
A new OSEM-based reconstruction algorithm incorporating<br />
depth-dependant RR and MAP noise suppression has<br />
been evaluated in 112 patients both <strong>with</strong> and <strong>with</strong>out CTbased<br />
AC. HT images processed <strong>with</strong> the new algorithm<br />
provided a clinical diagnosis in concordance <strong>with</strong> the diagnosis<br />
from FT images processed <strong>with</strong> standard algorithms in<br />
95% (no AC) to 96% (<strong>with</strong> AC) of cases. The concordance of<br />
the FT–HT imaging is similar to test–retest repeatability of<br />
FT imaging.<br />
ACKNOWLEDGMENTS<br />
We gratefully acknowledge the technical assistance of<br />
Patti M.E. Irvine, Rene Adeny, Elaine Cooper, Brian F.<br />
Marvin, Marlie A. Poirier, and Lyanne N. Fuller. We thank<br />
GE Healthcare for providing the Evolution for Cardiac<br />
software package. This study was funded in part by the<br />
Ontario Research Fund (ORF)-Research Excellence Program.<br />
One author is supported by a research fellowship<br />
funded by the University of Ottawa, Ottawa, Canada.<br />
REFERENCES<br />
1. DePuey EG, Rozanski A. Using gated technetium-99m-sestamibi <strong>SPECT</strong> to<br />
characterize fixed myocardial defects as infarct or artifact. J Nucl Med. 1995;<br />
36:952–955.<br />
2. Thomas GS, Miyamoto MI, Morello AP, et al. Technetium 99m sestamibi<br />
myocardial perfusion imaging predicts clinical outcome in the community<br />
outpatient setting: the Nuclear Utility in the Community (NUC) Study. J Am Coll<br />
Cardiol. 2004;43:213–223.<br />
3. Taillefer R, Primeau M, Lambert R, Levelle Y. Technetium-99m-sestamibi<br />
myocardial perfusion imaging: comparison between a short (8 minutes) and<br />
standard (21 minutes) data acquisition time in diagnosis of coronary artery<br />
disease [abstract]. J Nucl Med. 1992;33(suppl):855P.<br />
4. DePuey EG, Nichols KJ, Slowikowski JS, et al. Fast stress and rest acquisitions<br />
for technetium-99m sestamibi separate day <strong>SPECT</strong>. J Nucl Med. 1995;36:569–<br />
574.<br />
5. Gifford HC, King MA, Wells RG, Hawkins WG, Narayanan MV, Pretorius PH.<br />
LROC analysis of detector response compensation in <strong>SPECT</strong>. IEEE Trans Med<br />
<strong>Imaging</strong>. 2000;19:463–473.<br />
6. Frey EC, Tsui BMW. Collimator-detector response compensation in <strong>SPECT</strong>.<br />
In: Zaidi H, ed. Quantitative Analysis in Nuclear Medicine <strong>Imaging</strong>. Berlin,<br />
Germany: Springer; 2005.<br />
7. Metz CE, Atkins FB, Beck RN. The geometric transfer function component for<br />
scintillation camera collimators <strong>with</strong> straight parallel holes. Phys Med Biol.<br />
1980;25:1059–1070.<br />
8. Tsui BMW, Gullberg GT. The geometric transfer-function for cone and fan beam<br />
collimators. Phys Med Biol. 1990;35:81–93.<br />
9. Tsui BMW, Frey EC, Zhao X, Lalush DS, Johnston RE, McCartney WH. The<br />
importance and implementation of accurate 3D compensation methods for<br />
quantitative <strong>SPECT</strong>. Phys Med Biol. 1994;39:509–530.<br />
HALF-TIME <strong>SPECT</strong> MPI WITH AC • Ali et al. 561
10. DePuey G, Gadiraju R, Clark J, Thompson L, Anstett F, Schwartz SC. Ordered<br />
subset expectation maximization and wide beam reconstruction ‘‘half-time’’<br />
gated myocardial perfusion <strong>SPECT</strong> functional imaging: a comparison to ‘‘fulltime’’<br />
filtered backprojection. J Nucl Cardiol. 2008;15:547–563.<br />
11. Green PJ. Bayesian reconstruction from emission tomography data using a<br />
modified EM algorithm. IEEE Trans Med <strong>Imaging</strong>. 1990;9:84–93.<br />
12. Alenius S, Ruotsalainen U. Bayesian image reconstruction for emission<br />
tomography based on median root prior. Eur J Nucl Med. 1997;24:258–265.<br />
13. DePuey G, Gadiraju R, Anstett F, et al. <strong>Half</strong>-time gated myocardial perfusion<br />
<strong>SPECT</strong> processed <strong>with</strong> both OSEM <strong>with</strong> resolution recovery and wide beam<br />
reconstruction: clinical performance compared to full-time filtered backprojection.<br />
In: Proceedings of the ICNC meeting; May 2, 2007; Prague, Czech<br />
Republic. Abstract 472.<br />
14. Belhocine T, Gambhir S, Brenner R, Peretz A, Driedger A, Urbain JL. <strong>Half</strong>-time<br />
resolution recovery package for <strong>SPECT</strong>-CT MPI: a pilot study [abstract]. J Nucl<br />
Med. 2007;48(suppl):234P.<br />
15. DePuey G, Gadiraju R, Anstett F. OSEM and WBR half-time gated myocardial<br />
perfusion <strong>SPECT</strong>: a comparison to filtered backprojection [abstract]. J Nucl<br />
Med. 2007;48(suppl):237P.<br />
16. Borges-Neto S, Pagnanelli RA, Shaw LK, et al. Clinical results of a novel wide<br />
beam reconstruction method for shortening scan time of Tc-99m cardiac <strong>SPECT</strong><br />
perfusion studies. J Nucl Cardiol. 2007;14:555–565.<br />
17. Heller GV, McGhie AI, Philips RD, et al. Multi-center evaluation of a new<br />
reconstruction method <strong>with</strong> depth dependent collimator resolution and scatter<br />
compensation applied to half-time small field of view <strong>SPECT</strong> MPI. Paper<br />
presented at: ASNC 2007 meeting; September 6–9; San Diego, California.<br />
18. Bateman TM, Heller GV, McGhie AI. Application of simultaneous Gd-153 line source<br />
attenuation correction to half-time <strong>SPECT</strong> acquisitions: multi-center clinical evaluation.<br />
Paper presented at: ASNC 2007 meeting; September 6–9; San Diego, California.<br />
562 THE JOURNAL OF NUCLEAR MEDICINE • Vol. 50 • No. 4 • April 2009<br />
19. Kritzman JN, Cahill JM, Ficaro EP, Corbett JR. Quantitative comparison of<br />
standard and reduced acquisition time attenuation corrected and non-corrected<br />
myocardial perfusion images: a phantom study utilizing a 3D iterative reconstruction<br />
[abstract]. J Nucl Cardiol. 2007;14(suppl 1):S107–S108.<br />
20. Valenta I, Treyer V, Husmann L, et al. New reconstruction algorithm allows<br />
shortened acquisition time for myocardial perfusion <strong>SPECT</strong> [abstract]. J Nucl<br />
Med. 2008;49(suppl 1):72P.<br />
21. Hansen CL, Goldstein RA, Akinboboye OO, et al. <strong>Myocardial</strong> perfusion and<br />
function: single photon emission computed tomography. J Nucl Cardiol. 2007;<br />
14:e39–e60.<br />
22. Henzlova MJ, Cerqueira MD, Mahmarian JJ, Yao SS. Stress protocols and<br />
tracers. J Nucl Cardiol. 2006;13:e80–e90.<br />
23. Abidov A, Bax JJ, Hayes SW, et al. Transient ischemic dilation ratio of the left<br />
ventricle is a significant predictor of future cardiac events in patients <strong>with</strong><br />
otherwise normal myocardial perfusion <strong>SPECT</strong>. J Am Col Cardiol. 2003;42:<br />
1818–1825.<br />
24. Iskandrian AE. Risk assessment of stable patients (panel III) [abstract]. J Nucl<br />
Cardiol. 1999;6:93.<br />
25. Narayanan MV, King MA, Pretorius PH, et al. Human-observer receiveroperating-characteristic<br />
evaluation of attenuation, scatter, and resolution compensation<br />
strategies for 99m Tc myocardial perfusion imaging. J Nucl Med.<br />
2003;44:1725–1734.<br />
26. Iskandrian AS, Heo J, Nguyen T, Lyons E, Paugh E. Left ventricular dilatation<br />
and pulmonary thallium uptake after single-photon emission computer tomography<br />
using thallium-201 during adenosine-induced coronary hyperemia. Am J<br />
Cardiol. 1990;66:807–811.<br />
27. Giorgetti A, Rossi M, Stanislao M, et al. Feasibility and diagnostic accuracy of a<br />
gated <strong>SPECT</strong> early imaging protocol: a multicenter study of the Myoview<br />
imaging optimization group. J Nucl Med. 2007;48:1670–1675.