American Educator, Winter 2010-11, Vol. 34, No. 4, AFT
American Educator, Winter 2010-11, Vol. 34, No. 4, AFT
American Educator, Winter 2010-11, Vol. 34, No. 4, AFT

You also want an ePaper? Increase the reach of your titles
YUMPU automatically turns print PDFs into web optimized ePapers that Google loves.
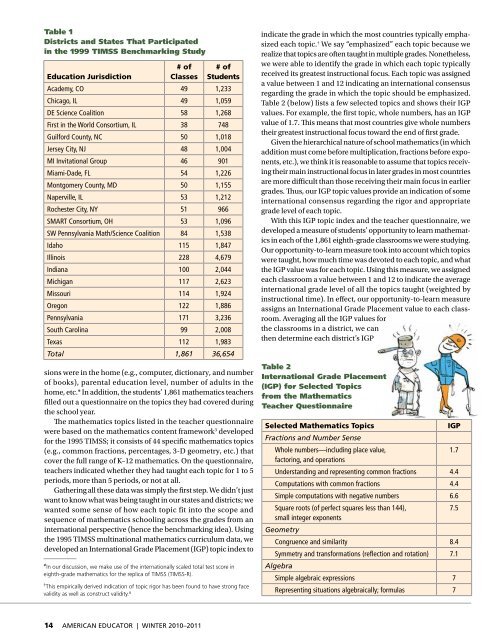
Table 1<br />
Districts and States That Participated<br />
in the 1999 TIMSS Benchmarking Study<br />
# of # of<br />
Education Jurisdiction<br />
Classes Students<br />
Academy, CO 49 1,233<br />
Chicago, IL 49 1,059<br />
DE Science Coalition 58 1,268<br />
First in the World Consortium, IL 38 748<br />
Guilford County, NC 50 1,018<br />
Jersey City, NJ 48 1,004<br />
MI Invitational Group 46 901<br />
Miami-Dade, FL 54 1,226<br />
Montgomery County, MD 50 1,155<br />
Naperville, IL 53 1,212<br />
Rochester City, NY 51 966<br />
SMART Consortium, OH 53 1,096<br />
SW Pennsylvania Math/Science Coalition 84 1,538<br />
Idaho <strong>11</strong>5 1,847<br />
Illinois 228 4,679<br />
Indiana 100 2,044<br />
Michigan <strong>11</strong>7 2,623<br />
Missouri <strong>11</strong>4 1,924<br />
Oregon 122 1,886<br />
Pennsylvania 171 3,236<br />
South Carolina 99 2,008<br />
Texas <strong>11</strong>2 1,983<br />
Total 1,861 36,654<br />
sions were in the home (e.g., computer, dictionary, and number<br />
of books), parental education level, number of adults in the<br />
home, etc.* In addition, the students’ 1,861 mathematics teachers<br />
filled out a questionnaire on the topics they had covered during<br />
the school year.<br />
The mathematics topics listed in the teacher questionnaire<br />
were based on the mathematics content framework 3 developed<br />
for the 1995 TIMSS; it consists of 44 specific mathematics topics<br />
(e.g., common fractions, percentages, 3-D geometry, etc.) that<br />
cover the full range of K–12 mathematics. On the questionnaire,<br />
teachers indicated whether they had taught each topic for 1 to 5<br />
periods, more than 5 periods, or not at all.<br />
Gathering all these data was simply the first step. We didn’t just<br />
want to know what was being taught in our states and districts; we<br />
wanted some sense of how each topic fit into the scope and<br />
sequence of mathematics schooling across the grades from an<br />
international perspective (hence the benchmarking idea). Using<br />
the 1995 TIMSS multinational mathematics curriculum data, we<br />
developed an International Grade Placement (IGP) topic index to<br />
*In our discussion, we make use of the internationally scaled total test score in<br />
eighth-grade mathematics for the replica of TIMSS (TIMSS-R).<br />
†<br />
This empirically derived indication of topic rigor has been found to have strong face<br />
validity as well as construct validity. 4<br />
14 AMERICAN EDUCATOR | WINTER <strong>2010</strong>–20<strong>11</strong><br />
indicate the grade in which the most countries typically emphasized<br />
each topic. † We say “emphasized” each topic because we<br />
realize that topics are often taught in multiple grades. <strong>No</strong>netheless,<br />
we were able to identify the grade in which each topic typically<br />
received its greatest instructional focus. Each topic was assigned<br />
a value between 1 and 12 indicating an international consensus<br />
regarding the grade in which the topic should be emphasized.<br />
Table 2 (below) lists a few selected topics and shows their IGP<br />
values. For example, the first topic, whole numbers, has an IGP<br />
value of 1.7. This means that most countries give whole numbers<br />
their greatest instructional focus toward the end of first grade.<br />
Given the hierarchical nature of school mathematics (in which<br />
addition must come before multiplication, fractions before exponents,<br />
etc.), we think it is reasonable to assume that topics receiving<br />
their main instructional focus in later grades in most countries<br />
are more difficult than those receiving their main focus in earlier<br />
grades. Thus, our IGP topic values provide an indication of some<br />
international consensus regarding the rigor and appropriate<br />
grade level of each topic.<br />
With this IGP topic index and the teacher questionnaire, we<br />
developed a measure of students’ opportunity to learn mathematics<br />
in each of the 1,861 eighth-grade classrooms we were studying.<br />
Our opportunity-to-learn measure took into account which topics<br />
were taught, how much time was devoted to each topic, and what<br />
the IGP value was for each topic. Using this measure, we assigned<br />
each classroom a value between 1 and 12 to indicate the average<br />
international grade level of all the topics taught (weighted by<br />
instructional time). In effect, our opportunity-to-learn measure<br />
assigns an International Grade Placement value to each classroom.<br />
Averaging all the IGP values for<br />
the classrooms in a district, we can<br />
then determine each district’s IGP<br />
Table 2<br />
International Grade Placement<br />
(IGP) for Selected Topics<br />
from the Mathematics<br />
Teacher Questionnaire<br />
Selected Mathematics Topics<br />
Fractions and Number Sense<br />
IGP<br />
Whole numbers—including place value,<br />
factoring, and operations<br />
1.7<br />
Understanding and representing common fractions 4.4<br />
Computations with common fractions 4.4<br />
Simple computations with negative numbers 6.6<br />
Square roots (of perfect squares less than 144),<br />
small integer exponents<br />
Geometry<br />
7.5<br />
Congruence and similarity 8.4<br />
Symmetry and transformations (reflection and rotation)<br />
Algebra<br />
7.1<br />
Simple algebraic expressions 7<br />
Representing situations algebraically; formulas 7