American Educator, Winter 2010-11, Vol. 34, No. 4, AFT
American Educator, Winter 2010-11, Vol. 34, No. 4, AFT
American Educator, Winter 2010-11, Vol. 34, No. 4, AFT

Create successful ePaper yourself
Turn your PDF publications into a flip-book with our unique Google optimized e-Paper software.
the literacy growth of our secondary students has fallen behind.<br />
Between 1994 and 1998, the United States joined 19 other<br />
developed countries in an international evaluation of adult literacy<br />
levels. 5 As compared with their peers in the other countries,<br />
the literacy scores of older U.S. adults (36 years old and up) were<br />
quite high, ranking in the top five. In contrast, the scores for<br />
younger U.S. adults (35 years old or less) ranked in the bottom half<br />
of the distribution by every measure. Among young adults with a<br />
high school diploma or less, those from the United States fell at<br />
the bottom of the pile, ranking 19th out of 20. Even among participants<br />
who had completed four or more years of postsecondary<br />
education, the scores of our young adults were below the average<br />
for same-aged and like-educated peers in the other countries. The<br />
young adults in this study would have graduated from high school<br />
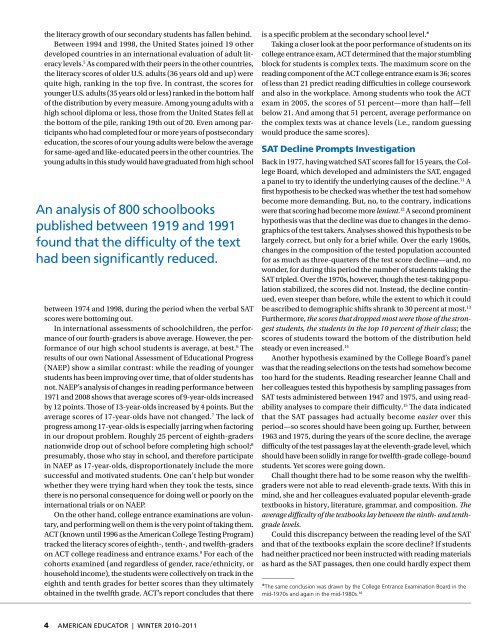
An analysis of 800 schoolbooks<br />
published between 1919 and 1991<br />
found that the difficulty of the text<br />
had been significantly reduced.<br />
between 1974 and 1998, during the period when the verbal SAT<br />
scores were bottoming out.<br />
In international assessments of schoolchildren, the performance<br />
of our fourth-graders is above average. However, the performance<br />
of our high school students is average, at best. 6 The<br />
results of our own National Assessment of Educational Progress<br />
(NAEP) show a similar contrast: while the reading of younger<br />
students has been improving over time, that of older students has<br />
not. NAEP’s analysis of changes in reading performance between<br />
1971 and 2008 shows that average scores of 9-year-olds increased<br />
by 12 points. Those of 13-year-olds increased by 4 points. But the<br />
average scores of 17-year-olds have not changed. 7 The lack of<br />
progress among 17-year-olds is especially jarring when factoring<br />
in our dropout problem. Roughly 25 percent of eighth-graders<br />
nationwide drop out of school before completing high school; 8<br />
presumably, those who stay in school, and therefore participate<br />
in NAEP as 17-year-olds, disproportionately include the more<br />
successful and motivated students. One can’t help but wonder<br />
whether they were trying hard when they took the tests, since<br />
there is no personal consequence for doing well or poorly on the<br />
international trials or on NAEP.<br />
On the other hand, college entrance examinations are voluntary,<br />
and performing well on them is the very point of taking them.<br />
ACT (known until 1996 as the <strong>American</strong> College Testing Program)<br />
tracked the literacy scores of eighth-, tenth-, and twelfth-graders<br />
on ACT college readiness and entrance exams. 9 For each of the<br />
cohorts examined (and regardless of gender, race/ethnicity, or<br />
household income), the students were collectively on track in the<br />
eighth and tenth grades for better scores than they ultimately<br />
obtained in the twelfth grade. ACT’s report concludes that there<br />
4 AMERICAN EDUCATOR | WINTER <strong>2010</strong>–20<strong>11</strong><br />
is a specific problem at the secondary school level.*<br />
Taking a closer look at the poor performance of students on its<br />
college entrance exam, ACT determined that the major stumbling<br />
block for students is complex texts. The maximum score on the<br />
reading component of the ACT college entrance exam is 36; scores<br />
of less than 21 predict reading difficulties in college coursework<br />
and also in the workplace. Among students who took the ACT<br />
exam in 2005, the scores of 51 percent—more than half—fell<br />
below 21. And among that 51 percent, average performance on<br />
the complex texts was at chance levels (i.e., random guessing<br />
would produce the same scores).<br />
SAT Decline Prompts Investigation<br />
Back in 1977, having watched SAT scores fall for 15 years, the College<br />
Board, which developed and administers the SAT, engaged<br />
a panel to try to identify the underlying causes of the decline. <strong>11</strong> A<br />
first hypothesis to be checked was whether the test had somehow<br />
become more demanding. But, no, to the contrary, indications<br />
were that scoring had become more lenient. 12 A second prominent<br />
hypothesis was that the decline was due to changes in the demographics<br />
of the test takers. Analyses showed this hypothesis to be<br />
largely correct, but only for a brief while. Over the early 1960s,<br />
changes in the composition of the tested population accounted<br />
for as much as three-quarters of the test score decline—and, no<br />
wonder, for during this period the number of students taking the<br />
SAT tripled. Over the 1970s, however, though the test-taking population<br />
stabilized, the scores did not. Instead, the decline continued,<br />
even steeper than before, while the extent to which it could<br />
be ascribed to demographic shifts shrank to 30 percent at most. 13<br />
Furthermore, the scores that dropped most were those of the strongest<br />
students, the students in the top 10 percent of their class; the<br />
scores of students toward the bottom of the distribution held<br />
steady or even increased. 14<br />
Another hypothesis examined by the College Board’s panel<br />
was that the reading selections on the tests had somehow become<br />
too hard for the students. Reading researcher Jeanne Chall and<br />
her colleagues tested this hypothesis by sampling passages from<br />
SAT tests administered between 1947 and 1975, and using readability<br />
analyses to compare their difficulty. 15 The data indicated<br />
that the SAT passages had actually become easier over this<br />
period—so scores should have been going up. Further, between<br />
1963 and 1975, during the years of the score decline, the average<br />
difficulty of the test passages lay at the eleventh-grade level, which<br />
should have been solidly in range for twelfth-grade college-bound<br />
students. Yet scores were going down.<br />
Chall thought there had to be some reason why the twelfthgraders<br />
were not able to read eleventh-grade texts. With this in<br />
mind, she and her colleagues evaluated popular eleventh-grade<br />
textbooks in history, literature, grammar, and composition. The<br />
average difficulty of the textbooks lay between the ninth- and tenthgrade<br />
levels.<br />
Could this discrepancy between the reading level of the SAT<br />
and that of the textbooks explain the score decline? If students<br />
had neither practiced nor been instructed with reading materials<br />
as hard as the SAT passages, then one could hardly expect them<br />
*The same conclusion was drawn by the College Entrance Examination Board in the<br />
mid-1970s and again in the mid-1980s. 10