Pneumocystis Pneumonia — Los Angeles - Centers for Disease ...
Pneumocystis Pneumonia — Los Angeles - Centers for Disease ...
Pneumocystis Pneumonia — Los Angeles - Centers for Disease ...

You also want an ePaper? Increase the reach of your titles
YUMPU automatically turns print PDFs into web optimized ePapers that Google loves.
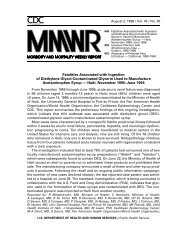
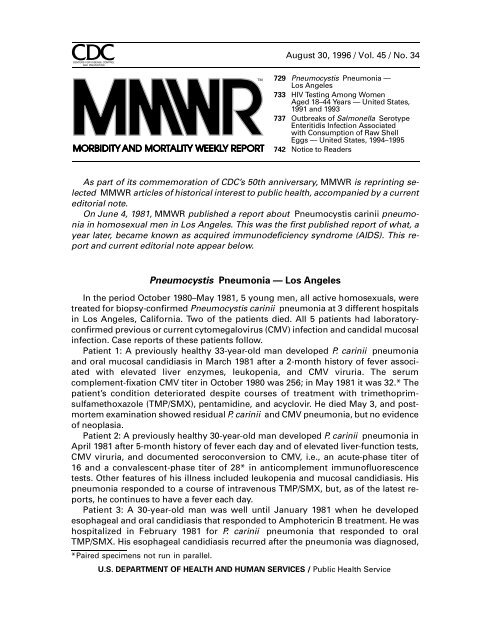
As part of its commemoration of CDC’s 50th anniversary, MMWR is reprinting selected<br />
MMWR articles of historical interest to public health, accompanied by a current<br />
editorial note.<br />
On June 4, 1981, MMWR published a report about <strong>Pneumocystis</strong> carinii pneumonia<br />
in homosexual men in <strong>Los</strong> <strong>Angeles</strong>. This was the first published report of what, a<br />
year later, became known as acquired immunodeficiency syndrome (AIDS). This report<br />
and current editorial note appear below.<br />
<strong>Pneumocystis</strong> <strong>Pneumonia</strong> <strong>—</strong> <strong>Los</strong> <strong>Angeles</strong><br />
<strong>Pneumonia</strong> In the period <strong>—</strong> October Continued 1980–May 1981, 5 young men, all active homosexuals, were<br />
treated <strong>for</strong> biopsy-confirmed <strong>Pneumocystis</strong> carinii pneumonia at 3 different hospitals<br />
in <strong>Los</strong> <strong>Angeles</strong>, Cali<strong>for</strong>nia. Two of the patients died. All 5 patients had laboratoryconfirmed<br />
previous or current cytomegalovirus (CMV) infection and candidal mucosal<br />
infection. Case reports of these patients follow.<br />
Patient 1: A previously healthy 33-year-old man developed P. carinii pneumonia<br />
and oral mucosal candidiasis in March 1981 after a 2-month history of fever associated<br />
with elevated liver enzymes, leukopenia, and CMV viruria. The serum<br />
complement-fixation CMV titer in October 1980 was 256; in May 1981 it was 32.* The<br />
patient’s condition deteriorated despite courses of treatment with trimethoprimsulfamethoxazole<br />
(TMP/SMX), pentamidine, and acyclovir. He died May 3, and postmortem<br />
examination showed residual P. carinii and CMV pneumonia, but no evidence<br />
of neoplasia.<br />
Patient 2: A previously healthy 30-year-old man developed P. carinii pneumonia in<br />
April 1981 after 5-month history of fever each day and of elevated liver-function tests,<br />
CMV viruria, and documented seroconversion to CMV, i.e., an acute-phase titer of<br />
16 and a convalescent-phase titer of 28* in anticomplement immunofluorescence<br />
tests. Other features of his illness included leukopenia and mucosal candidiasis. His<br />
pneumonia responded to a course of intravenous TMP/SMX, but, as of the latest reports,<br />
he continues to have a fever each day.<br />
Patient 3: A 30-year-old man was well until January 1981 when he developed<br />
esophageal and oral candidiasis that responded to Amphotericin B treatment. He was<br />
hospitalized in February 1981 <strong>for</strong> P. carinii pneumonia that responded to oral<br />
TMP/SMX. His esophageal candidiasis recurred after the pneumonia was diagnosed,<br />
*Paired specimens not run in parallel.<br />
TM<br />
August 30, 1996 / Vol. 45 / No. 34<br />
729 <strong>Pneumocystis</strong> <strong>Pneumonia</strong> <strong>—</strong><br />
<strong>Los</strong> <strong>Angeles</strong><br />
733 HIV Testing Among Women<br />
Aged 18–44 Years <strong>—</strong> United States,<br />
1991 and 1993<br />
737 Outbreaks of Salmonella Serotype<br />
Enteritidis Infection Associated<br />
with Consumption of Raw Shell<br />
Eggs <strong>—</strong> United States, 1994–1995<br />
742 Notice to Readers<br />
U.S. DEPARTMENT OF HEALTH AND HUMAN SERVICES / Public Health Service
730 MMWR August 30, 1996<br />
<strong>Pneumonia</strong> <strong>—</strong> Continued<br />
and he was again given Amphotericin B. The CMV complement-fixation titer in March<br />
1981 was 8. Material from an esophageal biopsy was positive <strong>for</strong> CMV.<br />
Patient 4: A 29-year-old man developed P. carinii pneumonia in February 1981. He<br />
had had Hodgkins disease 3 years earlier, but had been successfully treated with radiation<br />
therapy alone. He did not improve after being given intravenous TMP/SMX<br />
and corticosteroids and died in March. Postmortem examination showed no evidence<br />
of Hodgkins disease, but P. carinii and CMV were found in lung tissue.<br />
Patient 5: A previously healthy 36-year-old man with a clinically diagnosed CMV<br />
infection in September 1980 was seen in April 1981 because of a 4-month history of<br />
fever, dyspnea, and cough. On admission he was found to have P. carinii pneumonia,<br />
oral candidiasis, and CMV retinitis. A complement-fixation CMV titer in April 1981 was<br />
128. The patient has been treated with 2 short courses of TMP/SMX that have been<br />
limited because of a sulfa-induced neutropenia. He is being treated <strong>for</strong> candidiasis<br />
with topical nystatin.<br />
The diagnosis of <strong>Pneumocystis</strong> pneumonia was confirmed <strong>for</strong> all 5 patients antemortem<br />
by closed or open lung biopsy. The patients did not know each other and had<br />
no known common contacts or knowledge of sexual partners who had had similar<br />
illnesses. The 5 did not have comparable histories of sexually transmitted disease.<br />
Four had serologic evidence of past hepatitis B infection but had no evidence of current<br />
hepatitis B surface antigen. Two of the 5 reported having frequent homosexual<br />
contacts with various partners. All 5 reported using inhalant drugs, and 1 reported<br />
parenteral drug abuse. Three patients had profoundly depressed in vitro proliferative<br />
responses to mitogens and antigens. Lymphocyte studies were not per<strong>for</strong>med on the<br />
other 2 patients.<br />
Reported by MS Gottlieb, MD, HM Schanker, MD, PT Fan, MD, A Saxon, MD, JD Weisman, DO,<br />
Div of Clinical Immunology-Allergy, Dept of Medicine, UCLA School of Medicine; I Pozalski, MD,<br />
Cedars-Mt. Sinai Hospital, <strong>Los</strong> <strong>Angeles</strong>; Field Services Div, Epidemiology Program Office, CDC.<br />
Editorial Note: <strong>Pneumocystis</strong> pneumonia in the United States is almost exclusively<br />
limited to severely immunosuppressed patients (1 ). The occurrence of pneumocystosis<br />
in these 5 previously healthy individuals without a clinically apparent underlying<br />
immunodeficiency is unusual. The fact that these patients were all homosexuals<br />
suggests an association between some aspect of a homosexual lifestyle or disease<br />
acquired through sexual contact and <strong>Pneumocystis</strong> pneumonia in this population. All<br />
5 patients described in this report had laboratory-confirmed CMV disease or virus<br />
shedding within 5 months of the diagnosis of <strong>Pneumocystis</strong> pneumonia. CMV infection<br />
has been shown to induce transient abnormalities of in vitro cellular-immune<br />
function in otherwise healthy human hosts (2,3 ). Although all 3 patients tested had<br />
abnormal cellular-immune function, no definitive conclusion regarding the role of<br />
CMV infection in these 5 cases can be reached because of the lack of published data<br />
on cellular-immune function in healthy homosexual males with and without CMV antibody.<br />
In 1 report, 7 (3.6%) of 194 patients with pneumocystosis also had CMV infection;<br />
40 (21%) of the same group had at least 1 other major concurrent infection (1 ). A<br />
high prevalence of CMV infections among homosexual males was recently reported:<br />
179 (94%) of 190 males reported to be exclusively homosexual had serum antibody to<br />
CMV, and 14 (7.4%) had CMV viruria; rates <strong>for</strong> 101 controls of similar age who were<br />
reported to be exclusively heterosexual were 54% <strong>for</strong> seropositivity and zero <strong>for</strong><br />
viruria (4 ). In another study of 64 males, 4 (6.3%) had positive tests <strong>for</strong> CMV in semen,
Vol. 45 / No. 34 MMWR 731<br />
<strong>Pneumonia</strong> <strong>—</strong> Continued<br />
but none had CMV recovered from urine. Two of the 4 reported recent homosexual<br />
contacts. These findings suggest not only that virus shedding may be more readily<br />
detected in seminal fluid than in urine, but also that seminal fluid may be an important<br />
vehicle of CMV transmission (5 ).<br />
All the above observations suggest the possibility of a cellular-immune dysfunction<br />
related to a common exposure that predisposes individuals to opportunistic infections<br />
such as pneumocystosis and candidiasis. Although the role of CMV infection in the<br />
pathogenesis of pneumocystosis remains unknown, the possibility of P. carinii infection<br />
must be carefully considered in a differential diagnosis <strong>for</strong> previously healthy<br />
homosexual males with dyspnea and pneumonia.<br />
References<br />
1. Walzer PD, Perl DP, Krogstad DJ, Rawson PG, Schultz MG. <strong>Pneumocystis</strong> carinii pneumonia<br />
in the United States. Epidemiologic, diagnostic, and clinical features. Ann Intern Med<br />
1974;80:83–93.<br />
2. Rinaldo CR, Jr, Black PH, Hirsch MS. Interaction of cytomegalovirus with leukocytes from patients<br />
with mononucleosis due to cytomegalovirus. J Infect Dis 1977;136:667–78.<br />
3. Rinaldo CR, Jr, Carney WP, Richter BS, Black PH, Hirsch MS. Mechanisms of immunosuppression<br />
in cytomegaloviral mononucleosis. J Infect Dis 1980;141:488–95.<br />
4. Drew WL, Mintz L, Miner RC, Sands M, Ketterer B. Prevalence of cytomegalovirus infection<br />
in homosexual men. J Infect Dis 1981;143:188–92.<br />
5. Lang DJ, Kummer JF. Cytomegalovirus in semen: observations in selected populations. J Infect<br />
Dis 1975;132:472–3.<br />
Editorial Note<strong>—</strong>1996: The June 4, 1981, report of five cases of <strong>Pneumocystis</strong> carinii<br />
pneumonia (PCP) in homosexual men in <strong>Los</strong> <strong>Angeles</strong> was the first published report<br />
about acquired immunodeficiency syndrome (AIDS). This report in MMWR alerted<br />
the medical and public health communities 4 months be<strong>for</strong>e the first peer-reviewed<br />
article was published (1 ).<br />
The timeliness of this report can be credited to the public health sensitivity of the<br />
astute reporting physicians and the diligence of CDC staff. Dr. Gottlieb and his colleagues<br />
at the University of Cali<strong>for</strong>nia at <strong>Los</strong> <strong>Angeles</strong> School of Medicine and Cedars-<br />
Mt. Sinai Hospital worked closely with the CDC Epidemic Intelligence Service Officer<br />
assigned to the <strong>Los</strong> <strong>Angeles</strong> Department of Health Services to summarize the data and<br />
draft this brief report. When news of these cases reached CDC, scientists in the Parasitic<br />
<strong>Disease</strong>s Division of CDC’s Center <strong>for</strong> Infectious <strong>Disease</strong>s already were concerned<br />
about other unusual cases of PCP. That division housed the Parasitic <strong>Disease</strong>s Drug<br />
Service and requests <strong>for</strong> pentamidine isethionate to treat PCP in other similar patients<br />
in New York had been called to the attention of these scientists by the CDC employee<br />
who administered the distribution of this drug (which was not yet licensed and was<br />
available in the United States only from CDC).<br />
In July 1981, following the report of these cases of PCP and cases of other rare<br />
life-threatening opportunistic infections and cancers (2 ), CDC <strong>for</strong>med a Task Force on<br />
Kaposi’s Sarcoma and Opportunistic Infections. A key first task facing CDC was to develop<br />
a case definition <strong>for</strong> this condition and to conduct surveillance. The CDC case<br />
definition was adopted quickly worldwide. Results from active surveillance conducted<br />
in the United States rapidly established that the syndrome was new, and the number<br />
of cases was increasing rapidly (3 ). By the end of 1982, the distribution pattern of<br />
cases strongly suggested that AIDS was caused by an agent transmitted through sexual<br />
contact between men (4,5 ) and between men and women (6,7 ) and transmitted
732 MMWR August 30, 1996<br />
<strong>Pneumonia</strong> <strong>—</strong> Continued<br />
through blood among injecting-drug users and among recipients of blood or blood<br />
products (8–10 ). Cases also were identified among infants born to women with AIDS<br />
or at risk <strong>for</strong> AIDS (11 ), and the epidemic extended beyond the life-threatening reported<br />
cases to include persistent unexplained lymphadenopathy (12 ).<br />
To prevent transmission of AIDS, in 1983 the Public Health Service used epidemiologic<br />
in<strong>for</strong>mation about the condition to recommend that sexual contact be avoided<br />
with persons known or suspected to have AIDS and that persons at increased risk <strong>for</strong><br />
AIDS refrain from donating plasma or blood (10,13 ). In addition, work was intensified<br />
toward developing safer blood products <strong>for</strong> persons with hemophilia. These recommendations<br />
were developed and published only 21 months after the first cases were<br />
reported and well be<strong>for</strong>e the first published reports identifying what is now termed<br />
HIV as the etiologic agent of AIDS (14,15 ). Isolation of HIV enabled development of<br />
assays to diagnose infections; characterization of the natural history of HIV; further<br />
protection of the blood supply; development of specific antiviral therapies; and expansion<br />
of surveillance criteria to include other conditions indicative of severe HIV disease.<br />
Research and prevention programs <strong>for</strong> HIV have contributed greatly to scientific<br />
and programmatic approaches to other public health problems.<br />
During 1981–1996, approximately 350 reports related to AIDS were published in<br />
MMWR, an average of two per month since June 1981. Throughout the HIV epidemic,<br />
timely publication of reports about AIDS and related topics in MMWR have continued<br />
to play a crucial role in alerting health professionals and the public.<br />
In 1996, HIV transmission occurs worldwide and has an impact in all countries<br />
(16 ). In the United States, prevention ef<strong>for</strong>ts have been successful at reducing HIV<br />
transmission. For example, blood-donor deferral and blood screening have virtually<br />
eliminated HIV transmission through blood and blood products, and adoption of less<br />
risky behaviors has greatly reduced sexual transmission between men; most recently,<br />
therapeutic advances have reduced transmission from mother to newborn (17 ). However,<br />
in the United States, AIDS has been diagnosed in 548,000 persons, and 343,000<br />
have died. HIV infection has become the leading cause of death <strong>for</strong> persons aged 25–<br />
44 years, and an estimated 650,000–950,000 persons are living with HIV infection.<br />
Throughout the world, HIV continues to spread rapidly, especially in impoverished<br />
populations in Africa, Asia, and South and Central America. The emergence of the HIV<br />
pandemic demonstrates the vulnerability of the world’s populations to previously unknown<br />
infectious diseases.<br />
The first 15 years in the recorded history of AIDS have included remarkable scientific<br />
successes and countless examples of individual courage and accomplishment.<br />
Although these accomplishments provide hope <strong>for</strong> the future, further ef<strong>for</strong>ts are<br />
needed to halt the steady spread of HIV throughout the world.<br />
Editorial Note by: James W. Curran, M.D., Dean, Rollins School of Public Health of Emory<br />
University (Atlanta); Coordinator of the 1981 Task Force on Kaposi’s Sarcoma and Opportunistic<br />
Infections; and <strong>for</strong>mer Director of the Office of HIV/AIDS, CDC.<br />
References<br />
1. Hymes KB, Cheung T, Greene JB, et al. Kaposi’s sarcoma in homosexual men: a report of<br />
eight cases. Lancet 1981;2:598–600.<br />
2. CDC. Kaposi’s sarcoma and <strong>Pneumocystis</strong> pneumonia among homosexual men<strong>—</strong>New York<br />
City and Cali<strong>for</strong>nia. MMWR 1981;30:305–8.
Vol. 45 / No. 34 MMWR 733<br />
<strong>Pneumonia</strong> <strong>—</strong> Continued<br />
3. CDC Task Force on Kaposi’s Sarcoma and Opportunistic Infections. Epidemiologic aspects<br />
of the current outbreak of Kaposi’s sarcoma and opportunistic infections. N Engl J Med<br />
1982;306:248–52.<br />
4. CDC. A cluster of Kaposi’s sarcoma and <strong>Pneumocystis</strong> carinii pneumonia among homosexual<br />
male residents of <strong>Los</strong> <strong>Angeles</strong> and Orange counties, Cali<strong>for</strong>nia. MMWR 1982;31:305–7.<br />
5. Jaffe HW, Choi K, Thomas PA, et al. National case-control study of Kaposi’s sarcoma and<br />
<strong>Pneumocystis</strong> carinii pneumonia in homosexual men: part 1, epidemiologic results. Ann Intern<br />
Med 1983;99:145–51.<br />
6. CDC. Immunodeficiency among female sexual partners of males with acquired immune deficiency<br />
syndrome (AIDS)<strong>—</strong>New York. MMWR 1983;31:697–8.<br />
7. Harris C, Small CB, Klein RS, et al. Immunodeficiency in female sexual partners of men with<br />
the acquired immunodeficiency syndrome. N Engl J Med 1983;308:1181–4.<br />
8. CDC. <strong>Pneumocystis</strong> carinii pneumonia among persons with hemophilia A. MMWR<br />
1982;31:365–7.<br />
9. CDC. Possible transfusion-associated acquired immune deficiency syndrome (AIDS)<strong>—</strong><br />
Cali<strong>for</strong>nia. MMWR 1982;31:652–54.<br />
10. CDC. Acquired immune deficiency syndrome (AIDS): precautions <strong>for</strong> clinical and laboratory<br />
staffs. MMWR 1982;31:577–80.<br />
11. CDC. Unexplained immunodeficiency and opportunistic infections in infants<strong>—</strong>New York, New<br />
Jersey, and Cali<strong>for</strong>nia. MMWR 1982;31:665–7.<br />
12. CDC. Persistent, generalized lymphadenopathy among homosexual males. MMWR 1982;31:<br />
249–51.<br />
13. CDC. Prevention of acquired immune deficiency syndrome (AIDS): report of inter-agency recommendations.<br />
MMWR 1983;32:101–3.<br />
14. Barre-Sinoussi F, Chermann JC, Rey F, et al. Isolation of a T-lymphotropic retrovirus from a<br />
patient at risk <strong>for</strong> acquired immune deficiency syndrome (AIDS). Science 1983;220:868–71.<br />
15. Gallo RC, Salahuddin SZ, Popovic M, et al. Frequent detection and isolation of cytopathic<br />
retroviruses (HTLV-III) from patients with AIDS and at risk <strong>for</strong> AIDS. Science 1984;224:500–3.<br />
16. Mann J, Tarantela D, eds. AIDS in the world II. New York: Ox<strong>for</strong>d University Press, 1996.<br />
17. CDC. Recommendations of the U.S. Public Health Service Task Force on the Use of Zidovudine<br />
to Reduce Perinatal Transmission of Human Immunodeficiency Virus. MMWR 1994;43(no.<br />
RR-11).<br />
<strong>Pneumonia</strong> <strong>—</strong> Continued<br />
HIV Testing Among Women Aged 18–44 Years <strong>—</strong><br />
United States, 1991 and 1993<br />
Human HIV Testing immunodeficiency Among Women virus <strong>—</strong> Continued (HIV) infection is a major cause of morbidity and<br />
mortality among women and children in the United States. In 1995, of the 73,380 acquired<br />
immunodeficiency syndrome (AIDS) cases reported, women accounted <strong>for</strong><br />
13,764 (19%) (1 ). HIV infection is the third leading cause of death among all U.S.<br />
women aged 25–44 years and the leading cause of death among black women in this<br />
age group (2 ). Moreover, an estimated 7000 infants are born to HIV-infected women<br />
in the United States each year (3 ); without intervention, approximately 15%–30% of<br />
these infants would be infected (4 ). HIV counseling and testing services are important<br />
<strong>for</strong> women to reduce their risk <strong>for</strong> becoming infected or, if already infected, to initiate<br />
early treatment and prevent HIV transmission to others, including their infants. This<br />
report summarizes findings about HIV-testing practices <strong>for</strong> women aged 18–44 years<br />
based on data obtained from CDC’s 1991 and 1993 AIDS Knowledge and Attitudes<br />
Supplements to the National Health Interview Survey (NHIS-AIDS), which indicate<br />
that approximately one third of women aged 18–44 years have been tested <strong>for</strong> HIV.<br />
The NHIS is an annual national probability sample of the civilian household population<br />
of the United States. Data about HIV testing have been collected annually as
734 MMWR August 30, 1996<br />
HIV Testing Among Women <strong>—</strong> Continued<br />
part of the NHIS-AIDS Supplement since 1987. In<strong>for</strong>mation about a broad range of<br />
issues related to HIV infection and AIDS was collected through personal interview<br />
with one randomly selected adult (aged ≥18 years) per household. Response rates <strong>for</strong><br />
the 1991 and 1993 NHIS-AIDS were 86% and 80%, respectively. In<strong>for</strong>mation about voluntary<br />
HIV-testing practices was analyzed <strong>for</strong> women aged 18–44 years who responded<br />
to the survey; women who had HIV tests at the time of blood donation were<br />
excluded. Because interviews <strong>for</strong> the 1993 NHIS-AIDS were conducted only <strong>for</strong><br />
6 months, the number of responses from women in this age group is smaller (n=6267)<br />
than in 1991 (n=13,411). All data were analyzed using SUDAAN and weighted to produce<br />
national estimates.<br />
Although the 1993 NHIS-AIDS provides the most recent national data available<br />
about HIV testing,* in<strong>for</strong>mation about current or past pregnancies was collected only<br />
during 1991. However, because the number of pregnant women responding to the<br />
1991 survey was too small <strong>for</strong> meaningful estimates of HIV testing, 1991 data were<br />
analyzed <strong>for</strong> the 30% of women (n=3996) who reported having had a live-born infant<br />
during the preceding 5 years.<br />
Trends<br />
In 1991, 18.8% of women aged 18–44 years reported having been tested <strong>for</strong> HIV<br />
antibody (Table 1). The proportion of black (25.7%) and Hispanic (27.5%) women who<br />
reported having been tested was substantially greater than that <strong>for</strong> white women<br />
(16.2%). † In addition, women with
Vol. 45 / No. 34 MMWR 735<br />
HIV Testing Among Women <strong>—</strong> Continued<br />
TABLE 1. Percentage of women aged 18–44 years who reported having ever been<br />
tested <strong>for</strong> HIV antibody, by selected characteristics and year <strong>—</strong> United States, National<br />
Health Interview Survey of AIDS Knowledge and Attitudes, 1991 and 1993<br />
Characteristic<br />
1991<br />
(n=13,411)<br />
%<br />
Tested (95% CI † )<br />
1991*<br />
(n=3,996)<br />
%<br />
Tested (95% CI)<br />
1993<br />
(n=6,267)<br />
%<br />
Tested (95% CI)<br />
Race/Ethnicity §<br />
White, non-Hispanic 16.2 (15.3%–17.1%) 22.2 (20.3%–24.1%) 27.9 (26.3%–29.5%)<br />
Black, non-Hispanic 25.7 (23.3%–28.1%) 33.4 (29.4%–37.4%) 46.1 (42.4%–49.8%)<br />
Hispanic<br />
Education (yrs)<br />
27.5 (23.9%–31.1%) 35.0 (28.8%–41.2%) 39.7 (35.0%–44.4%)<br />
736 MMWR August 30, 1996<br />
HIV Testing Among Women <strong>—</strong> Continued<br />
(36.9%) compared with high school graduates (31.5%) or those with college education<br />
(30.4%). In addition, more women living in poverty reported having been tested <strong>for</strong><br />
HIV (40.2%) than did women living at or above the poverty level (30.3%). HIV-testing<br />
trends among women aged 18–44 years were similar to those in 1991 with respect to<br />
marital status, risk perception, and region of residence; however, the proportions of<br />
women tested in all three groups increased during 1991–1993 (Table 1). During 1991–<br />
1993, the proportion of women tested who had higher perceived risk <strong>for</strong> HIV did not<br />
increase; however, the proportion tested with low or no perceived risk nearly doubled.<br />
Women Who Had a Live-Born Infant During the Preceding 5 Years<br />
In 1991, a higher proportion of women who reported having had a live-born infant<br />
during the preceding 5 years had been tested <strong>for</strong> HIV (25.7%) compared with all<br />
women aged 18–44 years (18.8%) (Table 1). Among women who reported a high or<br />
medium risk <strong>for</strong> becoming or being infected, percentages were similar <strong>for</strong> those who<br />
had had a live-born infant during the preceding 5 years (41.0%) and all women<br />
(39.6%). Among women who reported having had a live-born infant during the preceding<br />
5 years, testing rates were highest among Hispanics (35.0%) and blacks<br />
(33.4%), women with
Vol. 45 / No. 34 MMWR 737<br />
HIV Testing Among Women <strong>—</strong> Continued<br />
prevention interventions that address the particular concerns of black and Hispanic<br />
women (9,10 ).<br />
Congress recently passed legislation stating that HIV counseling and voluntary<br />
testing should be the standard of care <strong>for</strong> all pregnant women in the United States**.<br />
Surveys such as the NHIS-AIDS and other studies will provide important data to help<br />
public health and other health-care professionals evaluate the extent of implementation<br />
of this prevention measure and its impact on reducing HIV-related morbidity and<br />
mortality among women and children.<br />
References<br />
1. CDC. HIV/AIDS surveillance report, 1995. Atlanta: US Department of Health and Human Services,<br />
Public Health Service, 1996. (Vol 7, no. 2).<br />
2. CDC. Update: mortality attributable to HIV infection among persons aged 25–44 years<strong>—</strong>United<br />
States, 1994. MMWR 1996;45:121–5.<br />
3. Davis SF, Byers RH, Lindegren ML, Caldwell MB, Karon JM, Gwinn M. Prevalence and incidence<br />
of vertically acquired HIV infection in the United States. JAMA 1995;274:952–5.<br />
4. CDC. U.S. Public Health Service recommendations <strong>for</strong> human immunodeficiency virus counseling<br />
and voluntary testing <strong>for</strong> pregnant women. MMWR 1995;44(no. RR-7).<br />
5. CDC. Recommendations <strong>for</strong> assisting in the prevention of the perinatal transmission of human<br />
T-lymphotropic virus type III/lymphadenopathy-associated virus and acquired immunodeficiency<br />
syndrome. MMWR 1985;34:721–32.<br />
6. Barbacci MB, Dalabetta GA, Repke JT, et al. Human immunodeficiency virus infection in<br />
women attending an inner-city prenatal clinic: ineffectiveness of targeted screening. Sex<br />
Transm Dis 1990;17:122–6.<br />
7. Fehrs LJ, Hill D, Kerndt PR, Rose TP, Henneman C. Targeted HIV screening at a <strong>Los</strong> <strong>Angeles</strong><br />
prenatal/family planning health center. Am J Public Health 1991;81:619–22.<br />
8. Rosenberg PS. Scope of the AIDS epidemic in the United States. Science 1995;270:1372–5.<br />
9. Sikkema KJ, Koob JJ, Cargill VC, et al. Levels and predictors of HIV risk behavior among<br />
women in low-income public housing developments. Public Health Rep 1995;110:707–13.<br />
10. O’Donnell L, San Doval A, Vornfett R, O’Donnell CR. STD prevention and the challenge of<br />
gender and cultural diversity: knowledge, attitudes, and risk behaviors among black and Hispanic<br />
inner-city STD clinic patients. Sex Transm Dis 1994;21:137–48.<br />
HIV Testing Among Women <strong>—</strong> Continued<br />
**Public Law 101-545.<br />
Outbreaks of Salmonella Serotype Enteritidis Infection<br />
Associated with Consumption of Raw Shell Eggs <strong>—</strong><br />
United States, 1994–1995<br />
Salmonella serotype Enteritidis (SE) accounts <strong>for</strong> an increasing proportion of all<br />
Salmonella serotypes reported to CDC’s National Salmonella Surveillance System.<br />
During 1976–1994, the proportion of reported Salmonella isolates that were SE increased<br />
from 5% to 26% (Figure 1). During 1985–1995, state and territorial health departments<br />
reported 582 SE outbreaks, which accounted <strong>for</strong> 24,058 cases of illness,<br />
2290 hospitalizations, and 70 deaths. This report describes four SE outbreaks during<br />
1994–1995 associated with consumption of raw shell eggs (i.e., unpasteurized eggs)<br />
and underscores that outbreaks of egg-associated SE infections remain a public<br />
health problem.
738 MMWR August 30, 1996<br />
Salmonella <strong>—</strong> Continued<br />
FIGURE 1. Percentage of all Salmonella isolates that were serotype Enteritidis, by<br />
year <strong>—</strong> United States, 1976–1994<br />
Percent<br />
30<br />
25<br />
20<br />
15<br />
10<br />
5<br />
0<br />
1976 1978 1980 1982 1984 1986 1988 1990 1992 1994<br />
Year of Report<br />
Washington, D.C.<br />
In August 1994, a total of 56 persons who ate at a Washington, D.C., hotel had onset<br />
of diarrhea; 20 persons were hospitalized. Salmonella group D was isolated from<br />
stools of the 29 patrons who submitted specimens; 27 of the 29 isolates further typed<br />
were identified as SE.<br />
An investigation by the District of Columbia Commission of Public Health (DCCPH)<br />
involved 41 ill patrons and 23 well patrons who had eaten brunch at the hotel on August<br />
28. A case was defined as onset of diarrheal illness in a person who ate brunch at<br />
the hotel on August 28. All 39 patrons who had eaten hollandaise sauce became ill,<br />
compared with two (8%) of 25 persons who had not eaten the sauce (odds ratio<br />
[OR]=undefined; lower 95% confidence limit=52; p=
Vol. 45 / No. 34 MMWR 739<br />
Salmonella <strong>—</strong> Continued<br />
dents and staff yielded 39 confirmed cases of SE. The one isolate tested was phage<br />
type 13A. Three residents died from complications of SE infection.<br />
An investigation by the Indiana State Department of Health and the Vanderburgh<br />
County Health Department involved seven of the initial 18 case-patients and 13 well<br />
residents. A case was defined as diarrheal illness in a nursing home resident with<br />
onset on June 9. Six (86%) of the seven patients had eaten baked eggs <strong>for</strong> breakfast<br />
on June 7, compared with three (23%) of 13 well persons (OR=16.5; 95% CI=1.3–1009;<br />
p=0.02).<br />
The baked eggs were prepared by hand-cracking and pooling 180 medium grade A<br />
raw shell eggs, mixing the eggs with a hand whisk, and baking them in a single 8-inch<br />
deep pan at 400 F (204 C) <strong>for</strong> 45 minutes–1 hour. The eggs were then placed on a<br />
steam table where an internal temperature was obtained and reported in a chart log.<br />
Although recorded internal temperatures of eggs prepared during June ranged from<br />
180 F–200 F (82 C–93 C), inadequate cooking may have contributed to the outbreak<br />
because the eggs were not stirred while being baked, and the internal temperature<br />
was obtained from only one place in the pan. The eggs were served within 30 minutes<br />
after cooking.<br />
At the time of the investigation, none of the prepared eggs or raw shell eggs from<br />
the same shipment were available <strong>for</strong> testing. APHIS traced the implicated eggs to a<br />
distributor who received eggs from at least 35 different flocks.<br />
Greenport, New York<br />
On June 24, 1995, a total of 76 persons attended a catered wedding reception. Following<br />
the reception, attendees contacted the local health department to report onset<br />
of a gastrointestinal illness. Salmonella group D was isolated from stools of the<br />
13 persons who submitted specimens; 11 of the 13 isolates further typed were identified<br />
as SE.<br />
An investigation by the Suffolk County Health Department involved the 28 ill attendees<br />
and the 12 well attendees that were contacted. A case was defined as onset of<br />
diarrheal illness in an attendee of the reception. Twenty-six (93%) of 28 persons who<br />
had eaten Caesar salad became ill, compared with two (17%) of 12 persons who had<br />
not eaten the salad, (OR=52; 95% CI=6.2–849; p=
740 MMWR August 30, 1996<br />
Salmonella <strong>—</strong> Continued<br />
drank the beverage immediately after preparation, and the third drank it 5 hours later.<br />
The beverage had been refrigerated after preparation.<br />
Cultures of the leftover beverage, raw eggs from the same carton used to prepare<br />
the drink, and leftover egg shells from the eggs used to prepare the drink all yielded<br />
SE. Isolates from the one patient tested and all three food samples were phage type<br />
13A.<br />
Traceback of the implicated eggs by NYSDAM identified a single flock in Pennsylvania.<br />
At the recommendation of the Pennsylvania Department of Health, eggs from<br />
the implicated flock were diverted to a pasteurization plant.<br />
Reported by: M Levy, MD, M Fletcher, PhD, M Moody, MS, Bur of Epidemiology and <strong>Disease</strong><br />
Control, District of Columbia Commission of Public Health. D Cory, W Corbitt, MS, C Borowiecki,<br />
D Gries, J Heidingsfelder, MD, Vanderburgh County Health Dept, Evansville; A Oglesby, MPH,<br />
J Butwin, MSN, D Ewert, MPH, D Bixler, MD, B Barrett, K Laurie, E Muniz, MD, G Steele, DrPH,<br />
State Epidemiologist, Indiana State Dept of Health. A Baldonti, MD, Albert Einstein College of<br />
Medicine, New York City; B Williamson, Suffolk County Health Dept, Hauppauge; M Layton, MD,<br />
Bur of Communicable <strong>Disease</strong> Control, L Kornstein, PhD, Bur of Laboratories, E Griffin, Bur of<br />
Environmental Investigation, New York City Health Dept; M Cambridge, N Fogg, J Guzewich,<br />
Bur of Community Sanitation and Food Protection, T Root, Wadsworth Center <strong>for</strong> Laboratories<br />
and Research, D Morse, MD, State Epidemiologist, New York State Dept of Health; J Wagoner,<br />
New York State Dept of Agriculture and Markets. M Deasey, Div of Epidemiology, Pennsylvania<br />
Dept of Health; K Miller, Pennsylvania Dept of Agriculture. Animal and Plant Health Inspection<br />
Service, Food Safety and Inspection Service, US Dept of Agriculture. Food and Drug Administration.<br />
Foodborne and Diarrheal <strong>Disease</strong>s Br, Div of Bacterial and Mycotic <strong>Disease</strong>s, National<br />
Center <strong>for</strong> Infectious <strong>Disease</strong>s, CDC.<br />
Editorial Note: During 1976–1994, rates of isolation of SE increased in the United<br />
States from 0.5 to 3.9 per 100,000 population (Figure 2). Two important factors probably<br />
contributed to the increase in 1994: 1) the effect of an outbreak of SE infections<br />
associated with a nationally distributed ice cream product (1 ) and 2) the expansion of<br />
the SE epidemic into Cali<strong>for</strong>nia. During 1990–1994, the SE isolation rate <strong>for</strong> the Northeast<br />
region decreased from 8.9 to 7.0 per 100,000 population; the rate increased ap-<br />
FIGURE 2. Rate* of isolation of Salmonella serotype Enteritidis, by region and year<br />
<strong>—</strong> United States, 1976–1994<br />
Rate<br />
12<br />
10<br />
8<br />
6<br />
4<br />
2<br />
Northeast<br />
Pacific<br />
Other<br />
Total<br />
0<br />
1976 1978 1980 1982 1984 1986 1988 1990 1992 1994<br />
*Per 100,000 population.<br />
Year
Vol. 45 / No. 34 MMWR 741<br />
Salmonella <strong>—</strong> Continued<br />
proximately threefold <strong>for</strong> the Pacific region (Figure 2). This increase was primarily<br />
associated with reports from Cali<strong>for</strong>nia, where the percentage of Salmonella isolates<br />
that were SE increased from 11% in 1990 to 38% in 1994. In 1994, 24% of all SE isolates<br />
in the United States were from Cali<strong>for</strong>nia. In the United States, both sporadic and outbreak-associated<br />
cases of SE infection frequently have been associated with consumption<br />
of raw or undercooked shell eggs (2–4 ).<br />
The findings in this report illustrate that outbreaks of egg-associated SE infections<br />
remain a public health problem in commercial food-service establishments, institutional<br />
facilities, and private homes throughout the United States. However, the risk <strong>for</strong><br />
SE infection in humans can be reduced through public health prevention ef<strong>for</strong>ts (see<br />
box) (5 ).<br />
In 1994, no reported deaths resulted from SE outbreaks in the United States; however,<br />
in 1995, five deaths were associated with SE outbreaks, including the three in<br />
Indiana described in this report. One possible explanation <strong>for</strong> the lack of deaths in<br />
1994 is that no nursing home outbreaks were reported that year; four of the five reported<br />
deaths in 1995 occurred among nursing home residents. During 1985–1991, a<br />
total of 59 SE outbreaks occurred in hospitals or nursing homes, accounting <strong>for</strong> only<br />
12% of all outbreak-associated cases but 90% of all deaths. The case-fatality rate in<br />
these institutions was 70 times higher than in outbreaks in other settings (4 ). This<br />
underscores the importance of using pasteurized egg products <strong>for</strong> all recipes requiring<br />
pooled, raw, or undercooked shell eggs <strong>for</strong> the institutionalized elderly and other<br />
high-risk populations.<br />
In 1990, USDA initiated a mandatory program to test <strong>for</strong> SE in breeder flocks that<br />
produce egg-laying chickens. In addition, USDA traced the eggs implicated in human<br />
foodborne SE outbreaks back to the farm of origin and, when feasible, conducted serologic<br />
and microbiologic assessments of the farm. If SE was detected at the source<br />
farm, the eggs were diverted to pasteurization. Funding <strong>for</strong> this program was discontinued<br />
effective October 1, 1995. As a result, these ef<strong>for</strong>ts are conducted by the Food<br />
Recommendations <strong>for</strong> Preventing<br />
Salmonella Serotype Enteritidis Infections Associated with Eggs<br />
• Consumption of raw or undercooked eggs should be avoided, especially by<br />
immunocompromised or other debilitated persons.<br />
• In hospitals, nursing homes, and commercial kitchens, pooled eggs or raw or<br />
undercooked eggs should be substituted with pasteurized egg products.<br />
• Eggs should be cooked at ≥145 F (≥63 C) <strong>for</strong> ≥15 seconds (until the white is<br />
completely set and the yolk begins to thicken) and eaten promptly after cooking.<br />
• Hands, cooking utensils, and food-preparation surfaces should be washed with<br />
soap and water after contact with raw eggs.<br />
• Eggs should be purchased refrigerated and stored refrigerated at ≤41 F (≤5 C) at<br />
all times.<br />
• Flock-based egg-quality–assurance programs that meet national standards and<br />
include microbiologic testing should be adopted by industry nationwide.
742 MMWR August 30, 1996<br />
Salmonella <strong>—</strong> Continued<br />
and Drug Administration, which has regulatory authority <strong>for</strong> shell eggs in interstate<br />
commerce.<br />
Further control of SE will require limiting the spread of SE on farms. In 1992, USDA,<br />
in collaboration with the industry, academia, and the Pennsylvania Department of Agriculture<br />
(PDA), initiated a flock-based intervention program, the Pennsylvania Pilot<br />
Project (6 ), which evolved in 1994 into the current Pennsylvania Egg Quality Assurance<br />
Program (PEQAP). USDA provided oversight <strong>for</strong> PEQAP until June 30, 1996,<br />
when the program was transferred to PDA and the industry. This prevention program<br />
uses many of the on-farm microbiologic testing and control procedures developed in<br />
the pilot project to reduce SE contamination of eggs. The decrease in SE infections in<br />
the Northeast may reflect the collaborative prevention ef<strong>for</strong>ts in that region; similar<br />
ef<strong>for</strong>ts may be necessary to control the problem elsewhere in the country.<br />
References<br />
1. Hennessy TW, Hedberg CW, Slutsker L, et al. A national outbreak of Salmonella enteritidis<br />
infections from ice cream. N Engl J Med 1996; 334:1281–6.<br />
2. St Louis ME, Morse DL, Potter ME, et al. The emergence of grade A eggs as a major source<br />
of Salmonella enteritidis infections: new implications <strong>for</strong> the control of salmonellosis. JAMA<br />
1988; 259:2103–7.<br />
3. Hedberg CW, David MJ, White KE, MacDonald KL, Osterholm MT. Role of egg consumption<br />
in sporadic Salmonella enteritidis and Salmonella typhimurium infections in Minnesota.<br />
J Infect Dis 1993;167:107–11.<br />
4. Mishu B, Koehler J, Lee LA, et al. Outbreaks of Salmonella enteritidis infections in the United<br />
States, 1985–1991. J Infect Dis 1994;169:547–52.<br />
5. Food and Drug Administration. Food code: 1995 recommendations of the United States Public<br />
Health Service. Washington, DC: US Department of Health and Human Services, Public Health<br />
Service, Food and Drug Administration, 1995.<br />
6. Animal and Plant Inspection Service, US Department of Agriculture. Salmonella Enteritidis Pilot<br />
Project progress report. Washington, DC: US Department of Agriculture, 1995.<br />
Notice to Readers<br />
Final 1995 Reports of Notifiable <strong>Disease</strong>s<br />
Notice The notifiable to Readers diseases <strong>—</strong> Continued tables on pages 749–754 summarize final data <strong>for</strong> 1995.<br />
These data, final as of July 26, 1996, will be published in more detail in the MMWR<br />
Summary of Notifiable <strong>Disease</strong>s, United States, 1995 (1 ). Data in this summary were<br />
derived primarily from reports transmitted to CDC through the National Electronic<br />
Telecommunications System <strong>for</strong> Surveillance (NETSS). There were no reported cases<br />
of anthrax, diphtheria, and yellow fever in the United States during 1995; thus, these<br />
three nationally notifiable diseases do not appear in these tables.<br />
Population estimates <strong>for</strong> the states are from the July 1, 1995, estimates by the U.S.<br />
Bureau of the Census, Population Division, Population Branch, press release CB96-10.<br />
Population estimates <strong>for</strong> territories are from the 1990 census, U.S. Bureau of the Census,<br />
press releases CB91-142, 242, 243, 263, and 276.<br />
Reference<br />
1. CDC. Summary of notifiable diseases, United States, 1995. MMWR 1995;45(in press).<br />
Notice to Readers <strong>—</strong> Continued
Vol. 45 / No. 34 MMWR 743<br />
FIGURE I. Selected notifiable disease reports, comparison of 4-week totals ending<br />
August 24, 1996, with historical data <strong>—</strong> United States<br />
DISEASE DECREASE INCREASE<br />
Hepatitis A<br />
Hepatitis B<br />
Hepatitis, C/Non-A, Non-B<br />
Legionellosis<br />
Malaria<br />
Measles, Total<br />
Meningococcal Infections<br />
Mumps<br />
Pertussis<br />
Rabies, Animal<br />
Rubella<br />
0.25<br />
0.5<br />
AAAAAA<br />
AAAAAA<br />
AAAAAA<br />
TABLE I. Summary <strong>—</strong> cases of selected notifiable diseases, United States,<br />
cumulative, week ending August 24, 1996 (34th Week)<br />
Cum. 1996<br />
Ratio (Log Scale) *<br />
Beyond Historical Limits<br />
CASES CURRENT<br />
4 WEEKS<br />
Cum. 1996<br />
Anthrax - HIV infection, pediatric* § 170<br />
Brucellosis 57 Plague -<br />
Cholera 2 Poliomyelitis, paralytic -<br />
Congenital rubella syndrome 1 Psittacosis 25<br />
Cryptosporidiosis* 1,164 Rabies, human -<br />
Diphtheria 1 Rocky Mountain spotted fever (RMSF) 433<br />
Encephalitis: Cali<strong>for</strong>nia* 24 Streptococcal toxic-shock syndrome* 10<br />
eastern equine* 2 Syphilis, congenital** -<br />
St. Louis* - Tetanus 18<br />
western equine* - Toxic-shock syndrome 92<br />
Hansen <strong>Disease</strong> 69 Trichinosis 13<br />
Hantavirus pulmonary syndrome* † 9 Typhoid fever 208<br />
-: no reported cases<br />
*Not notifiable in all states.<br />
† Updated weekly from reports to the Division of Viral and Rickettsial <strong>Disease</strong>s, National Center <strong>for</strong> Infectious <strong>Disease</strong>s (NCID).<br />
§ Updated monthly to the Division of HIV/AIDS Prevention, National Center <strong>for</strong> HIV, STD, and TB Prevention (NCHSTP), last<br />
update July 30, 1996.<br />
Three suspected case of polio with onset in 1996 has been reported to date.<br />
**Updated quarterly from reports to the Division of STD Prevention, NCHSTP.<br />
1<br />
AAAAA<br />
AAAAA<br />
AAAAA<br />
AAAAA<br />
AAAAA<br />
2<br />
4<br />
1,422<br />
*Ratio of current 4-week total to mean of 15 4-week totals (from previous, comparable, and<br />
subsequent 4-week periods <strong>for</strong> the past 5 years). The point where the hatched area begins is<br />
based on the mean and two standard deviations of these 4-week totals.<br />
485<br />
172<br />
83<br />
149<br />
94<br />
135<br />
34<br />
585<br />
579<br />
7
744 MMWR August 30, 1996<br />
TABLE II. Cases of selected notifiable diseases, United States, weeks ending<br />
August 24, 1996, and August 26, 1995 (34th Week)<br />
Reporting Area<br />
Cum.<br />
1996<br />
AIDS* Chlamydia<br />
Cum.<br />
1995<br />
Cum.<br />
1996<br />
Escherichia<br />
coli O157:H7<br />
NETSS † PHLIS §<br />
Cum. Cum.<br />
1996 1996<br />
Gonorrhea<br />
Hepatitis<br />
C/NA,NB Legionellosis<br />
UNITED STATES 39,982 45,902 214,804 1,409 669 182,944 253,359 2,196 2,576 516 775<br />
NEW ENGLAND 1,589 2,205 11,121 205 48 4,673 4,901 76 83 29 18<br />
Maine 29 75 594 16 - 33 58 - - 2 5<br />
N.H. 50 70 397 24 24 80 72 6 12 1 1<br />
Vt. 14 21 - 14 14 38 34 28 8 3 -<br />
Mass. 740 998 4,306 98 10 1,413 1,752 36 59 15 10<br />
R.I. 113 165 1,299 10 - 334 325 6 4 8 2<br />
Conn. 643 876 4,525 43 - 2,775 2,660 - - N N<br />
MID. ATLANTIC 11,159 12,421 27,478 118 34 20,427 29,232 187 296 113 129<br />
Upstate N.Y. 1,378 1,609 N 79 12 4,017 6,105 152 146 44 33<br />
N.Y. City 6,277 6,550 12,837 7 - 6,455 11,525 1 1 5 3<br />
N.J. 2,130 2,870 2,777 32 5 3,185 3,110 - 121 8 19<br />
Pa. 1,374 1,392 11,864 N 17 6,770 8,492 34 28 56 74<br />
E.N. CENTRAL 3,225 3,513 28,101 351 154 27,514 50,704 304 207 138 228<br />
Ohio 696 723 12,840 89 44 9,341 16,215 24 7 58 107<br />
Ind. 433 337 6,692 48 26 4,330 5,843 7 1 31 52<br />
Ill. 1,397 1,511 2,982 153 16 11,146 12,746 47 62 9 22<br />
Mich. 528 712 U 61 48 U 11,560 226 137 31 21<br />
Wis. 171 230 5,587 N 20 2,697 4,340 - - 9 26<br />
W.N. CENTRAL 935 1,071 14,211 296 175 7,365 13,112 87 56 29 51<br />
Minn. 170 242 - 116 105 U 1,890 1 2 3 -<br />
Iowa 63 55 2,631 75 50 668 930 40 10 7 17<br />
Mo. 469 473 8,109 43 - 5,315 7,476 27 17 6 13<br />
N. Dak. 10 4 2 9 7 - 18 - 4 - 3<br />
S. Dak. 8 11 704 12 - 101 136 - 1 2 -<br />
Nebr. 65 75 903 15 3 181 773 5 12 9 11<br />
Kans. 150 211 2,765 26 10 1,281 1,889 14 10 2 7<br />
S. ATLANTIC 9,735 11,571 35,227 76 40 63,042 69,853 165 163 90 122<br />
Del. 193 219 1,148 - 1 952 1,414 1 - 8 2<br />
Md. 1,149 1,614 4,217 N 6 8,831 7,929 1 6 17 22<br />
D.C. 638 697 N - - 2,982 2,850 - - 8 4<br />
Va. 647 932 7,094 N 19 6,029 7,111 9 9 13 16<br />
W. Va. 73 63 1 N 2 335 470 8 40 1 3<br />
N.C. 539 712 - 23 9 12,363 15,818 33 41 7 25<br />
S.C. 500 612 - 6 3 7,010 7,953 21 15 4 21<br />
Ga. 1,421 1,461 7,626 22 - 12,708 12,856 U 15 3 14<br />
Fla. 4,575 5,261 15,141 16 - 11,832 13,452 92 37 29 15<br />
E.S. CENTRAL 1,311 1,500 19,263 36 29 20,528 26,534 401 721 33 45<br />
Ky. 212 182 4,200 7 4 2,607 3,055 20 23 3 8<br />
Tenn. 497 606 8,678 17 22 7,505 8,974 306 696 16 21<br />
Ala. 365 410 5,487 8 3 8,809 10,988 4 2 3 6<br />
Miss. 237 302 U 4 - 1,607 3,517 71 U 11 10<br />
W.S. CENTRAL 3,970 4,060 29,734 38 9 21,820 35,450 312 180 15 15<br />
Ark. 170 185 - 11 3 2,337 3,385 6 5 - 5<br />
La. 923 651 4,611 5 3 4,956 7,678 135 113 1 2<br />
Okla. 165 173 5,009 8 1 3,152 3,560 69 31 4 3<br />
Tex. 2,712 3,051 20,114 14 2 11,375 20,827 102 31 10 5<br />
MOUNTAIN 1,198 1,466 10,278 107 53 4,682 5,886 382 307 28 87<br />
Mont. 22 16 - 13 - 24 43 12 10 1 4<br />
Idaho 25 37 1,022 24 5 73 92 91 41 - 2<br />
Wyo. 3 10 378 - 2 21 37 124 121 3 8<br />
Colo. 335 493 - 41 24 1,077 1,888 35 46 7 33<br />
N. Mex. 114 123 2,633 6 - 564 678 44 37 1 4<br />
Ariz. 342 390 4,161 N 14 2,392 2,106 46 27 12 7<br />
Utah 117 98 993 13 - 199 154 21 10 2 12<br />
Nev. 240 299 1,091 10 8 332 888 9 15 2 17<br />
PACIFIC 6,859 8,095 38,488 182 127 12,712 17,687 282 563 41 80<br />
Wash. 447 662 6,177 54 42 1,342 1,705 39 144 5 18<br />
Oreg. 311 285 U 51 34 361 490 4 33 - -<br />
Calif. 5,964 6,913 27,251 74 43 10,484 14,645 104 367 32 57<br />
Alaska 16 53 743 3 2 275 449 2 1 1 -<br />
Hawaii 121 182 852 N 6 250 398 133 18 3 5<br />
Guam 4 - 168 N - 31 77 1 5 2 1<br />
P.R. 1,352 1,762 N 13 U 198 389 78 159 - -<br />
V.I. 16 27 N N U - - - - - -<br />
Amer. Samoa - - - N U - 18 - - - -<br />
C.N.M.I. 1 - N N U 11 39 - 5 - -<br />
N: Not notifiable U: Unavailable -: no reported cases C.N.M.I.: Commonwealth of Northern Mariana Islands<br />
*Updated monthly to the Division of HIV/AIDS Prevention, National Center <strong>for</strong> HIV, STD, and TB Prevention, last update July 30, 1996.<br />
† National Electronic Telecommunications System <strong>for</strong> Surveillance.<br />
§ Public Health Laboratory In<strong>for</strong>mation System.<br />
Cum.<br />
1996<br />
Cum.<br />
1995<br />
Cum.<br />
1996<br />
Cum.<br />
1995<br />
Cum.<br />
1996<br />
Cum.<br />
1995
Vol. 45 / No. 34 MMWR 745<br />
TABLE II. (Cont’d.) Cases of selected notifiable diseases, United States, weeks ending<br />
August 24, 1996, and August 26, 1995 (34th Week)<br />
Reporting Area<br />
Cum.<br />
1996<br />
Lyme<br />
<strong>Disease</strong> Malaria<br />
Cum.<br />
1995<br />
Cum.<br />
1996<br />
Cum.<br />
1995<br />
Meningococcal<br />
<strong>Disease</strong><br />
Cum.<br />
1996<br />
Syphilis<br />
(Primary & Secondary) Tuberculosis Rabies, Animal<br />
UNITED STATES 6,848 6,957 887 778 2,251 2,134 7,032 10,731 12,092 13,239 3,878 5,173<br />
NEW ENGLAND 2,228 1,377 35 34 96 99 110 251 263 327 463 1,044<br />
Maine 21 16 6 4 12 7 - 2 4 11 67 21<br />
N.H. 21 19 1 1 3 16 1 1 8 9 44 113<br />
Vt. 11 7 2 1 3 6 - - 1 2 110 128<br />
Mass. 168 81 12 10 36 35 51 43 131 183 75 328<br />
R.I. 304 225 6 3 10 4 1 2 24 29 32 211<br />
Conn. 1,703 1,029 8 15 32 31 57 203 95 93 135 243<br />
MID. ATLANTIC 3,967 4,554 215 213 201 277 281 559 2,212 2,816 475 1,343<br />
Upstate N.Y. 2,280 2,252 54 42 62 74 49 55 264 308 241 789<br />
N.Y. City 189 318 104 111 30 38 88 241 1,113 1,629 - -<br />
N.J. 509 1,237 44 45 53 70 77 120 463 485 90 243<br />
Pa. 989 747 13 15 56 95 67 143 372 394 144 311<br />
E.N. CENTRAL 45 300 93 109 306 304 879 1,868 1,270 1,276 60 63<br />
Ohio 29 21 9 7 118 89 318 616 194 182 8 6<br />
Ind. 15 12 12 14 48 44 146 209 113 114 5 11<br />
Ill. 1 13 35 58 79 80 296 720 718 662 15 9<br />
Mich. - 5 27 13 31 55 U 181 175 264 20 26<br />
Wis. U 249 10 17 30 36 119 142 70 54 12 11<br />
W.N. CENTRAL 105 69 35 18 187 127 222 529 315 394 372 252<br />
Minn. 39 5 16 3 25 22 27 29 74 95 19 11<br />
Iowa 16 7 2 2 37 23 13 34 43 46 176 90<br />
Mo. 22 36 8 6 79 47 165 447 134 147 16 25<br />
N. Dak. - - 1 1 3 1 - - 5 3 48 22<br />
S. Dak. - - - 1 9 5 - - 14 15 91 72<br />
Nebr. - 4 3 3 15 12 9 10 13 17 3 4<br />
Kans. 28 17 5 2 19 17 17 9 32 71 19 28<br />
S. ATLANTIC 316 450 188 149 461 347 2,498 2,691 2,248 2,347 1,792 1,393<br />
Del. 37 31 3 1 2 5 25 9 20 37 45 72<br />
Md. 160 300 48 40 48 30 412 292 199 266 416 284<br />
D.C. 3 2 7 13 10 4 104 75 88 67 8 11<br />
Va. 28 37 30 35 41 46 289 421 178 167 376 267<br />
W. Va. 10 18 3 1 11 8 1 8 41 53 70 82<br />
N.C. 55 41 19 13 60 58 698 754 330 274 462 326<br />
S.C. 3 9 9 - 45 44 265 380 230 212 59 96<br />
Ga. 1 9 16 16 115 68 449 513 427 436 205 185<br />
Fla. 19 3 53 30 129 84 255 239 735 835 151 70<br />
E.S. CENTRAL 44 44 20 13 128 139 1,534 2,179 877 922 136 189<br />
Ky. 9 11 3 1 20 36 87 122 160 193 33 20<br />
Tenn. 16 18 10 5 16 49 562 565 285 297 45 66<br />
Ala. 6 6 3 5 52 29 375 431 280 269 56 98<br />
Miss. 13 9 4 2 40 25 510 1,061 152 163 2 5<br />
W.S. CENTRAL 76 78 21 17 259 257 1,076 2,126 1,501 1,700 263 526<br />
Ark. 21 6 - 2 29 26 113 324 121 146 14 33<br />
La. 1 4 3 2 46 39 358 684 59 166 13 24<br />
Okla. 7 31 - 1 23 27 128 127 125 129 19 28<br />
Tex. 47 37 18 12 161 165 477 991 1,196 1,259 U 441<br />
MOUNTAIN 6 7 38 42 127 158 99 151 389 416 93 98<br />
Mont. - - 6 3 4 2 - 4 14 10 15 33<br />
Idaho - - - 1 19 7 4 - 6 8 - -<br />
Wyo. 2 3 3 - 3 6 2 - 6 1 21 21<br />
Colo. - - 16 18 25 40 23 86 53 38 26 -<br />
N. Mex. 1 1 2 4 21 29 1 5 53 56 3 3<br />
Ariz. - - 5 7 33 47 63 24 159 206 22 28<br />
Utah 2 1 4 5 12 13 2 4 39 19 3 9<br />
Nev. 1 2 2 4 10 14 4 28 59 78 3 4<br />
PACIFIC 61 78 242 183 486 426 324 377 3,017 3,041 224 265<br />
Wash. 11 7 16 15 74 71 4 10 155 178 - 6<br />
Oreg. 9 12 15 11 84 75 10 18 64 80 - 1<br />
Calif. 40 59 201 146 320 270 309 348 2,646 2,617 216 251<br />
Alaska - - 3 1 5 6 - 1 43 48 8 7<br />
Hawaii 1 - 7 10 3 4 1 - 109 118 - -<br />
Guam - - - 1 1 2 3 8 35 78 - -<br />
P.R. - - - 1 5 18 95 185 63 120 31 34<br />
V.I. - - - 2 - - - - - - - -<br />
Amer. Samoa - - - - - - - - - 3 - -<br />
C.N.M.I. - - - 1 - - 1 2 - 24 - -<br />
N: Not notifiable U: Unavailable -: no reported cases<br />
Cum.<br />
1995<br />
Cum.<br />
1996<br />
Cum.<br />
1995<br />
Cum.<br />
1996<br />
Cum.<br />
1995<br />
Cum.<br />
1996<br />
Cum.<br />
1995
746 MMWR August 30, 1996<br />
TABLE III. Cases of selected notifiable diseases preventable by vaccination,<br />
United States, weeks ending August 24, 1996, and August 26, 1995 (34th Week)<br />
Reporting Area<br />
H. influenzae,<br />
invasive<br />
Cum.<br />
1996*<br />
Cum.<br />
1995<br />
Cum.<br />
1996<br />
Hepatitis (viral), by type Measles (Rubeola)<br />
A B Indigenous Imported †<br />
Cum. Cum. Cum.<br />
Cum.<br />
Cum.<br />
1995 1996 1995 1996 1996 1996 1996<br />
UNITED STATES 782 780 17,264 18,474 6,085 6,494 5 377 2 36<br />
NEW ENGLAND 20 31 220 175 115 158 2 8 - 6<br />
Maine - 3 13 19 2 7 - - - -<br />
N.H. 8 7 10 8 9 16 U - U -<br />
Vt. 1 2 4 4 10 2 - 1 - 1<br />
Mass. 10 10 122 71 39 57 2 6 - 5<br />
R.I. 1 3 9 20 8 8 - - - -<br />
Conn. - 6 62 53 47 68 U 1 U -<br />
MID. ATLANTIC 124 111 1,017 1,142 907 924 - 20 - 5<br />
Upstate N.Y. 38 29 276 268 235 253 - - - -<br />
N.Y. City 23 26 393 569 419 296 - 9 - 3<br />
N.J. 38 13 206 150 157 234 - - - -<br />
Pa. 25 43 142 155 96 141 - 11 - 2<br />
E.N. CENTRAL 119 133 1,472 2,150 651 738 - 5 - 4<br />
Ohio 72 68 561 1,208 86 79 - 2 - -<br />
Ind. 7 17 221 116 110 141 - - - -<br />
Ill. 28 30 307 440 158 194 - 2 - 1<br />
Mich. 7 16 281 250 253 272 - - - 3<br />
Wis. 5 2 102 136 44 52 - 1 - -<br />
W.N. CENTRAL 36 55 1,395 1,284 281 437 - 17 - 2<br />
Minn. 22 28 86 126 38 36 - 14 - 2<br />
Iowa 5 3 249 61 62 33 - - - -<br />
Mo. 5 17 669 918 135 314 - 2 - -<br />
N. Dak. - - 35 19 1 4 - - - -<br />
S. Dak. 1 1 40 37 3 2 - - - -<br />
Nebr. 1 3 135 33 18 21 - - - -<br />
Kans. 2 3 181 90 24 27 - 1 - -<br />
S. ATLANTIC 182 154 816 741 958 851 - 6 1 8<br />
Del. 2 - 11 8 6 6 - 1 - -<br />
Md. 46 54 133 140 203 171 - 2 1 2<br />
D.C. 5 - 22 18 27 15 - - - -<br />
Va. 6 21 108 131 96 75 - - - 2<br />
W. Va. 6 6 12 16 17 35 - - - -<br />
N.C. 22 24 99 77 231 194 - 3 - 1<br />
S.C. 4 1 42 31 54 33 - - - -<br />
Ga. 73 43 87 50 8 62 - - - 2<br />
Fla. 18 5 302 270 316 260 - - - 1<br />
E.S. CENTRAL 21 8 954 1,191 521 594 - - - -<br />
Ky. 4 2 20 33 36 51 - - - -<br />
Tenn. 8 - 649 993 298 467 - - - -<br />
Ala. 8 5 130 59 41 76 - - - -<br />
Miss. 1 1 155 106 146 - U - U -<br />
W.S. CENTRAL 32 49 3,605 2,308 817 777 1 25 - 2<br />
Ark. - 5 338 333 51 39 - - - -<br />
La. 3 1 106 74 77 134 - - - -<br />
Okla. 26 20 1,500 601 59 104 - - - -<br />
Tex. 3 23 1,661 1,300 630 500 1 25 - 2<br />
MOUNTAIN 78 86 2,763 2,750 700 562 2 150 - 5<br />
Mont. - - 81 72 7 19 - - - -<br />
Idaho 1 2 150 237 69 68 - 1 - -<br />
Wyo. 35 5 26 83 30 17 1 1 - -<br />
Colo. 11 11 294 344 88 82 - 4 - 3<br />
N. Mex. 9 12 277 571 233 210 1 14 - -<br />
Ariz. 9 21 1,129 798 173 85 - 8 - -<br />
Utah 7 9 640 498 69 46 - 117 - 2<br />
Nev. 6 26 166 147 31 35 - 5 - -<br />
PACIFIC 170 153 5,022 6,733 1,135 1,453 - 146 1 4<br />
Wash. 2 8 328 539 63 122 - 45 - -<br />
Oreg. 22 21 584 1,730 45 88 - 4 - -<br />
Calif. 143 120 4,028 4,321 1,010 1,221 - 33 - 2<br />
Alaska 1 - 31 28 9 10 - 63 - -<br />
Hawaii 2 4 51 115 8 12 - 1 1 2<br />
Guam - - 2 6 - 4 U - U -<br />
P.R. 1 3 72 69 254 413 - 6 - -<br />
V.I. - - - 6 - 12 U - U -<br />
Amer. Samoa - - - 5 - - U - U -<br />
C.N.M.I. 10 11 1 22 5 12 U - U -<br />
N: Not notifiable U: Unavailable -: no reported cases<br />
*Of 182 cases among children aged
Vol. 45 / No. 34 MMWR 747<br />
TABLE III. (Cont’d.) Cases of selected notifiable diseases preventable by vaccination,<br />
United States, weeks ending August 24, 1996, and August 26, 1995 (34th Week)<br />
Reporting Area<br />
Measles (Rubeola), cont’d.<br />
Total<br />
Cum. Cum.<br />
1996 1995 1996<br />
Mumps Pertussis Rubella<br />
Cum.<br />
1996<br />
Cum.<br />
1995 1996<br />
UNITED STATES 413 262 4 420 574 198 2,649 2,390 1 189 104<br />
NEW ENGLAND 14 8 - - 11 29 529 320 - 24 44<br />
Maine - - - - 4 - 18 19 - - -<br />
N.H. - - U - 1 U 44 23 U - 1<br />
Vt. 2 - - - - 2 26 48 - 2 -<br />
Mass. 11 2 - - 2 19 428 216 - 20 7<br />
R.I. - 5 - - 1 8 8 1 - - -<br />
Conn. 1 1 U - 3 U 5 13 U 2 36<br />
MID. ATLANTIC 25 12 - 57 87 9 197 197 - 8 12<br />
Upstate N.Y. - 1 - 18 22 9 108 93 - 4 3<br />
N.Y. City 12 5 - 13 11 - 22 27 - 2 7<br />
N.J. - 6 - 2 13 - 5 14 - 2 2<br />
Pa. 13 - - 24 41 - 62 63 - - -<br />
E.N. CENTRAL 9 14 2 77 96 19 271 282 - 3 3<br />
Ohio 2 1 - 33 29 9 133 82 - - -<br />
Ind. - - 1 6 7 5 26 18 - - -<br />
Ill. 3 2 - 18 29 3 81 54 - 1 -<br />
Mich. 3 5 1 19 31 2 26 51 - 2 3<br />
Wis. 1 6 - 1 - - 5 77 - - -<br />
W.N. CENTRAL 19 2 - 9 34 31 165 128 - 1 -<br />
Minn. 16 - - 3 2 30 128 42 - - -<br />
Iowa - - - 1 8 1 5 6 - 1 -<br />
Mo. 2 1 - 2 20 - 20 39 - - -<br />
N. Dak. - - - 2 - - 1 6 - - -<br />
S. Dak. - - - - - - 3 8 - - -<br />
Nebr. - - - - 4 - 4 8 - - -<br />
Kans. 1 1 - 1 - - 4 19 - - -<br />
S. ATLANTIC 14 11 - 73 85 7 328 179 - 91 9<br />
Del. 1 - - - - - 11 9 - - -<br />
Md. 4 1 - 20 27 3 125 26 - - 1<br />
D.C. - - - - - - - 4 - 1 -<br />
Va. 2 - - 10 16 - 26 10 - 2 -<br />
W. Va. - - - - - - 2 - - - -<br />
N.C. 4 - - 17 16 2 57 81 - 77 1<br />
S.C. - - - 5 7 1 24 16 - 1 -<br />
Ga. 2 2 - 2 6 1 17 13 - - -<br />
Fla. 1 8 - 19 13 - 66 20 - 10 7<br />
E.S. CENTRAL - - - 19 7 - 63 198 - 2 1<br />
Ky. - - - - - - 26 15 - - -<br />
Tenn. - - - 1 - - 17 150 - - 1<br />
Ala. - - - 3 4 - 12 32 - 2 -<br />
Miss. - - U 15 3 U 8 1 N N N<br />
W.S. CENTRAL 27 21 - 18 39 6 69 193 - 2 7<br />
Ark. - 2 - - 6 - 4 29 - - -<br />
La. - 18 - 11 8 - 6 11 - 1 -<br />
Okla. - - - - - - 8 19 - - -<br />
Tex. 27 1 - 7 25 6 51 134 - 1 7<br />
MOUNTAIN 155 68 - 22 25 15 263 436 - 6 4<br />
Mont. - - - - 1 3 15 3 - - -<br />
Idaho 1 - - - 2 6 91 85 - 2 -<br />
Wyo. 1 - - - - - 3 1 - - -<br />
Colo. 7 26 - 2 - 3 67 64 - 2 -<br />
N. Mex. 14 31 N N N 3 39 69 - - -<br />
Ariz. 8 10 - 1 2 - 15 149 - 1 3<br />
Utah 119 - - 2 11 - 11 18 - - 1<br />
Nev. 5 1 - 17 9 - 22 47 - 1 -<br />
PACIFIC 150 126 2 145 190 82 764 457 1 52 24<br />
Wash. 45 19 - 18 10 50 287 113 1 2 1<br />
Oreg. 4 1 - - - - 29 30 - 1 -<br />
Calif. 35 104 2 105 162 29 428 276 - 46 18<br />
Alaska 63 - - 2 12 - 2 - - - -<br />
Hawaii 3 2 - 20 6 3 18 38 - 3 5<br />
Guam - - U 5 3 U 1 2 U - 1<br />
P.R. 6 3 - 1 2 - 1 1 - - -<br />
V.I. - - U - 3 U - - U - -<br />
Amer. Samoa - - U - - U - - U - -<br />
C.N.M.I. - - U - - U - - U - -<br />
N: Not notifiable U: Unavailable -: no reported cases<br />
Cum.<br />
1996<br />
Cum.<br />
1995 1996<br />
Cum.<br />
1996<br />
Cum.<br />
1995
748 MMWR August 30, 1996<br />
Reporting Area<br />
All<br />
Ages<br />
TABLE IV. Deaths in 121 U.S. cities,* week ending<br />
August 24, 1996 (34th Week)<br />
All Causes, By Age (Years)<br />
>65 45-64 25-44 1-24 65 45-64 25-44 1-24
Vol. 45 / No. 34 MMWR 749<br />
NOTIFIABLE DISEASES <strong>—</strong> Reported cases, by geographic division and area,<br />
United States, 1995<br />
Area<br />
Total resident<br />
Botulism<br />
population<br />
(in thousands) AIDS* Foodborne Brucellosis Chancroid †<br />
Infant<br />
United States 262,755 71,547 24 54 98 606<br />
New England 13,312 3,608 1 – 1 7<br />
Maine 1,241 130 – – – –<br />
N.H. 1,148 112 – – – –<br />
Vt. 585 44 – – – –<br />
Mass. 6,074 1,447 1 – – 7<br />
R.I. 990 223 – – – –<br />
Conn. 3,275 1,652 – – 1 –<br />
Mid. Atlantic 38,153 19,185 – 16 2 340<br />
N.Y. (excl. NYC) 10,824 2,364 – 1 – 2<br />
N.Y.C. 7,312 10,035 – – 1 334<br />
N.J. 7,945 4,409 – 7 – 4<br />
Pa. 12,072 2,377 – 8 1 –<br />
E.N. Central 43,456 5,410 – 5 12 29<br />
Ohio 11,151 1,110 – 2 – 5<br />
Ind. 5,803 529 – – – –<br />
Ill. 11,830 2,220 – – 8 21<br />
Mich. 9,549 1,201 – 1 3 –<br />
Wis. 5,123 350 – 2 1 3<br />
W.N. Central 18,348 1,734 1 – 4 2<br />
Minn. 4,610 369 – – 2 –<br />
Iowa 2,842 116 – – 2 –<br />
Mo. 5,324 791 – – – –<br />
N. Dak. 641 5 – – – –<br />
S. Dak. 729 19 – – – –<br />
Nebr. 1,637 114 – – – –<br />
Kans. 2,565 320 1 – – 2<br />
S. Atlantic 46,995 17,983 1 4 9 47<br />
Del. 717 316 – 1 – –<br />
Md. 5,042 2,575 – 1 2 –<br />
D.C. 554 1,029 – – – –<br />
Va. 6,618 1,610 1 2 – 2<br />
W. Va. 1,828 127 – – – 1<br />
N.C. 7,195 1,000 – – 3 18<br />
S.C. 3,673 976 – – 1 –<br />
Ga. 7,201 2,291 – – 1 2<br />
Fla. 14,166 8,059 – – 2 24<br />
E.S. Central 16,066 2,279 – 1 3 9<br />
Ky. 3,860 298 – 1 – –<br />
Tenn. 5,256 897 – – – 2<br />
Ala. 4,253 642 – – – 7<br />
Miss. 2,697 442 – – 3 –<br />
W.S. Central 28,828 6,136 – 1 24 156<br />
Ark. 2,484 277 – – 4 1<br />
La. 4,342 1,087 – 1 – 129<br />
Okla. 3,278 295 – – 1 –<br />
Tex. 18,724 4,477 – – 19 26<br />
Mountain 15,645 2,263 7 2 13 4<br />
Mont. 870 25 – – 1 –<br />
Idaho 1,163 49 4 – – –<br />
Wyo. 480 17 – – 2 –<br />
Colo. 3,747 673 1 – 1 –<br />
N. Mex. 1,685 164 – – 4 –<br />
Ariz. 4,218 678 2 – 5 2<br />
Utah 1,951 164 – 2 – –<br />
Nev. 1,530 493 – – – 2<br />
Pacific 41,951 12,813 14 25 30 12<br />
Wash. 5,431 892 6 – – 5<br />
Oreg. 3,141 459 – – 1 –<br />
Calif. 31,589 11,134 3 23 29 7<br />
Alaska 604 69 5 – – –<br />
Hawaii 1,187 259 – 2 – –<br />
Guam 133 – – – – –<br />
P.R. 3,522 2,594 – – – 1<br />
V.I. 102 39 – – – 2<br />
C.N.M.I. 43 – – – – NA<br />
American Samoa 47 – NA NA NA NA<br />
*Totals reported to Division of HIV/AIDS Prevention, National Center <strong>for</strong> HIV, STD, and TB Prevention<br />
(NCHSTP), through December 31, 1995. Total includes 136 cases with unknown state of residence.<br />
† Cases updated through Division of Sexually Transmitted <strong>Disease</strong>s Prevention, NCHSTP,<br />
as of March 1, 1996.<br />
NA: Not Available
750 MMWR August 30, 1996<br />
NOTIFIABLE DISEASES <strong>—</strong> Reported cases, by geographic division and area,<br />
United States, 1995 (continued)<br />
Area Chlamydia* Cholera<br />
Escherichia coli O157:H7<br />
NETSS Gonorrhea*<br />
Haemophilus<br />
influenzae,<br />
invasive<br />
United States 477,638 23 2,139 1,531 392,848 1,180<br />
New England 18,248 – 243 139 7,539 46<br />
Maine 1,144 – 65 – 94 3<br />
N.H. 898 – NA 21 118 13<br />
Vt. 462 – 20 22 69 2<br />
Mass. 7,402 – 118 96 2,658 16<br />
R.I. 1,902 – 3 – 545 5<br />
Conn. 6,440 – 37 – 4,055 7<br />
Mid. Atlantic 53,703 4 242 209 44,813 177<br />
N.Y. (excl. NYC) NN 1 169 114 9,493 45<br />
N.Y.C. 26,686 1 7 – 16,499 36<br />
N.J. 4,056 1 66 51 5,783 32<br />
Pa. 22,961 1 NN 44 13,038 64<br />
E.N. Central 93,492 2 372 358 77,547 190<br />
Ohio 29,124 – 107 59 23,176 99<br />
Ind. 9,102 1 64 42 8,880 22<br />
Ill. 24,645 1 126 90 21,747 48<br />
Mich. 21,666 – 75 49 18,220 18<br />
Wis. 8,955 – NN 118 5,524 3<br />
W.N. Central 34,055 1 415 278 20,106 94<br />
Minn. 6,032 1 199 186 2,852 56<br />
Iowa 5,089 – 66 52 1,723 3<br />
Mo. 12,110 – 48 – 11,326 28<br />
N. Dak. 1,324 – 8 8 38 –<br />
S. Dak. 1,313 – 23 12 237 1<br />
Nebr. 2,873 – 42 – 1,133 3<br />
Kans. 5,314 – 29 20 2,797 3<br />
S. Atlantic 85,575 2 135 83 110,052 236<br />
Del. 2,701 1 5 2 2,201 –<br />
Md. 8,740 – NN 8 12,984 74<br />
D.C. 1,665 – – – 5,687 –<br />
Va. 12,285 – NN 32 10,340 28<br />
W. Va. 2,326 – NN 3 860 11<br />
N.C. 15,780 – 45 29 23,961 34<br />
S.C. 8,591 – 10 5 12,120 3<br />
Ga. 11,193 – 29 – 21,025 71<br />
Fla. 22,294 1 46 4 20,874 15<br />
E.S. Central 24,158 – 38 38 42,837 12<br />
Ky. 6,904 – 19 15 4,751 5<br />
Tenn. 13,154 – NN 23 13,892 –<br />
Ala. 3,188 – 16 – 14,683 6<br />
Miss. 912 – 3 – 9,511 1<br />
W.S. Central 59,483 2 69 18 50,800 80<br />
Ark. 680 – 15 7 5,630 6<br />
La. 9,111 – NN 3 9,292 1<br />
Okla. 5,065 – 16 8 5,077 31<br />
Tex. 44,627 2 38 – 30,801 42<br />
Mountain 29,361 3 278 122 9,509 122<br />
Mont. 1,198 – 60 – 65 1<br />
Idaho 1,739 – 63 35 149 6<br />
Wyo. 703 – NN 7 51 11<br />
Colo. 6,650 1 93 37 2,803 16<br />
N. Mex. 4,285 1 10 5 1,054 16<br />
Ariz. 10,061 1 NN 26 3,844 30<br />
Utah 1,676 – 29 – 306 12<br />
Nev. 3,049 – 23 12 1,237 30<br />
Pacific 79,563 9 347 286 29,645 223<br />
Wash. 9,462 – 140 132 2,765 11<br />
Oreg. 5,465 – 89 61 854 28<br />
Calif. 62,501 9 118 77 24,803 178<br />
Alaska NN – NN 1 660 2<br />
Hawaii 2,135 – NN 15 563 4<br />
Guam 461 – 1 – 90 –<br />
P.R. 2,305 – 43 NA 618 3<br />
V.I. 17 – – NA 31 –<br />
C.N.M.I. NA 9 NN – NA 11<br />
†<br />
PHLIS §<br />
American Samoa NA NA NA NA NA NA<br />
*Cases updated through Division of Sexually Transmitted <strong>Disease</strong>s Prevention, NCHSTP,<br />
as of March 1, 1996.<br />
† National Electronic Telecommunications System <strong>for</strong> Surveillance.<br />
§ Public Health Laboratory In<strong>for</strong>mation System.<br />
NA: Not Available<br />
NN: Not Notifiable
Vol. 45 / No. 34 MMWR 751<br />
NOTIFIABLE DISEASES <strong>—</strong> Reported cases, by geographic division and area,<br />
United States, 1995 (continued)<br />
Area<br />
Hansen<br />
Hepatitis<br />
disease<br />
C/non-A, Legionel-<br />
Lyme<br />
(leprosy) A B non-B<br />
losis<br />
disease<br />
Malaria<br />
United States 144 31,582 10,805 4,576 1,241 11,700 1,419<br />
New England 7 333 252 142 41 2,164 52<br />
Maine – 30 12 – 6 45 7<br />
N.H. – 13 23 14 2 28 2<br />
Vt. – 8 7 14 2 9 1<br />
Mass. 7 161 114 106 24 189 21<br />
R.I. – 35 10 8 7 345 4<br />
Conn. – 86 86 – NN 1,548 17<br />
Mid. Atlantic 14 2,091 1,599 590 226 7,703 402<br />
N.Y. (excl. NYC) 1 523 414 341 65 3,983 75<br />
N.Y.C. 12 1,008 524 1 6 455 222<br />
N.J. 1 312 368 189 33 1,703 73<br />
Pa. – 248 293 59 122 1,562 32<br />
E.N. Central 3 3,160 1,130 358 341 441 160<br />
Ohio 1 1,760 116 15 151 30 13<br />
Ind. 1 189 241 14 81 19 20<br />
Ill. 1 663 293 86 36 18 78<br />
Mich. – 364 398 243 35 5 26<br />
Wis. – 184 82 – 38 369 23<br />
W.N. Central 2 1,992 675 91 121 306 36<br />
Minn. – 198 93 4 49 208 12<br />
Iowa – 107 46 15 21 16 3<br />
Mo. 1 1,338 437 23 19 53 9<br />
N. Dak. – 23 5 7 3 – 2<br />
S. Dak. – 99 2 1 3 – 2<br />
Nebr. 1 65 39 23 18 6 4<br />
Kans. – 162 53 18 8 23 4<br />
S. Atlantic 4 1,434 1,599 316 199 726 277<br />
Del. – 12 9 – 2 56 1<br />
Md. 2 221 262 7 29 454 63<br />
D.C. – 26 21 – 5 3 16<br />
Va. – 238 118 21 28 55 55<br />
W. Va. – 24 53 44 4 26 4<br />
N.C. – 111 311 64 34 84 20<br />
S.C. 1 46 56 21 30 17 3<br />
Ga. – 84 103 28 19 14 41<br />
Fla. 1 672 666 131 48 17 74<br />
E.S. Central – 2,312 830 1,020 56 73 27<br />
Ky. – 44 69 34 10 16 3<br />
Tenn. – 1,951 647 983 26 28 10<br />
Ala. – 93 114 3 8 12 11<br />
Miss. – 224 NA NA 12 17 3<br />
W.S. Central 38 5,287 1,712 631 32 160 100<br />
Ark. 1 663 83 8 8 11 3<br />
La. 1 196 243 222 3 9 7<br />
Okla. – 1,427 173 54 8 63 1<br />
Tex. 36 3,001 1,213 347 13 77 89<br />
Mountain – 4,346 879 519 116 13 66<br />
Mont. – 173 24 18 4 – 3<br />
Idaho – 353 102 58 3 – 2<br />
Wyo. – 110 33 223 12 4 1<br />
Colo. – 509 138 69 42 – 26<br />
N. Mex. – 808 321 53 6 1 7<br />
Ariz. – 1,363 121 59 13 1 15<br />
Utah – 696 75 13 16 1 6<br />
Nev. – 334 65 26 20 6 6<br />
Pacific 76 10,627 2,129 909 109 114 299<br />
Wash. 3 937 226 234 22 10 23<br />
Oreg. 1 2,723 129 37 – 20 21<br />
Calif. 52 6,751 1,729 511 82 84 238<br />
Alaska 1 50 13 3 – – 5<br />
Hawaii 19 166 32 124 5 – 12<br />
Guam 7 10 5 6 1 – 2<br />
P.R. – 120 689 216 – – 1<br />
V.I. – 9 16 – – – 2<br />
C.N.M.I. 6 24 22 5 – – 1<br />
American Samoa NA NA NA NA NA NA NA<br />
NA: Not Available<br />
NN: Not Notifiable
752 MMWR August 30, 1996<br />
NOTIFIABLE DISEASES <strong>—</strong> Reported cases, by geographic division and area,<br />
United States, 1995 (continued)<br />
Measles<br />
Area Indigenous Imported*<br />
Meningococcal<br />
disease Mumps Pertussis Plague<br />
Poliomyelitis,<br />
paralytic †<br />
United States 281 28 3,243 906 5,137 9 2<br />
New England 10 3 165 13 731 – –<br />
Maine – – 17 4 47 – –<br />
N.H. – – 29 1 70 – –<br />
Vt. – – 11 – 81 – –<br />
Mass. 3 2 51 3 492 – –<br />
R.I. 6 – 7 1 7 – –<br />
Conn. 1 1 50 4 34 – –<br />
Mid. Atlantic 9 5 372 134 469 – 1<br />
N.Y. (excl. NYC) 1 – 106 33 253 – –<br />
N.Y.C. 2 3 54 17 67 – –<br />
N.J. 6 2 74 21 20 – –<br />
Pa. – – 138 63 129 – 1<br />
E.N. Central 11 4 419 172 667 – –<br />
Ohio 1 1 115 54 175 – –<br />
Ind. – – 65 10 76 – –<br />
Ill. – 2 110 48 155 – –<br />
Mich. 4 1 75 60 103 – –<br />
Wis. 6 – 54 – 158 – –<br />
W.N. Central 12 – 201 52 369 – 1<br />
Minn. 9 – 31 11 238 – –<br />
Iowa – – 31 11 11 – –<br />
Mo. 2 – 76 25 63 – –<br />
N. Dak. – – 2 1 8 – 1<br />
S. Dak. – – 11 – 12 – –<br />
Nebr. – – 22 4 14 – –<br />
Kans. 1 – 28 – 23 – –<br />
S. Atlantic 14 5 601 163 388 – –<br />
Del. – – 6 – 10 – –<br />
Md. – 1 42 41 49 – –<br />
D.C. – – 8 – 8 – –<br />
Va. – – 64 28 31 – –<br />
W. Va. – – 10 – 1 – –<br />
N.C. – – 86 42 137 – –<br />
S.C. – – 59 13 28 – –<br />
Ga. 4 – 124 11 30 – –<br />
Fla. 10 4 202 28 94 – –<br />
E.S. Central – – 244 20 277 – –<br />
Ky. – – 51 – 27 – –<br />
Tenn. – – 106 5 209 – –<br />
Ala. – – 49 5 38 NN –<br />
Miss. – – 38 10 3 – –<br />
W.S. Central 31 3 404 66 342 – –<br />
Ark. 2 – 39 7 59 – –<br />
La. 17 1 63 15 22 – –<br />
Okla. – – 49 1 44 – –<br />
Tex. 12 2 253 43 217 – –<br />
Mountain 68 2 218 33 743 5 –<br />
Mont. – – 4 1 9 – –<br />
Idaho 1 1 21 4 116 – –<br />
Wyo. – – 8 – 1 – –<br />
Colo. 26 – 49 3 149 – –<br />
N. Mex. 30 1 36 NN 148 4 –<br />
Ariz. 10 – 63 2 164 1 –<br />
Utah – – 18 11 37 – –<br />
Nev. 1 – 19 12 119 – –<br />
Pacific 126 6 619 253 1,151 4 –<br />
Wash. 20 – 126 16 491 – –<br />
Oreg. – 1 117 NN 67 1 –<br />
Calif. 106 3 356 211 531 3 –<br />
Alaska – – 15 12 1 – –<br />
Hawaii – 2 5 14 61 – –<br />
Guam – – 3 4 2 – –<br />
P.R. 3 – 24 3 3 – –<br />
V.I. – – – 3 – – –<br />
C.N.M.I. – – – 1 – – –<br />
American Samoa NA NA NA NA NA NA NA<br />
*Imported cases include only those resulting from importation from other countries.<br />
† Seven suspected cases of paralytic poliomyelitis were reported in 1995. Confirmation of these cases is<br />
pending review by external panel.<br />
NA: Not Available<br />
NN: Not Notifiable
Vol. 45 / No. 34 MMWR 753<br />
NOTIFIABLE DISEASES <strong>—</strong> Reported cases, by geographic division and area,<br />
United States, 1995 (continued)<br />
Psitta-<br />
Rabies<br />
Rubella<br />
Cong.<br />
Area cosis Animal Human RMSF* Rubella syndrome<br />
Salmonellosis<br />
Shigellosis<br />
United States 64 7,811 5 590 128 6 45,970 32,080<br />
New England 1 1,512 1 2 52 – 3,355 664<br />
Maine 1 101 – – – – 183 25<br />
N.H. – 152 – – 1 – 188 71<br />
Vt. – 179 – – – – 102 11<br />
Mass. – 401 – 1 11 – 1,862 324<br />
R.I. – 317 – – – – 221 70<br />
Conn. – 362 1 1 40 – 799 163<br />
Mid. Atlantic 12 1,923 – 43 16 1 8,157 3,531<br />
N.Y. (excl. NYC) 5 1,157 – 12 5 – 1,912 985<br />
N.Y.C. – – – 6 8 1 2,159 845<br />
N.J. 1 326 – 15 3 – 1,734 1,038<br />
Pa. 6 440 – 10 – – 2,352 663<br />
E.N. Central 8 113 – 37 4 – 6,203 3,299<br />
Ohio 1 12 – 17 – – 1,545 598<br />
Ind. 2 24 – 9 – – 701 411<br />
Ill. – 16 – 10 – – 2,087 1,539<br />
Mich. 2 43 – 1 4 – 950 487<br />
Wis. 3 18 – – – – 920 264<br />
W.N. Central – 396 – 41 1 1 2,602 2,560<br />
Minn. – 37 – – – – 737 197<br />
Iowa – 141 – – – – 433 350<br />
Mo. – 30 – 30 – 1 577 1,138<br />
N. Dak. – 32 – – – – 83 146<br />
S. Dak. – 105 – 1 – – 108 200<br />
Nebr. – 5 – 6 – – 301 227<br />
Kans. – 46 – 4 1 – 363 302<br />
S. Atlantic 15 2,254 1 280 14 – 9,961 5,895<br />
Del. – 96 – 3 – – 208 247<br />
Md. 2 439 – 36 1 – 1,215 639<br />
D.C. – 11 – – – – 154 197<br />
Va. 1 459 – 34 – – 1,358 412<br />
W. Va. – 116 – 4 – – 169 59<br />
N.C. 3 466 – 150 1 – 1,176 1,006<br />
S.C. 3 125 – 37 – – 633 251<br />
Ga. 5 294 – 9 – – 1,662 1,358<br />
Fla. 1 248 1 7 12 – 3,386 1,726<br />
E.S. Central 1 285 – 83 1 – 2,022 1,575<br />
Ky. – 28 – 16 – – 433 332<br />
Tenn. 1 98 – 32 1 – 454 400<br />
Ala. – 150 – 3 – – 581 510<br />
Miss. – 9 – 32 NN – 554 333<br />
W.S. Central – 728 – 86 8 – 3,743 3,932<br />
Ark. – 52 – 31 – – 338 176<br />
La. – 54 – 2 – – 590 485<br />
Okla. – 32 – 47 – – 452 254<br />
Tex. – 590 – 6 8 – 2,363 3,017<br />
Mountain 4 192 – 16 5 – 2,198 4,538<br />
Mont. – 46 – 5 – – 103 286<br />
Idaho – 3 – – – – 85 124<br />
Wyo. – 32 – 5 – – 37 15<br />
Colo. 2 16 – 5 1 – 594 528<br />
N. Mex. – 6 – – – – 342 1,089<br />
Ariz. – 57 – – 3 – 519 1,610<br />
Utah 1 15 – 1 1 – 280 764<br />
Nev. 1 17 – – – – 238 122<br />
Pacific 23 408 3 2 27 4 7,729 6,086<br />
Wash. 7 15 1 1 1 – 691 425<br />
Oreg. 3 4 – 1 – – 344 168<br />
Calif. 13 382 2 – 21 4 6,343 5,371<br />
Alaska – 7 – NN – – 48 20<br />
Hawaii – – – – 5 – 303 102<br />
Guam – – – – 1 – 40 19<br />
P.R. – 39 – – – – 770 57<br />
V.I. – – – – – – 9 6<br />
C.N.M.I. – – – – – – 42 41<br />
American Samoa NA NA NA NA NA NA NA NA<br />
*Rocky Mountain spotted fever. NA: Not Available<br />
NN: Not Notifiable
754 MMWR August 30, 1996<br />
NOTIFIABLE DISEASES <strong>—</strong> Reported cases, by geographic division and area,<br />
United States, 1995 (continued)<br />
Area<br />
Primary &<br />
secondary<br />
Syphilis*<br />
Cong.<br />
(
Vol. 45 / No. 34 MMWR 755<br />
Contributors to the Production of the MMWR (Weekly)<br />
Weekly Notifiable <strong>Disease</strong> Morbidity Data and 121 Cities Mortality Data<br />
Denise Koo, M.D., M.P.H.<br />
Deborah A. Adams<br />
Timothy M. Copeland<br />
Patsy A. Hall<br />
Carol M. Knowles<br />
Sarah H. Landis<br />
Myra A. Montalbano<br />
Desktop Publishing and Graphics Support<br />
Jolene W. Altman<br />
Morie M. Higgins<br />
Peter M. Jenkins
756 MMWR August 30, 1996<br />
The Morbidity and Mortality Weekly Report (MMWR) Series is prepared by the <strong>Centers</strong> <strong>for</strong> <strong>Disease</strong> Control<br />
and Prevention (CDC) and is available free of charge in electronic <strong>for</strong>mat and on a paid subscription basis<br />
<strong>for</strong> paper copy. To receive an electronic copy on Friday of each week, send an e-mail message to<br />
lists@list.cdc.gov. The body content should read subscribe mmwr-toc. Electronic copy also is available<br />
from CDC’s World-Wide Web server at http://www.cdc.gov/ or from CDC’s file transfer protocol server at<br />
ftp.cdc.gov. To subscribe <strong>for</strong> paper copy, contact Superintendent of Documents, U.S. Government Printing<br />
Office, Washington, DC 20402; telephone (202) 512-1800.<br />
Data in the weekly MMWR are provisional, based on weekly reports to CDC by state health departments.<br />
The reporting week concludes at close of business on Friday; compiled data on a national basis are officially<br />
released to the public on the following Friday. Address inquiries about the MMWR Series, including material<br />
to be considered <strong>for</strong> publication, to: Editor, MMWR Series, Mailstop C-08, CDC, 1600 Clifton Rd., N.E., Atlanta,<br />
GA 30333; telephone (404) 332-4555.<br />
All material in the MMWR Series is in the public domain and may be used and reprinted without<br />
permission; citation as to source, however, is appreciated.<br />
Director, <strong>Centers</strong> <strong>for</strong> <strong>Disease</strong> Control<br />
Acting Editor, MMWR (weekly)<br />
and Prevention<br />
Nancy C. Lee, M.D.<br />
David Satcher, M.D., Ph.D.<br />
Managing Editor, MMWR (weekly)<br />
Deputy Director, <strong>Centers</strong> <strong>for</strong> <strong>Disease</strong> Control<br />
Karen L. Foster, M.A.<br />
and Prevention<br />
Writers-Editors, MMWR (weekly)<br />
Claire V. Broome, M.D.<br />
David C. Johnson<br />
Director, Epidemiology Program Office<br />
Darlene D. Rumph Person<br />
Stephen B. Thacker, M.D., M.Sc.<br />
Caran R. Wilbanks<br />
Editor, MMWR Series<br />
Editorial Assistant, MMWR (weekly)<br />
Richard A. Goodman, M.D., M.P.H.<br />
Teresa F. Rutledge<br />
✩U.S. Government Printing Office: 1996-733-175/47023 Region IV