Ecology and management of white-tailed deer in - Florida Fish and ...
Ecology and management of white-tailed deer in - Florida Fish and ...
Ecology and management of white-tailed deer in - Florida Fish and ...

Create successful ePaper yourself
Turn your PDF publications into a flip-book with our unique Google optimized e-Paper software.
considered essential <strong>and</strong> the most economically practical method <strong>of</strong> sound <strong>management</strong> for<br />
<strong>white</strong>-<strong>tailed</strong> <strong>deer</strong>.<br />
Elements <strong>of</strong> Population Dynamics<br />
Successful <strong>management</strong> <strong>of</strong> a <strong>deer</strong> herd requires a basic underst<strong>and</strong><strong>in</strong>g <strong>of</strong> the factors<br />
that <strong>in</strong>fluence population changes. Deer populations are constantly chang<strong>in</strong>g as new<br />
<strong>in</strong>dividuals replace older animals. The elements <strong>of</strong> population dynamics <strong>in</strong>clude<br />
reproduction, mortality, immigration, <strong>and</strong> emigration. Although obta<strong>in</strong><strong>in</strong>g accurate<br />
reproductive <strong>and</strong> mortality rates (particularly mortality due to natural causes) can be<br />
difficult, managers can use a variety <strong>of</strong> techniques to detect changes <strong>in</strong> the size <strong>and</strong> health<br />
<strong>of</strong> the population. Estimates <strong>of</strong> population size, sex ratio, <strong>and</strong> age distribution are<br />
population descriptors that provide valuable <strong>in</strong>formation for managers.<br />
Population Growth Curve<br />
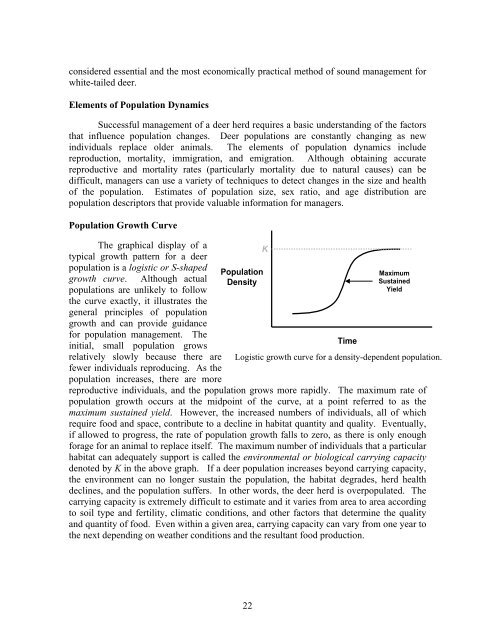
The graphical display <strong>of</strong> a<br />
typical growth pattern for a <strong>deer</strong><br />
population is a logistic or S-shaped<br />
growth curve. Although actual<br />
populations are unlikely to follow<br />
the curve exactly, it illustrates the<br />
general pr<strong>in</strong>ciples <strong>of</strong> population<br />
growth <strong>and</strong> can provide guidance<br />
for population <strong>management</strong>. The<br />
<strong>in</strong>itial, small population grows<br />
relatively slowly because there are<br />
fewer <strong>in</strong>dividuals reproduc<strong>in</strong>g. As the<br />
population <strong>in</strong>creases, there are more<br />
Population<br />
Density<br />
22<br />
K<br />
Time<br />
Maximum<br />
Susta<strong>in</strong>ed<br />
Yield<br />
Logistic growth curve for a density-dependent population.<br />
reproductive <strong>in</strong>dividuals, <strong>and</strong> the population grows more rapidly. The maximum rate <strong>of</strong><br />
population growth occurs at the midpo<strong>in</strong>t <strong>of</strong> the curve, at a po<strong>in</strong>t referred to as the<br />
maximum susta<strong>in</strong>ed yield. However, the <strong>in</strong>creased numbers <strong>of</strong> <strong>in</strong>dividuals, all <strong>of</strong> which<br />
require food <strong>and</strong> space, contribute to a decl<strong>in</strong>e <strong>in</strong> habitat quantity <strong>and</strong> quality. Eventually,<br />
if allowed to progress, the rate <strong>of</strong> population growth falls to zero, as there is only enough<br />
forage for an animal to replace itself. The maximum number <strong>of</strong> <strong>in</strong>dividuals that a particular<br />
habitat can adequately support is called the environmental or biological carry<strong>in</strong>g capacity<br />
denoted by K <strong>in</strong> the above graph. If a <strong>deer</strong> population <strong>in</strong>creases beyond carry<strong>in</strong>g capacity,<br />
the environment can no longer susta<strong>in</strong> the population, the habitat degrades, herd health<br />
decl<strong>in</strong>es, <strong>and</strong> the population suffers. In other words, the <strong>deer</strong> herd is overpopulated. The<br />
carry<strong>in</strong>g capacity is extremely difficult to estimate <strong>and</strong> it varies from area to area accord<strong>in</strong>g<br />
to soil type <strong>and</strong> fertility, climatic conditions, <strong>and</strong> other factors that determ<strong>in</strong>e the quality<br />
<strong>and</strong> quantity <strong>of</strong> food. Even with<strong>in</strong> a given area, carry<strong>in</strong>g capacity can vary from one year to<br />
the next depend<strong>in</strong>g on weather conditions <strong>and</strong> the resultant food production.