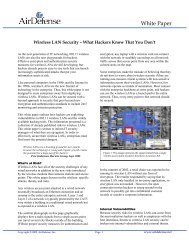
3.5.3 Show (plot) Fitted Signal Decay Displays (plots) a semi-logarithmic plot of the calculated (shown in red) versus fitted (shown in blue) signal decays (see Figure 8). There is normally good agreement between these two decays down to -9 (more than 1000-fold attenuation). Figure 8 Typical semilog plot of calculated versus fitted signal decay. 20
Chapter 4 2D-<strong>DOSY</strong> <strong>Experiments</strong> 4.1 Setting up basic 2D-<strong>DOSY</strong> experiments The current <strong>DOSY</strong> package includes four basic 2D-<strong>DOSY</strong> sequences: Dbppste, DgcsteSL, Doneshot and Dbppsteinept. To set up any of those experiments start with recording a normal s2pul spectrum on the nucleus to be observed, followed by calibrating (or checking) pulse widths if necessary. It is a good idea to reduce the spectral window to the region of interest as well as define integral regions for future baseline correction before selecting the requested experiment from the menu or calling the setup macro from the command line (which always has the same name as the pulse sequence itself). Each sequence has a parameter called delflag. By setting it to 'y', the actual <strong>DOSY</strong> sequence is activated (default value), the 'n' option allows going back to the basic s2pul (Dbppste, DgcsteSL, Doneshot) or INEPT (Dbppsteinept) sequence without changing the experiment workspace or the parameter set. All sequences use a common set of parameters to define the duration of the diffusion gradient length (gt1, the total defocusing time), the diffusion gradient level (gzlvl1) and the diffusion delay (del). Choosing the values of <strong>DOSY</strong> parameters for a given sample involves determining the proper relationship among these three parameters. The best setting primarily depends on the sample itself (solvent, viscosity, molecular size and shape, the isotope to be detected) and on the experimental conditions (temperature, etc.). It is therefore recommended that the experimental parameters be optimized using the <strong>DOSY</strong> sample to be measured and the pulse sequence to be used. To get an approximate idea for these parameters, use the “Setup coarse gradient array” button in the Acquire/Pulse Sequence VnmrJ panel. Alternatively, use the command line to set gt1=0.002, del=0.05 s and to array the gradient strength: gzlvl1=500,5000,15000,20000,25000,gzlvl1_max for Performa II or IV gradient amplifiers, or gzlvl1=50,500,1000,1500,gzlvl1_max for Performa I gradient system. For the maximum gradient power used in the <strong>DOSY</strong> experiment, select the gzlvl1 value that attenuates the signal intensities to 5-15 % of the intensities obtained with the weakest gradient pulse. If the intensity drop is not sufficient at the end of the array, del or gt1 may be increased. If no signal is detected towards the end of the array, decrease del or gt1 and repeat the procedure again. Before the final setup the best baseline performance should be achieved. With the Varian-supplied sequences, alfa, rof2 and ddrtc delays should be set to (near) optimum by default. If, however, the spectra still need first order phase correction (lp 0), use the setlp0 macro to reach lp=0 and good baseline performance. After having determined suitable values for gt1, del and the maximum gradient power, the number of increments, the minimum and maximum gradient power can be set and a suitable gradient array be calculated by clicking on the “Setup <strong>DOSY</strong> using conditions above” button. The setup_dosy macro behind this button sets up a range of gzlvl1 values with their squares evenly spaced assuring that each gradient strength value will have the same weight when fitting the data to the Stejskal-Tanner formula. The minimum gradient strength may be set to 0.5-2 Gauss/cm. 21
- Page 1 and 2: High-Resolution Diffusion-Ordered S
- Page 3 and 4: Contents Chapter 1 DOSY VnmrJ 3.0 R
- Page 5 and 6: Chapter 1 DOSY VnmrJ 3.0 Release No
- Page 7 and 8: Chapter 2 High-resolution Diffusion
- Page 9 and 10: update_wrefshape Creates solvent su
- Page 11 and 12: NOTE: Changing the solvent of a DOS
- Page 13 and 14: The use of both expressions is requ
- Page 15 and 16: 3.2 Mapping the Gradient Shape The
- Page 17 and 18: Figure 1 The Acquire-Defaults and A
- Page 19 and 20: Figure 3 Set of profiles measured o
- Page 21: 3.5 Display and Plot Options The Pr
- Page 25 and 26: 4.2 Simple 2D DOSY Pulse Sequences
- Page 27 and 28: satfrq presaturation frequency satd
- Page 29 and 30: satfrq wet probe_ saturation freque
- Page 31 and 32: 4.3 DOSY pulse sequences for H2O sa
- Page 33 and 34: 4.3.2 Dbppste_wg - (DOSY Bipolar Pu
- Page 35 and 36: Representing convection by a crude
- Page 37 and 38: 4.4.1 Pulse Sequences with Convecti
- Page 39 and 40: 4.4.1.2. DgsteSL_cc (Gradient STimu
- Page 41 and 42: 4.4.1.3 DgcsteSL_cc (Gradient Compe
- Page 43 and 44: 4.4.1.4. Dpfgdste (Pulsed Field Gra
- Page 45 and 46: Nicotinic acid amide N O NH 2 Tempe
- Page 47 and 48: a b 1 G/cm D (m 2 /s*10 -10 ) 5 7 9
- Page 49 and 50: Figure 16 The VNMRJ FIDDLE panel fo
- Page 51 and 52: printed on the spectrum axis automa
- Page 53 and 54: Figure 17. The VNMRJ Acquire/Defaul
- Page 55 and 56: 5.2.2 Dgcstehmqc (DOSY Gradient Com
- Page 57 and 58: Processing Parameters: nugflag nugc
- Page 59 and 60: Chapter 6 Phase Sensitive 3D-DOSY E
- Page 61 and 62: nugcal_[1-5] a 5-membered parameter
- Page 63 and 64: dosy3Dproc 'y' - calls dosy with 3D
- Page 65 and 66: gstab optional delay for stability
- Page 67 and 68: lkgate_flg flag to gate the lock sa
- Page 69 and 70: dosy3Dproc 'y' - calls dosy with 3D
- Page 71 and 72: The integral regions have already b
- Page 73 and 74:
112d('readtext',file+'/112d_text')
- Page 75 and 76:
112d('reset') 112d 112d('adjust') 1
- Page 77 and 78:
edosy To show the D distribution al
- Page 79 and 80:
Now reprocess the data with NUG cor
- Page 81 and 82:
dosyproc=‘discrete’ ncomp=2 nug
- Page 83 and 84:
The same QGC Doneshot data set can
- Page 85 and 86:
F1 (D) 4 6 8 10 12 14 16 18 5.14 Fi
- Page 87 and 88:
F1 (D ) 4 6 8 10 12 14 16 18 20 22
- Page 89 and 90:
F1 (D ) 2 3 4 5 6 7 8 9 10 4.0 3.9
- Page 91 and 92:
Chapter 9 DOSY-Related Literature M
- Page 93 and 94:
Evans, C-L., Morris, G.A., Davis, A
- Page 95 and 96:
Nilsson, M. and Morris, G. A. Speed
- Page 97:
Liu, M., Tang, H. Nicholson, J.K.,