Oahu Wind Integration Study - Hawaii Natural Energy Institute ...
Oahu Wind Integration Study - Hawaii Natural Energy Institute ...
Oahu Wind Integration Study - Hawaii Natural Energy Institute ...
Create successful ePaper yourself
Turn your PDF publications into a flip-book with our unique Google optimized e-Paper software.
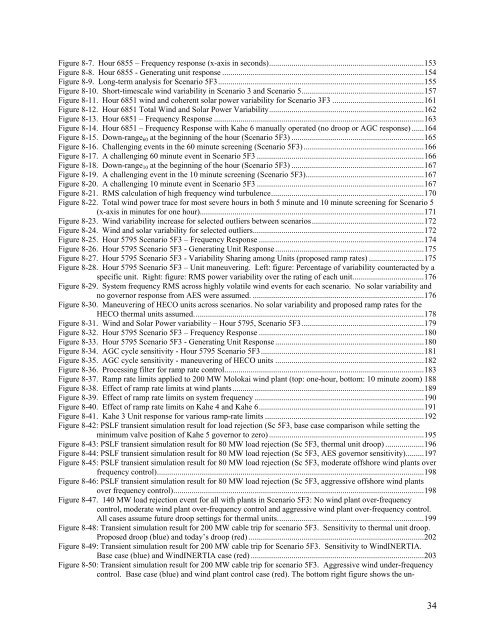
Figure 8-7. Hour 6855 – Frequency response (x-axis in seconds)............................................................................ 153<br />
Figure 8-8. Hour 6855 - Generating unit response ................................................................................................... 154<br />
Figure 8-9. Long-term analysis for Scenario 5F3..................................................................................................... 155<br />
Figure 8-10. Short-timescale wind variability in Scenario 3 and Scenario 5............................................................ 157<br />
Figure 8-11. Hour 6851 wind and coherent solar power variability for Scenario 3F3 ............................................. 161<br />
Figure 8-12. Hour 6851 Total <strong>Wind</strong> and Solar Power Variability............................................................................ 162<br />
Figure 8-13. Hour 6851 – Frequency Response ....................................................................................................... 163<br />
Figure 8-14. Hour 6851 – Frequency Response with Kahe 6 manually operated (no droop or AGC response) ...... 164<br />
Figure 8-15. Down-range60 at the beginning of the hour (Scenario 5F3) ................................................................. 165<br />
Figure 8-16. Challenging events in the 60 minute screening (Scenario 5F3) ........................................................... 166<br />
Figure 8-17. A challenging 60 minute event in Scenario 5F3 .................................................................................. 166<br />
Figure 8-18. Down-range10 at the beginning of the hour (Scenario 5F3) ................................................................. 167<br />
Figure 8-19. A challenging event in the 10 minute screening (Scenario 5F3).......................................................... 167<br />
Figure 8-20. A challenging 10 minute event in Scenario 5F3 .................................................................................. 167<br />
Figure 8-21. RMS calculation of high frequency wind turbulence........................................................................... 170<br />
Figure 8-22. Total wind power trace for most severe hours in both 5 minute and 10 minute screening for Scenario 5<br />
(x-axis in minutes for one hour).............................................................................................................. 171<br />
Figure 8-23. <strong>Wind</strong> variability increase for selected outliers between scenarios....................................................... 172<br />
Figure 8-24. <strong>Wind</strong> and solar variability for selected outliers.................................................................................... 172<br />
Figure 8-25. Hour 5795 Scenario 5F3 – Frequency Response ................................................................................. 174<br />
Figure 8-26. Hour 5795 Scenario 5F3 - Generating Unit Response......................................................................... 175<br />
Figure 8-27. Hour 5795 Scenario 5F3 - Variability Sharing among Units (proposed ramp rates) ........................... 175<br />
Figure 8-28. Hour 5795 Scenario 5F3 – Unit maneuvering. Left: figure: Percentage of variability counteracted by a<br />
specific unit. Right: figure: RMS power variability over the rating of each unit................................... 176<br />
Figure 8-29. System frequency RMS across highly volatile wind events for each scenario. No solar variability and<br />
no governor response from AES were assumed. .................................................................................... 176<br />
Figure 8-30. Maneuvering of HECO units across scenarios. No solar variability and proposed ramp rates for the<br />
HECO thermal units assumed................................................................................................................. 178<br />
Figure 8-31. <strong>Wind</strong> and Solar Power variability – Hour 5795, Scenario 5F3............................................................ 179<br />
Figure 8-32. Hour 5795 Scenario 5F3 – Frequency Response ................................................................................. 180<br />
Figure 8-33. Hour 5795 Scenario 5F3 - Generating Unit Response......................................................................... 180<br />
Figure 8-34. AGC cycle sensitivity - Hour 5795 Scenario 5F3................................................................................ 181<br />
Figure 8-35. AGC cycle sensitivity - maneuvering of HECO units ......................................................................... 182<br />
Figure 8-36. Processing filter for ramp rate control.................................................................................................. 183<br />
Figure 8-37. Ramp rate limits applied to 200 MW Molokai wind plant (top: one-hour, bottom: 10 minute zoom) 188<br />
Figure 8-38. Effect of ramp rate limits at wind plants.............................................................................................. 189<br />
Figure 8-39. Effect of ramp rate limits on system frequency ................................................................................... 190<br />
Figure 8-40. Effect of ramp rate limits on Kahe 4 and Kahe 6................................................................................. 191<br />
Figure 8-41. Kahe 3 Unit response for various ramp-rate limits .............................................................................. 192<br />
Figure 8-42: PSLF transient simulation result for load rejection (Sc 5F3, base case comparison while setting the<br />
minimum valve position of Kahe 5 governor to zero) ............................................................................ 195<br />
Figure 8-43: PSLF transient simulation result for 80 MW load rejection (Sc 5F3, thermal unit droop) ................... 196<br />
Figure 8-44: PSLF transient simulation result for 80 MW load rejection (Sc 5F3, AES governor sensitivity)......... 197<br />
Figure 8-45: PSLF transient simulation result for 80 MW load rejection (Sc 5F3, moderate offshore wind plants over<br />
frequency control)................................................................................................................................... 198<br />
Figure 8-46: PSLF transient simulation result for 80 MW load rejection (Sc 5F3, aggressive offshore wind plants<br />
over frequency control)........................................................................................................................... 198<br />
Figure 8-47. 140 MW load rejection event for all with plants in Scenario 5F3: No wind plant over-frequency<br />
control, moderate wind plant over-frequency control and aggressive wind plant over-frequency control.<br />
All cases assume future droop settings for thermal units........................................................................ 199<br />
Figure 8-48: Transient simulation result for 200 MW cable trip for scenario 5F3. Sensitivity to thermal unit droop.<br />
Proposed droop (blue) and today’s droop (red) ...................................................................................... 202<br />
Figure 8-49: Transient simulation result for 200 MW cable trip for Scenario 5F3. Sensitivity to <strong>Wind</strong>INERTIA.<br />
Base case (blue) and <strong>Wind</strong>INERTIA case (red) ..................................................................................... 203<br />
Figure 8-50: Transient simulation result for 200 MW cable trip for scenario 5F3. Aggressive wind under-frequency<br />
control. Base case (blue) and wind plant control case (red). The bottom right figure shows the un-<br />
34


