Sanitary Landfills: Toward Sustainable Development - lumes
Sanitary Landfills: Toward Sustainable Development - lumes
Sanitary Landfills: Toward Sustainable Development - lumes

You also want an ePaper? Increase the reach of your titles
YUMPU automatically turns print PDFs into web optimized ePapers that Google loves.
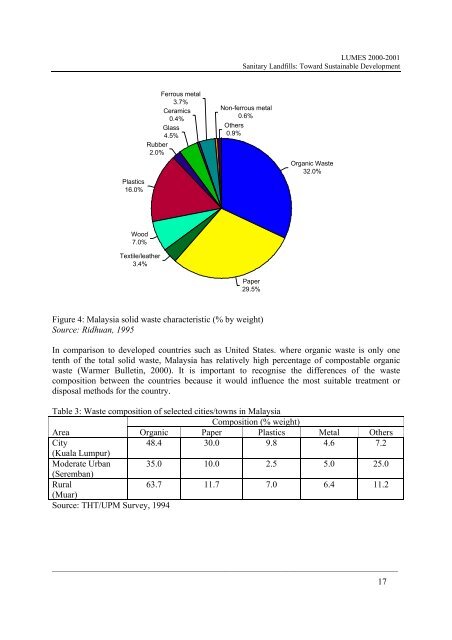
Plastics<br />
16.0%<br />
Wood<br />
7.0%<br />
Textile/leather<br />
3.4%<br />
Ferrous metal<br />
3.7%<br />
Ceramics<br />
0.4%<br />
Glass<br />
4.5%<br />
Rubber<br />
2.0%<br />
LUMES 2000-2001<br />
<strong>Sanitary</strong> <strong>Landfills</strong>: <strong>Toward</strong> <strong>Sustainable</strong> <strong>Development</strong><br />
Non-ferrous metal<br />
0.6%<br />
Others<br />
0.9%<br />
Paper<br />
29.5%<br />
Figure 4: Malaysia solid waste characteristic (% by weight)<br />
Source: Ridhuan, 1995<br />
Organic Waste<br />
32.0%<br />
In comparison to developed countries such as United States. where organic waste is only one<br />
tenth of the total solid waste, Malaysia has relatively high percentage of compostable organic<br />
waste (Warmer Bulletin, 2000). It is important to recognise the differences of the waste<br />
composition between the countries because it would influence the most suitable treatment or<br />
disposal methods for the country.<br />
Table 3: Waste composition of selected cities/towns in Malaysia<br />
Composition (% weight)<br />
Area Organic Paper Plastics Metal Others<br />
City<br />
(Kuala Lumpur)<br />
48.4 30.0 9.8 4.6 7.2<br />
Moderate Urban<br />
(Seremban)<br />
35.0 10.0 2.5 5.0 25.0<br />
Rural<br />
(Muar)<br />
63.7 11.7 7.0 6.4 11.2<br />
Source: THT/UPM Survey, 1994<br />
______________________________________________________________________________<br />
17