Introduction to Phylogenetic Analysis
Introduction to Phylogenetic Analysis
Introduction to Phylogenetic Analysis

You also want an ePaper? Increase the reach of your titles
YUMPU automatically turns print PDFs into web optimized ePapers that Google loves.
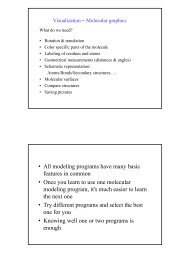
<strong>Introduction</strong> <strong>to</strong><br />
<strong>Phylogenetic</strong> <strong>Analysis</strong><br />
Irit Orr<br />
Taxonomy - is the science of<br />
classification of organisms.<br />
Phylogeny - is the evolution of a<br />
genetically related group of organisms.<br />
Or: a study of relationships between<br />
collection of "things" (genes, proteins,<br />
organs..) that are derived from a common<br />
ances<strong>to</strong>r.<br />
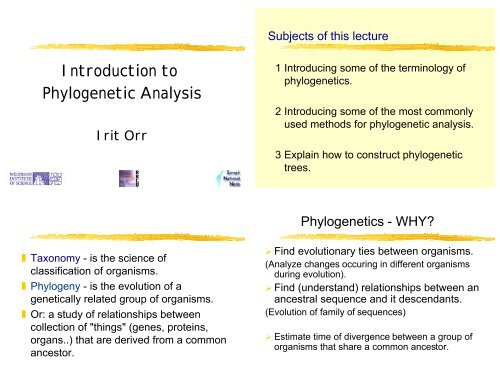
Subjects of this lecture<br />
1 Introducing some of the terminology of<br />
phylogenetics.<br />
2 Introducing some of the most commonly<br />
used methods for phylogenetic analysis.<br />
3 Explain how <strong>to</strong> construct phylogenetic<br />
trees.<br />
<strong>Phylogenetic</strong>s - WHY?<br />
Find evolutionary ties between organisms.<br />
(Analyze changes occuring in different organisms<br />
during evolution).<br />
Find (understand) relationships between an<br />
ancestral sequence and it descendants.<br />
(Evolution of family of sequences)<br />
Estimate time of divergence between a group of<br />
organisms that share a common ances<strong>to</strong>r.
Basic tree<br />
Of Life<br />
Eukaryote tree<br />
Similar sequences, common ances<strong>to</strong>r...<br />
... common ances<strong>to</strong>r, similar function<br />
Eubacteria tree<br />
From a common ances<strong>to</strong>r sequence, two<br />
DNA sequences are diverged.<br />
Each of these two sequences start <strong>to</strong><br />
accumulate nucleotide substitutions.<br />
The number of these mutations are used in<br />
molecular evolution analysis.
How we calculate the<br />
Degree of Divergence<br />
If two sequences of length N differ from<br />
each other at n sites, then their degree of<br />
divergence is:<br />
n/N or n/N*100%.<br />
Relationships of <strong>Phylogenetic</strong><br />
<strong>Analysis</strong> and Sequences <strong>Analysis</strong><br />
The progressive multiple alignment of a group of<br />
sequences, first aligns the most similar pair.<br />
Then it adds the more distant pairs.<br />
The alignment is influenced by the “most<br />
similar” pairs and arranged accordingly, but….it<br />
does not always correctly represent the<br />
evolutionary his<strong>to</strong>ry of the occured changes.<br />
Not all phylogenetic methods work this way.<br />
Relationships of <strong>Phylogenetic</strong><br />
<strong>Analysis</strong> and Sequences <strong>Analysis</strong><br />
When 2 sequences found in 2 organisms are<br />
very similar, we assume that they have derived<br />
from one ances<strong>to</strong>r.<br />
AAGAATC AAGAGTT<br />
AAGA(A/G)T(C/ T)<br />
The sequences alignment reveal which positions are<br />
conserved from the ances<strong>to</strong>r sequence.<br />
Relationships of <strong>Phylogenetic</strong><br />
<strong>Analysis</strong> and Sequences <strong>Analysis</strong><br />
Most phylogenetic methods assume that each<br />
position in a sequence can change<br />
independently from the other positions.<br />
Gaps in alignments represent mutations in<br />
sequences such as: insertion, deletion, genetic<br />
rearrangments.<br />
Gaps are treated in various ways by the<br />
phylogenetic methods. Most of them ignore<br />
gaps.
Relationships of <strong>Phylogenetic</strong><br />
<strong>Analysis</strong> and Sequences <strong>Analysis</strong><br />
Another approach <strong>to</strong> treat gaps is by using<br />
sequences similarity scores as the base<br />
for the phylogenetic analysis, instead of<br />
using the alignment itself, and trying <strong>to</strong><br />
decide what happened at each position.<br />
The similarity scores based on scoring<br />
matrices (with gaps scores) are used by<br />
the DISTANCE methods.<br />
What is a phylogenetic tree?<br />
E.G: 2 very similar sequences will be<br />
neighbors on the outer branches and will be<br />
connected by a common internal branch.<br />
Trees<br />
Only one path between<br />
any pair of nodes<br />
Types of Trees<br />
Networks<br />
More than one path<br />
between any pair of<br />
nodes<br />
What is a phylogenetic tree?<br />
An illustration of the evolutionary<br />
relationships among a group of organisms.<br />
Dendrogram is another name for a<br />
phylogenetic tree.<br />
A tree is composed of nodes and branches.<br />
One branch connects any two adjacent<br />
nodes. Nodes represent the taxonomic<br />
units. (sequences)<br />
Rooted <strong>Phylogenetic</strong> Tree<br />
2<br />
1<br />
*<br />
*<br />
3<br />
*<br />
seqA<br />
seqB<br />
seqC<br />
seqD<br />
Leaves = Outer branches<br />
Represent the taxa (sequences)<br />
Nodes = 1 2 3<br />
Represent the relationships<br />
Among the taxa (sequences)<br />
e.g Node 1 represent the ances<strong>to</strong>r<br />
seq from which seqA and seqB derived.<br />
Branches *<br />
The length of the branch represent<br />
the # of changes that occurred in the<br />
seqs prior <strong>to</strong> the next level of separation.
I<br />
H<br />
Internal branches - are<br />
branches that do not end<br />
with a tip.<br />
(IH,HF,HG)<br />
more ancient diversions<br />
In a phylogenetic tree...<br />
F<br />
External branches - are branches<br />
that end with a tip.<br />
(FA,FB,GC,GD,IE)<br />
A<br />
G<br />
E<br />
B<br />
more recent diversions<br />
NOTE: The amount of evolutionary time that<br />
passed from the separation of the 2 sequences<br />
is not known. The phylogenetic analysis can only<br />
estimate the # of changes that occurred from the<br />
time of separation.<br />
After the branching event, one taxon (sequence)<br />
can undergo more mutations then the other<br />
taxon.<br />
Topology of a tree is the branching pattern of a<br />
tree.<br />
D<br />
C<br />
In a phylogenetic tree...<br />
Each NODE represents a speciation event in<br />
evolution. Beyond this point any sequence<br />
changes that occurred are specific for each<br />
branch (specie).<br />
The BRANCH connects 2 NODES of the tree.<br />
The length of each BRANCH between one<br />
NODE <strong>to</strong> the next, represents the # of changes<br />
that occurred until the next separation<br />
(speciation).<br />
Tree structure<br />
♠Terminal nodes - represent the data (e.g<br />
sequences) under comparison<br />
(A,B,C,D,E), also known as OTUs,<br />
(Operational Taxonomic Units).<br />
♠Internal nodes - represent inferred<br />
ancestral units (usually without empirical<br />
data), also known as HTUs, (Hypothetical<br />
Taxonomic Units).
Slide taken from Dr. Itai Yanai<br />
2<br />
1<br />
Different kinds of trees can be used <strong>to</strong><br />
depict different aspects of evolutionary his<strong>to</strong>ry<br />
3<br />
3<br />
1<br />
1<br />
1 1 1 1<br />
3<br />
7<br />
2<br />
1<br />
1<br />
5<br />
3<br />
1. Cladogram:<br />
simply shows relative recency of common ancestry<br />
4<br />
3<br />
2. Additive trees:<br />
a cladogram with branch lengths,<br />
also called phylograms and metric trees<br />
3. Ultrametric trees:<br />
(dendograms) special kind of additive tree in which the<br />
tips of the trees are all equidistant from the root<br />
Rooted Tree = Cladogram<br />
A phylogenetic tree that<br />
all the "objects" on it<br />
share a known common<br />
ances<strong>to</strong>r (the root).<br />
There exists a particular<br />
root node.<br />
The paths from the root<br />
<strong>to</strong> the nodes<br />
correspond <strong>to</strong><br />
evolutionary time.<br />
Root<br />
A<br />
C<br />
B<br />
The Molecular Clock Hypothesis<br />
All the mutations occur in the same rate in all<br />
the tree branches.<br />
The rate of the mutations is the same for all<br />
positions along the sequence.<br />
The Molecular Clock Hypothesis is most suitable for<br />
closely related species.<br />
Unrooted Tree = Phenogram<br />
A phylogenetic tree where all<br />
the "objects" on it are related<br />
descendants - but there is<br />
not enough information <strong>to</strong><br />
specify the common<br />
ances<strong>to</strong>r (root).<br />
The path between nodes of<br />
the tree do not specify an<br />
evolutionary time.<br />
B
Slide taken from Dr. Itai Yanai<br />
Rooted vs. Unrooted<br />
Rooted<br />
Unrooted<br />
Interior<br />
Total<br />
Interior<br />
Total<br />
Types of Trees<br />
Branches<br />
M – 2<br />
2M – 2<br />
M – 3<br />
Nodes<br />
M – 1<br />
2M – 1<br />
M – 2<br />
2M – 3 2M – 2<br />
M is the number of OTU’s<br />
Slide taken from Dr. Itai Yanai<br />
The number of rooted and unrooted trees:<br />
Possible Number of<br />
Number<br />
of OTU’s Rooted trees Unrooted<br />
trees<br />
2 1 1<br />
3 3 1<br />
4 15 3<br />
5 105 15<br />
6 945 105<br />
7 10395 945<br />
8 135135 10395<br />
9 2027025 135135<br />
10 34459425 2027025<br />
OTU – Operational Taxonomical Unit<br />
Rooted versus Unrooted<br />
The number of tree <strong>to</strong>pologies of rooted<br />
tree is much higher than that of the<br />
unrooted tree for the same number of<br />
OTUs.<br />
Therefore, the error of the unrooted tree<br />
<strong>to</strong>pology is smaller than that of the rooted<br />
tree.<br />
Orthologs - genes related by speciation<br />
events. Meaning same genes in different<br />
species.<br />
Paralogs - genes related by duplication<br />
events. Meaning duplicated genes in the<br />
same species.
Selecting sequences for phylogenetic<br />
analysis<br />
What type of sequence <strong>to</strong> use, Protein or<br />
DNA?<br />
The rate of mutation is assumed <strong>to</strong> be the<br />
same in both coding and non-coding<br />
regions.<br />
However, there is a difference in the<br />
substitution rate.<br />
Known Problems of Multiple Alignments<br />
Important sites could be misaligned by the<br />
software used for the sequence alignment.<br />
That will effect the significance of the site -<br />
and the tree.<br />
For example: ATG as start codon, or specific<br />
amino acids in functional domains.<br />
Gaps - Are treated differently by different<br />
alignment programs and should play no<br />
part in building trees.<br />
Selecting sequences for phylogenetic<br />
analysis<br />
Non-coding DNA regions have more<br />
substitution than coding regions.<br />
Proteins are much more conserved since<br />
they "need" <strong>to</strong> conserve their function.<br />
So it is better <strong>to</strong> use sequences that<br />
mutate slowly (proteins) than DNA.<br />
However, if the genes are very small, or<br />
they mutate slowly, we can use them for<br />
building the trees.<br />
Alignment of a coding region should be compared with<br />
the alignment of their protein sequences, <strong>to</strong> be sure about<br />
the placement of gaps.<br />
T Y R R S R ACA TAC AGG CGA<br />
T Y R R<br />
T Y R R S R ACA TAC AGG CGA<br />
T Y R R<br />
T Y R - S R ACA TAC AGG ---<br />
T Y R -<br />
T Y R - S R ACA TAC --- CGA<br />
T Y - R<br />
T Y R R S R ACA TAC AGG CGA<br />
T Y R R
Known Problems of Multiple Alignments<br />
♥ Low complexity regions - effect the multiple<br />
alignment because they create random bias<br />
for various regions of the alignment.<br />
♥ Low complexity regions should be removed<br />
from the alignment before building the tree.<br />
If you delete these regions you need <strong>to</strong><br />
consider the affect of the deletions on the<br />
branch lengths of the whole tree.<br />
How <strong>to</strong> choose a phylogenetic method?<br />
Choose set of related seqs<br />
(DNA or Proteins<br />
Strong similarity<br />
Maximum Parsimony<br />
Check validity of the<br />
results<br />
Obtain MultipleAlignment<br />
Is there a strong similarity?<br />
Distant (weak) similarity<br />
Distance methods<br />
Very weak similarity<br />
Maximum Likelihood<br />
Selecting sequences for phylogenetic<br />
analysis<br />
‡ Sequences that are being compared belong<br />
<strong>to</strong>gether (orthologs).<br />
‡ If no ancestral sequence is available you may<br />
use an "outgroup" as a reference <strong>to</strong> measure<br />
distances. In such a case, for an outgroup you<br />
need <strong>to</strong> choose a close relative <strong>to</strong> the group<br />
being compared.<br />
‡ For example: if the group is of mammalian<br />
sequences then the outgroup should be a sequence<br />
from birds and not plants.<br />
Taken from Dr.Itai Yanai<br />
Given a multiple alignment, how do we construct the tree?<br />
A - GCTTGTCCGTTACGAT<br />
B – ACTTGTCTGTTACGAT<br />
C – ACTTGTCCGAAACGAT<br />
D - ACTTGACCGTTTCCTT<br />
E – AGATGACCGTTTCGAT<br />
F - ACTACACCCTTATGAG<br />
?
Building <strong>Phylogenetic</strong> Trees<br />
Main methods:<br />
Distances matrix methods<br />
Neighbour Joining, UPGMA<br />
Character based methods:<br />
Parsimony methods<br />
Maximum Likelihood method<br />
Validation method:<br />
Bootstrapping<br />
Jack Knife<br />
Statistical Methods<br />
The process is done at least 100 times.<br />
<strong>Phylogenetic</strong> trees are generated from all the<br />
sets.<br />
Part of the results will show the # of times a<br />
particular branch point occurred out of all the<br />
trees that were built.<br />
The higher the # - the more valid the<br />
branching point.<br />
Statistical Methods<br />
Bootstrapping <strong>Analysis</strong> –<br />
Is a method for testing how good a dataset fits a<br />
evolutionary model.<br />
This method can check the branch arrangement<br />
(<strong>to</strong>pology) of a phylogenetic tree.<br />
In Bootstrapping, the program re-samples<br />
columns in a multiple aligned group of<br />
sequences, and creates many new alignments,<br />
(with replacement the original dataset).<br />
These new sets represent the population.<br />
Taken from Dr. Itai Yanai<br />
Given the following tree, estimate the confidence of<br />
the two internal branches<br />
Chimpanzee<br />
Gorilla<br />
Human<br />
Gibbon<br />
Orang-utan
Taken from Dr. Itai Yanai<br />
Estimating Confidence from the Resamplings<br />
1. Of the 100 trees:<br />
41/100 28/100 31/100<br />
Chimpanzee Human<br />
Gorilla Human Chimpanzee Human<br />
Gorilla<br />
Gibbon<br />
Orang-utan<br />
Chimpanzee<br />
In 41 of the 100 trees,<br />
chimp and gorilla are<br />
41<br />
split from the rest.<br />
Gorilla<br />
100<br />
Gibbon<br />
Gibbon<br />
Chimpanzee<br />
Gorilla<br />
Orang-utan Orang-utan<br />
2. Upon the original tree we superimpose bootstrap values:<br />
Human<br />
Gibbon<br />
Orang-utan<br />
Character Based Methods<br />
In 100 of the 100 trees,<br />
gibbon and orang-utan<br />
are split from the rest.<br />
All Character Based Methods assume that<br />
each character substitution is independent<br />
of its neighbors.<br />
Maximum Parsimony (minimum evolution)<br />
- in this method one tree will be given<br />
(built) with the fewest changes required <strong>to</strong><br />
explain (tree) the differences observed in<br />
the data.<br />
Statistical Methods<br />
Bootstrap values between 90-100 are<br />
considered statistically significant<br />
Character Based Methods<br />
Q: How do you find the minimum # of changes<br />
needed <strong>to</strong> explain the data in a given tree?<br />
A: The answer will be <strong>to</strong> construct a set of possible<br />
ways <strong>to</strong> get from one set <strong>to</strong> the other, and choose<br />
the "best". (for example: Maximum Parsimony)<br />
CCGCCACGA<br />
P P R<br />
CGGCCACGA<br />
R P R
Character Based Methods - Maximum<br />
Parsimony<br />
∞ Not all sites are informative in parsimony.<br />
∞ Informative site, is a site that has at least 2<br />
characters, each appearing at least in 2 of<br />
the sequences of the dataset.<br />
Site 5: G<br />
Site 2:<br />
Site 3:<br />
Mouse<br />
G<br />
G<br />
Rat<br />
Mouse<br />
T C<br />
C<br />
Rat<br />
Mouse<br />
T T<br />
T<br />
Rat<br />
123456789012345678901<br />
Mouse CTTCGTTGGATCAGTTTGATA<br />
Rat CCTCGTTGGATCATTTTGATA<br />
Dog CTGCTTTGGATCAGTTTGAAC<br />
Human CCGCCTTGGATCAGTTTGAAC<br />
** *<br />
T<br />
C<br />
Dog<br />
T<br />
C<br />
Human<br />
Dog<br />
T<br />
G<br />
Human<br />
Dog<br />
T<br />
G<br />
Rat<br />
Dog<br />
T<br />
C C<br />
Human Rat<br />
Dog Dog<br />
G G G<br />
T<br />
Rat<br />
G<br />
C<br />
G<br />
Mouse<br />
G G<br />
C<br />
Human<br />
Mouse<br />
C T<br />
C<br />
Human<br />
Mouse<br />
G T<br />
G<br />
Human<br />
Mouse Rat<br />
G G G G<br />
T<br />
C<br />
Dog Human<br />
Mouse Rat<br />
T T C C<br />
T<br />
C<br />
Dog Human<br />
Mouse Rat<br />
T G G T<br />
G<br />
G<br />
Dog Human<br />
Taken from<br />
Dr. Itai Yanai<br />
Start by classifying the sites:<br />
Maximum Parsimony<br />
123456789012345678901<br />
Mouse CTTCGTTGGATCAGTTTGATA<br />
Rat CCTCGTTGGATCATTTTGATA<br />
Dog CTGCTTTGGATCAGTTTGAAC<br />
Human CCGCCTTGGATCAGTTTGAAC<br />
------------------------------------<br />
Invariant * * ******** *****<br />
Variant ** * * **<br />
------------------------------------<br />
Informative ** **<br />
Non-inform. * *<br />
Mouse<br />
Rat<br />
123456789012345678901<br />
Mouse CTTCGTTGGATCAGTTTGATA<br />
Rat CCTCGTTGGATCATTTTGATA<br />
Dog CTGCTTTGGATCAGTTTGAAC<br />
Human CCGCCTTGGATCAGTTTGAAC<br />
Informative ** **<br />
Dog<br />
Human<br />
Maximum Parsimony<br />
Dog<br />
Rat<br />
Mouse<br />
Human<br />
Mouse Rat<br />
Dog Human<br />
3 0 1<br />
Taken from<br />
Dr. Itai Yanai<br />
Taken from<br />
Dr. Itai Yanai
Character Based Methods - Maximum<br />
Parsimony<br />
∞ The Maximum Parsimony method is good for<br />
similar sequences, a sequences group with<br />
small amount of variations<br />
Maximum Parsimony methods do not give the<br />
branch lengths only the branch order.<br />
For larger set it is recommended <strong>to</strong> use<br />
the “branch and bound” method instead<br />
Of Maximum Parsimony.<br />
Character Based Methods -<br />
Maximum Likelihood<br />
Basic idea of Maximum Likelihood method is<br />
building a tree based on mathemaical model.<br />
This method find a tree based on probability<br />
calculations that best accounts for the large<br />
amount of variations of the data (sequences)<br />
set.<br />
Maximum Likelihood method (like the Maximum<br />
Parsimony method) performs its analysis on<br />
each position of the multiple alignment.<br />
This is why this method is very heavy on CPU.<br />
Maximum Parsimony Methods are<br />
Available…<br />
For DNA in Programs:<br />
paup, molphy,phylo_win<br />
In the Phylip package:<br />
DNAPars, DNAPenny, etc..<br />
For Protein in Programs:<br />
paup, molphy,phylo_win<br />
In the Phylip package:<br />
PROTPars<br />
Character Based Methods -<br />
Maximum Likelihood<br />
Maximum Likelihood method – using a tree<br />
model for nucleotide substitutions, it will try <strong>to</strong><br />
find the most likely tree (out of all the trees of<br />
the given dataset).<br />
The Maximum Likelihood methods are very slow<br />
and cpu consuming.<br />
Maximum Likelihood methods can be found in<br />
phylip, paup or puzzle.
Maximum Likelihood method<br />
Are available in the Programs:<br />
paup or puzzle<br />
In phylip package in programs:<br />
DNAML and DNAMLK<br />
Distances Matrix Methods<br />
Distance methods assume a molecular clock,<br />
meaning that all mutations are neutral and<br />
therefore they happen at a random clocklike<br />
rate.<br />
This assumption is not true for several reasons:<br />
Different environmental conditions affect mutation<br />
rates.<br />
This assumption ignores selection issues which are<br />
different with different time periods.<br />
Character Based Methods<br />
The Maximum Likelihood methods are<br />
very slow and cpu consuming (computer<br />
expensive).<br />
Maximum Likelihood methods can be<br />
found in phylip, paup or puzzle.<br />
Distances Matrix Methods<br />
Distance - the number of substitutions per site per<br />
time period.<br />
Evolutionary distance are calculated based on one<br />
of DNA evolutionary models.<br />
Neighbors – pairs of sequences that have the<br />
smallest number of substitutions between them.<br />
On a phylogenetic tree, neighbors are joined by a<br />
node (common ances<strong>to</strong>r).
Distances Matrix Methods<br />
Distance methods vary in the way they construct<br />
the trees.<br />
Distance methods try <strong>to</strong> place the correct<br />
positions of all the neighbors, and find the<br />
correct branches lengths.<br />
Distance based clustering methods:<br />
Neighbor-Joining (unrooted tree)<br />
UPGMA (rooted tree)<br />
Distance method steps<br />
Construction of a distance tree using clustering with the Unweighted<br />
Pair Group Method with Arithmatic Mean (UPGMA)<br />
A - GCTTGTCCGTTACGAT<br />
B – ACTTGTCTGTTACGAT<br />
C – ACTTGTCCGAAACGAT<br />
D - ACTTGACCGTTTCCTT<br />
E – AGATGACCGTTTCGAT<br />
F - ACTACACCCTTATGAG<br />
First, construct a distance matrix:<br />
A B C D E<br />
B 2<br />
C 4 4<br />
D 6 6 6<br />
E 6 6 6 4<br />
F 8 8 8 8 8<br />
From http://www.icp.ucl.ac.be/~opperd/private/upgma.html<br />
Distance method steps<br />
1 Multiple alignments - based on all against<br />
all pairwise comparisons.<br />
2 Building distance matrix of all the compared<br />
sequences (all pair of OTUs).<br />
3 Disregard of the actual sequences.<br />
4 Constructing a guide tree by clustering the<br />
distances. Iteratively build the relations<br />
(branches and internal nodes) between all<br />
OTUs.<br />
Distances Matrix Methods<br />
Distances matrix methods can be found in the<br />
following Programs:<br />
Clustalw, Phylo_win, Paup<br />
In the GCG software package:<br />
Paupsearch, distances<br />
In the Phylip package:<br />
DNADist, PROTDist, Fitch, Kitch, Neighbor
Mutations as data source for<br />
evolutionary analysis<br />
Mutation - an error in DNA replication or<br />
DNA repair.<br />
Only mutations that occur in germline<br />
cells play a rule in evolution. However, in<br />
some organisms there is no distinction<br />
between germline or somatic mutation.<br />
Only mutations that were fixed in the<br />
population are called substitutions.<br />
Multiple<br />
Substitution<br />
A<br />
C<br />
T<br />
G<br />
A > C > T<br />
A<br />
C > G<br />
G<br />
T > A<br />
Original Sequence<br />
A<br />
C<br />
T<br />
G<br />
A<br />
A<br />
C<br />
G<br />
T<br />
A<br />
coincidental Substitution<br />
Parallel Substitution<br />
A<br />
C > A<br />
T<br />
G<br />
A<br />
A<br />
C > A<br />
G<br />
T > A<br />
Single Substitution<br />
Correction of Distances between<br />
DNA sequences<br />
In order <strong>to</strong> detect changes in DNA<br />
sequences we compare them <strong>to</strong> each<br />
other.<br />
We assume that each observed change in<br />
similar sequences, represent a “single<br />
mutation event”.<br />
The greater the number of changes, the<br />
more possible types of mutations.<br />
Mutations - Substitutions<br />
Q: What do we measure by sequence alignment?<br />
A: Substitutions in the aligned sequences.<br />
The rate of substitution in regions that<br />
evolve under no constraints are assumed<br />
<strong>to</strong> be equal <strong>to</strong> the mutation rate.
Mutations - Substitutions<br />
Point mutation - mutation in a single<br />
nucleotide.<br />
Segmental mutation - mutation in several<br />
adjacent nucleotides.<br />
Substitution mutation - replacement of one<br />
nucleotide with another.<br />
Recombination - exchange of a sequence<br />
with another.<br />
1 AGGCAAACCTACTGGTCTTAT Original Sequence<br />
*<br />
2 AGGCAAATCCTACTGGTCTTAT Transtion c-t<br />
3 AGGCAAACCTACTGCTCTTAT transversion g-c<br />
*<br />
4 AGGCAAACCTACTGGTCTTAT recombination gtctt<br />
ACCTA<br />
5 AGGCAA CTGGTCTTAT deletion accta<br />
6 AGGCAAACCTACTAAAGCGGTCTTAT insertion aagcg<br />
7 AGGTTTGCCTACTGGTCTTAT inversion from 5' gcaaac3'<br />
<strong>to</strong> 5' gtttgc 3'<br />
Mutations<br />
♣Deletion - removal of one or more nucleotides<br />
from the DNA.<br />
♣Insertion - addition of one or more<br />
nucleotides <strong>to</strong> the DNA.<br />
♣Inversion - rotation by 180 of a doublestranded<br />
DNA segment comprising 2 or more<br />
base-pairs.<br />
Substitution Mutations<br />
Transition - a change between purines<br />
(A,G) or between pyrimidines (T,C).<br />
Transversion - a change between purines<br />
(A,G) <strong>to</strong> pyrimidines (T,C).<br />
Substitution mutations usually arise from<br />
mispairing of bases during replication.
Let's assume that..<br />
A mutation of a sense codon <strong>to</strong> another<br />
sense codon, occur in equal frequency for<br />
all the codons.<br />
If so we can now compute the expected<br />
proportion of different types of substitution<br />
mutations from the genetic code.<br />
Correction of Distances between<br />
DNA sequences<br />
There are several evolutionary models<br />
used <strong>to</strong> correct for the likelihood of<br />
multiple mutations and reversions in DNA<br />
sequences.<br />
These evolutionary models use a<br />
normalized distance measurement that is<br />
the average degree of change per length<br />
of aligned sequences.<br />
Where do the mutations occur?<br />
Synonymous substitutions mostly occur at<br />
the 3rd position of the codon.<br />
Nonsynonymous substitutions mostly<br />
occur at the 2nd position of the codon.<br />
Any substitution in the 2nd position is<br />
nonsynonymous<br />
Jukes & Can<strong>to</strong>r one-parameter model<br />
This model assumes that substitutions<br />
between the 4 bases occur with equal frequency.<br />
Meaning no bias in the direction of the change.<br />
A<br />
C<br />
α<br />
G<br />
T<br />
α<br />
Is the rate of substitutions<br />
In each of the 3 directions<br />
For one base.<br />
α ( Is the one parameter).
Kimura two-parameter model<br />
This model assumes that transitions<br />
(A - G or T - C) occur more often than<br />
transversions (purine -pyrimidine).<br />
A<br />
C<br />
α<br />
α<br />
G<br />
T<br />
α<br />
Is the rate of transitional<br />
Substitutions.<br />
β<br />
β<br />
β Is the rate of transversional<br />
substitutions.<br />
DNA Evolution Models<br />
A basic process in DNA sequence<br />
evolution is the substitution of one<br />
nucleotide with another.<br />
This process is slow and can not be<br />
observed directly.<br />
The study of DNA changes is used <strong>to</strong><br />
estimate the rate of evolution, and the<br />
evolution his<strong>to</strong>ry of organisms.<br />
These evolutionary models improve the<br />
distance calculations between the<br />
sequences.<br />
These evolutionary models have less<br />
effect in phylogenetic predictions of<br />
closely related sequences.<br />
These evolutionary models have better<br />
effect with distant related sequences.<br />
rat<br />
goldfish<br />
zebrafish<br />
Xeno<br />
bovine<br />
human<br />
How <strong>to</strong> read the tree?<br />
Start at the base and follow<br />
The progression of the branch<br />
points (nodes)
How <strong>to</strong> draw Trees? (Building trees software)<br />
* Unrooted trees should be plotted using<br />
the DRAWGRAM program (phylip), or<br />
similar.<br />
* Rooted trees should be plotted using the<br />
DRAWTREE program (phylip), or similar.<br />
* On a PC use the TreeView program<br />
Known problems of <strong>Phylogenetic</strong> <strong>Analysis</strong><br />
Order of the input data (sequences) -<br />
The order of the input sequences effects the tree<br />
construction. You can "correct" this effect in some<br />
of the programs (like phylip), using the Jumble<br />
option. (J in phylip set <strong>to</strong> 10).<br />
The number of possible trees is huge for large<br />
datasets. Often it is not possible <strong>to</strong> construct all<br />
trees, but can guarantee only "a good" tree not<br />
the "best tree".<br />
A Tip...<br />
For DNA sequences use the Kimura's<br />
model in the building trees programs.<br />
For PROTEINS the differences lie with<br />
the scoring (substitution) matrices used.<br />
For more distant sequences you should<br />
use BLOSUM with lower # (i.e., for<br />
distant proteins use blosum45 and for<br />
similar proteins use blosum60).<br />
Known problems of <strong>Phylogenetic</strong> <strong>Analysis</strong><br />
The definition of "best tree" is ambiguous.<br />
It might mean the most likely tree, or a tree with<br />
the fewest changes, or a tree best fit <strong>to</strong> a known<br />
model, etc..<br />
The trees that result from various methods differ<br />
from each other. Never the less, in order <strong>to</strong><br />
compare trees, one need <strong>to</strong> assume some<br />
evolutionary model so that the trees may be<br />
tested.
Known problems of <strong>Phylogenetic</strong> <strong>Analysis</strong><br />
∆ The amount of data used for the tree construction is<br />
not always "informative". For example, if we<br />
compare proteins that are 100% similar in a site, we<br />
do not have information <strong>to</strong> infer <strong>to</strong> phylogenetic<br />
relationships between these proteins.<br />
∆ Population effects are often <strong>to</strong> be considered,<br />
especially if we have a lot of variety (large # of<br />
alleles for one protein).<br />
How many trees <strong>to</strong> build?<br />
! For each dataset it is recommended <strong>to</strong> build<br />
more than one tree. Build a tree using a<br />
distance method and if possible also use a<br />
character-based method, like maximum<br />
parsimony.<br />
! The core of the tree should be similar in<br />
both methods, otherwise you may suspect<br />
that your tree is incorrect.