Full Text - Nature and Science
Full Text - Nature and Science
Full Text - Nature and Science

Create successful ePaper yourself
Turn your PDF publications into a flip-book with our unique Google optimized e-Paper software.
<strong>Nature</strong> <strong>and</strong> <strong>Science</strong>, 2011;9(12) http://www.sciencepub.net/nature<br />
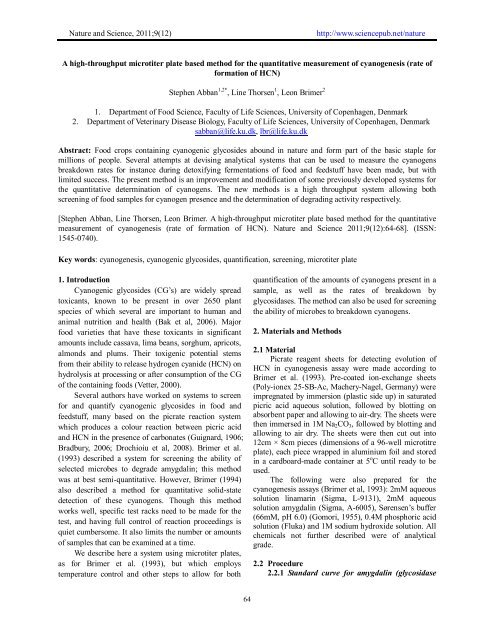
A high-throughput microtiter plate based method for the quantitative measurement of cyanogenesis (rate of<br />
formation of HCN)<br />
Stephen Abban 1,2* , Line Thorsen 1 , Leon Brimer 2<br />
1. Department of Food <strong>Science</strong>, Faculty of Life <strong>Science</strong>s, University of Copenhagen, Denmark<br />
2. Department of Veterinary Disease Biology, Faculty of Life <strong>Science</strong>s, University of Copenhagen, Denmark<br />
sabban@life.ku.dk, lbr@life.ku.dk<br />
Abstract: Food crops containing cyanogenic glycosides abound in nature <strong>and</strong> form part of the basic staple for<br />
millions of people. Several attempts at devising analytical systems that can be used to measure the cyanogens<br />
breakdown rates for instance during detoxifying fermentations of food <strong>and</strong> feedstuff have been made, but with<br />
limited success. The present method is an improvement <strong>and</strong> modification of some previously developed systems for<br />
the quantitative determination of cyanogens. The new methods is a high throughput system allowing both<br />
screening of food samples for cyanogen presence <strong>and</strong> the determination of degrading activity respectively.<br />
[Stephen Abban, Line Thorsen, Leon Brimer. A high-throughput microtiter plate based method for the quantitative<br />
measurement of cyanogenesis (rate of formation of HCN). <strong>Nature</strong> <strong>and</strong> <strong>Science</strong> 2011;9(12):64-68]. (ISSN:<br />
1545-0740).<br />
Key words: cyanogenesis, cyanogenic glycosides, quantification, screening, microtiter plate<br />
1. Introduction<br />
Cyanogenic glycosides (CG’s) are widely spread<br />
toxicants, known to be present in over 2650 plant<br />
species of which several are important to human <strong>and</strong><br />
animal nutrition <strong>and</strong> health (Bak et al, 2006). Major<br />
food varieties that have these toxicants in significant<br />
amounts include cassava, lima beans, sorghum, apricots,<br />
almonds <strong>and</strong> plums. Their toxigenic potential stems<br />
from their ability to release hydrogen cyanide (HCN) on<br />
hydrolysis at processing or after consumption of the CG<br />
of the containing foods (Vetter, 2000).<br />
Several authors have worked on systems to screen<br />
for <strong>and</strong> quantify cyanogenic glycosides in food <strong>and</strong><br />
feedstuff, many based on the picrate reaction system<br />
which produces a colour reaction between picric acid<br />
<strong>and</strong> HCN in the presence of carbonates (Guignard, 1906;<br />
Bradbury, 2006; Drochioiu et al, 2008). Brimer et al.<br />
(1993) described a system for screening the ability of<br />
selected microbes to degrade amygdalin; this method<br />
was at best semi-quantitative. However, Brimer (1994)<br />
also described a method for quantitative solid-state<br />
detection of these cyanogens. Though this method<br />
works well, specific test racks need to be made for the<br />
test, <strong>and</strong> having full control of reaction proceedings is<br />
quiet cumbersome. It also limits the number or amounts<br />
of samples that can be examined at a time.<br />
We describe here a system using microtiter plates,<br />
as for Brimer et al. (1993), but which employs<br />
temperature control <strong>and</strong> other steps to allow for both<br />
64<br />
quantification of the amounts of cyanogens present in a<br />
sample, as well as the rates of breakdown by<br />
glycosidases. The method can also be used for screening<br />
the ability of microbes to breakdown cyanogens.<br />
2. Materials <strong>and</strong> Methods<br />
2.1 Material<br />
Picrate reagent sheets for detecting evolution of<br />
HCN in cyanogenesis assay were made according to<br />
Brimer et al. (1993). Pre-coated ion-exchange sheets<br />
(Poly-ionex 25-SB-Ac, Machery-Nagel, Germany) were<br />
impregnated by immersion (plastic side up) in saturated<br />
picric acid aqueous solution, followed by blotting on<br />
absorbent paper <strong>and</strong> allowing to air-dry. The sheets were<br />
then immersed in 1M Na2CO3, followed by blotting <strong>and</strong><br />
allowing to air dry. The sheets were then cut out into<br />
12cm × 8cm pieces (dimensions of a 96-well microtitre<br />
plate), each piece wrapped in aluminium foil <strong>and</strong> stored<br />
in a cardboard-made container at 5 o C until ready to be<br />
used.<br />
The following were also prepared for the<br />
cyanogenesis assays (Brimer et al, 1993): 2mM aqueous<br />
solution linamarin (Sigma, L-9131), 2mM aqueous<br />
solution amygdalin (Sigma, A-6005), Sørensen’s buffer<br />
(66mM, pH 6.0) (Gomori, 1955), 0.4M phosphoric acid<br />
solution (Fluka) <strong>and</strong> 1M sodium hydroxide solution. All<br />
chemicals not further described were of analytical<br />
grade.<br />
2.2 Procedure<br />
2.2.1 St<strong>and</strong>ard curve for amygdalin (glycosidase
<strong>Nature</strong> <strong>and</strong> <strong>Science</strong>, 2011;9(12) http://www.sciencepub.net/nature<br />
breakdown)<br />
The following solutions of amygdalin were<br />
prepared: 1.0, 0.5, 0.2, 0.1, <strong>and</strong> 0.05mM. These were<br />
placed in each second row of a microtitre plate in 20µl<br />
amounts. A volume of 180µl of Sørensen’s buffer was<br />
added to each reaction well, followed by addition of<br />
20µl of 5g/l solution of β-glucosidase solution (Sigma<br />
G-0395, Sigma-Aldrich, USA) using a multichannel<br />
pipette. A picrate sheet was quickly placed on it, with<br />
appropriate weight <strong>and</strong> the setup was incubated at 30 o C<br />
overnight. The picrate sheet was then dried, wrapped in<br />
aluminium foil <strong>and</strong> stored at 5 o C in the dark until ready<br />
for analysis.<br />
The reaction spots were scanned with a st<strong>and</strong>ard<br />
office scanner <strong>and</strong> analyzed densitometrically using the<br />
Quantiscan ® software (Biosoft, UK), as by Brimer<br />
(1994). The spread results generated were imported into<br />
<strong>and</strong> analyzed with Microsoft Excel <strong>and</strong> plotted to obtain<br />
a st<strong>and</strong>ard curve relating spot intensity to amount of<br />
cyanogen originally present. It is assumed that the<br />
breakdown is complete since the β-glucosidase was in<br />
excess <strong>and</strong> maximum reaction time was allowed.<br />
2.2.2 Quantifying the breakdown rates for a<br />
commercial enzyme <strong>and</strong> degrading microbes<br />
The following solutions of β-glucosidase<br />
respectively, were prepared: 60mg/l, 20mg/l <strong>and</strong><br />
6.7mg/l. On each second row of a microtitre plate (on<br />
the shorter 8cm end), 20µl of the enzyme solution were<br />
placed in corresponding mapped wells (8 repetitions for<br />
each concentration). This was followed by addition of<br />
180µl of Sørensen’s buffer. A multichannel pipette was<br />
used to quickly deliver 20µl of 2mM amygdalin<br />
solution into each of the test wells, the plate quickly<br />
covered with a picrate sheet <strong>and</strong> a timer started<br />
simultaneously. The set up with appropriate weight was<br />
then incubated at 30 o C. Negative control wells<br />
contained 200µl of buffer <strong>and</strong> 20µl of amygdalin<br />
solution.<br />
Four such reaction plates were done with reactions<br />
being stopped after 10 minutes, 30 minutes, 1 hour <strong>and</strong><br />
2 hours, by removing from incubation <strong>and</strong> quickly<br />
placing the plate between 2 cooling element frozen at<br />
-80 o C overnight, for 5 minutes. A volume of 20µl 1M<br />
NaOH was added to each reaction well via use of a<br />
multichannel pipette after opening up the picrate sheet<br />
which had been hinged to the edge of the plate with<br />
adhesive tape (ensures sheet falls to the same position<br />
when reaction is continued). The plate was then placed<br />
on an orbital shaker with rotation at 100rev/min for 5<br />
minutes to allow mixing of the base which further<br />
ceases the reaction by raising the pH of each well to 11.<br />
When the well contents had sufficiently thawed, 20µl of<br />
0.4M of H3PO4 solution was added to each reacting well<br />
(brings pH back to about 6 <strong>and</strong> allows CN- to be<br />
converted to HCN) <strong>and</strong> the picrate sheets was<br />
65<br />
immediately placed back on the plate. The set up was<br />
allowed to st<strong>and</strong> at room temperature overnight. The<br />
picrate sheets were then dried, wrapped in aluminium<br />
foil, <strong>and</strong> stored at 5 o C until ready for analysis.<br />
Kinetics assays similar to that done above with<br />
commercial β-glucosidase replaced by cell suspension<br />
of Bacillus spp. strains containing 1µg wet weight of<br />
cell pellet per µl of Sørensen’s buffer were made. The<br />
strains were obtained from the freeze collection at the<br />
Department of Food <strong>Science</strong>, University of Copenhagen<br />
<strong>and</strong> treated as follow: strains were first grown on BHI<br />
agar overnight. Single colonies were inoculated into<br />
15ml of BHI broth in a 50ml volumetric flask with<br />
metal capping <strong>and</strong> incubated in a water bath at 30 o C<br />
with aeration at 120 rpm (GFL 1083, GFL GmbH) for<br />
24 hr. Ten ml of the resulting culture was centrifuged<br />
at 3900×g for 10 min at 5 o C, supernatant discarded <strong>and</strong><br />
pellets washed twice with Sorensen’s buffer to obtain<br />
the wet pellets used.<br />
The reaction spots from these assays were scanned<br />
<strong>and</strong> analysed densitometrically using the Quantiscan<br />
software (Biosoft, UK), followed by analysis as above.<br />
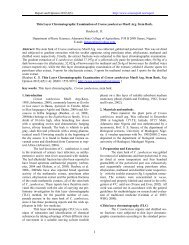
0.0 20.0 10.0 5.0 2.0 1.0<br />
Figure 1: Image of picrate sheet used for st<strong>and</strong>ards<br />
analysis; indicated values are st<strong>and</strong>ard concentrations<br />
of amygdalin used (in nmol).<br />
3. Results <strong>and</strong> Discussion<br />
The Quantiscan analysis maps the lanes of spots<br />
<strong>and</strong> returns a net area, which is proportional to the<br />
intensity of the spot. Figure 1 is the gray scale image of<br />
a sheet used in quantifying the degradation of st<strong>and</strong>ard<br />
amounts of amygdalin. The increase in spot intensity<br />
with increase in cyanogen concentration is obvious. The<br />
corresponding st<strong>and</strong>ard curve, fitted to the average <strong>and</strong><br />
deviations plot is shown in figure 2. This curve can thus<br />
be used to read-off or calculate the ‘amygdalin<br />
equivalent’ of cyanogens present in a sample within the
<strong>Nature</strong> <strong>and</strong> <strong>Science</strong>, 2011;9(12) http://www.sciencepub.net/nature<br />
limits of the curve. The curve was thus used for that purpose for the proceeding quantifications.<br />
Net Area<br />
1000<br />
900<br />
800<br />
700<br />
600<br />
500<br />
400<br />
300<br />
200<br />
100<br />
y = -1,8684x 2 + 74,75x + 77,518<br />
R 2 = 0,9738<br />
0<br />
0 5 10 15 20 25<br />
Amount of amygdalin in well (nmol)<br />
Figure 2: Plot of amounts of amygdalin used in st<strong>and</strong>ards versus the ‘net area’ scores from Quantiscan® analysis<br />
(n=8).<br />
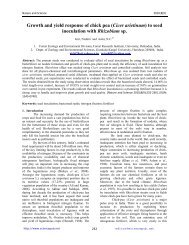
6.7 20.0 60.0 0.0<br />
Figure 3: Image picrate sheet for kinetic analysis for<br />
reaction stopped after 1hour of incubation; indicated<br />
figures are concentrations of β-glucosidase solutions<br />
used (in mg/l).<br />
66<br />
C43 C45 C46 C13 F32 F21 NEG<br />
Figure 4: Image of picrate sheet from kinetic reaction<br />
analysis for Bacillus strains after 3 hours incubation).<br />
The gray scale images of one of the time points<br />
each for both the commercial β-glucosidase <strong>and</strong> the
<strong>Nature</strong> <strong>and</strong> <strong>Science</strong>, 2011;9(12) http://www.sciencepub.net/nature<br />
assayed Bacillus spp. are shown in figures 3 <strong>and</strong> 4<br />
respectively.<br />
For the same period of incubation, the effect of<br />
higher glucosidase concentration on breakdown is clear.<br />
The amounts of substrate broken down in the given<br />
time are read-off figure 2 using the net area scores from<br />
Amount of amydalin broken down (nmol)<br />
16<br />
14<br />
12<br />
10<br />
8<br />
6<br />
4<br />
2<br />
67<br />
the spot analysis. The plot of this with time for the<br />
commercial enzyme (20mg/l concentration) is shown in<br />
figure 5. From the equation of the fitted line, the<br />
enzyme rate is 0.082nmol/min of amygdalin or<br />
4.94nmol/hr, for the chosen experimental conditions.<br />
y = 0,0823x + 3,4488<br />
R 2 = 0,9977<br />
0<br />
0 20 40 60 80 100 120 140<br />
Time (minutes)<br />
Figure 5: Plot of calculated amount of amygdalin broken down per minute by the 20mg/l β-glucosidase experiment<br />
(n=8).<br />
For the Bacillus assay, equimolar amount of<br />
linamarin (present in the cyanogenic food commodity<br />
cassava) were used as the cyanogen, as some of the<br />
strains were known from previous works (Abban et al,<br />
unpublished) to be substrate specific. The average net<br />
area from the Quantiscan analysis <strong>and</strong> corresponding<br />
amounts of cyanogen broken down for one time point<br />
(3 hour incubation; as in figure 4) are shown in table<br />
1. Strain C13 had been shown from later screening<br />
(Abban et al, unpublished) to not have cyanogen<br />
degrading activity, so the results are consistent.<br />
Strains C45 <strong>and</strong> F32 are the most active at cyanogens<br />
breakdown for the given conditions.<br />
Table 1: Calculated amounts of linamarin broken down by 10 -3 mg/µl (wet weight) cell suspension after 3 hours<br />
incubation<br />
Microbial strain C43 (n=3) C45 (n=4) C46 (n=4) C13 (n=4) F32 (n=4) F21 (n=4)<br />
Net area (Average) 408.29 479.90 248.41 84.08 472.59 321.85<br />
St<strong>and</strong>ard deviation 22.26 24.25 7.76 8.78 44.97 57.30<br />
Amount of amygdalin equivalent broken down <strong>and</strong> reaction rates<br />
Average amounts<br />
(nmol) 3.61 6.29 0.09 2.45 6.45 5.09<br />
Breakdown rates<br />
(nmol/hr) 1.20 2.10 0.03 0.82 2.15 1.70
<strong>Nature</strong> <strong>and</strong> <strong>Science</strong>, 2011;9(12) http://www.sciencepub.net/nature<br />
The information that can be obtained from this<br />
system can be very instructive. Cyanogen contents of<br />
large sets of samples of food or other materials can be<br />
determined within a short period, with some<br />
optimizations. The breakdown rates of cyanogens<br />
during various fermentations of cyanogenic crops such<br />
as cassava (Padonou et al, 2009; Amoa-Awua,<br />
Jakobsen, 1995) can also be followed. To this end the<br />
contributions of different microbial strains to the<br />
detoxification process of such crops in fermentation<br />
can be done more accurately at reasonable cost in short<br />
periods. This could also be the starting point for<br />
screening for microbes with the ability to produce such<br />
degrading enzymes, which can then be scaled up<br />
industrially (Schallmey et al, 2004).<br />
Correspondence to:<br />
Stephen Abban<br />
Department of Food <strong>Science</strong>, Faculty of Life <strong>Science</strong>s,<br />
University of Copenhagen, Rolighedsvej 30, 4 th floor,<br />
DK-1958 Frederiksberg C, Denmark.<br />
Telephone: +45 35 33 32 93<br />
Fax: +45 35 33 32 14<br />
Emails: sabban@life.ku.dk; lbr@life.ku.dk<br />
References<br />
[1] Amoa-Awua WKA. The dominating microflora<br />
<strong>and</strong> their role in the fermentation of ‘agbelima’<br />
cassava dough. Ph.D thesis, University of Ghana,<br />
2006.<br />
[2] Amoa-Awua WKA, Jakobsen M. The role of<br />
Bacillus species in the fermentation of cassava.<br />
Journal of Applied Bacteriology, 1995; 79,<br />
250–256.<br />
11/2/2011<br />
[3] Bak S, Paquette SM, Morant M, Morant AV, Saito<br />
S, Bjarnholt N, Zagrobelny M, Jørgensen K,<br />
Osmani S, Simonsen HS, Perez RS, van<br />
Heeswijck TB, Jørgensen B, Møller BL.<br />
Cyanogenic glycosides: a case study for evolution<br />
<strong>and</strong> application of cytochromes P450.<br />
Phytochemistry Review, 2006; 5, 309–329.<br />
[4] Bradbury JH. Simple wetting method to reduce<br />
cyanogen content of cassava flour. Journal of Food<br />
Composition <strong>and</strong> Analysis, 2006; 19(4), 388-393.<br />
[5] Brimer L. Quantitative solid-state detection of<br />
cyanogens: from field test kits to semi-automated<br />
laboratory systems allowing kinetic measurements.<br />
Acta Horticulturae (Wageningen), 1994; 375,<br />
105–116.<br />
[6] Brimer L, Tuncel G, Nout MJR. Simple screening<br />
procedure for microorganisms to degrade<br />
amygdalin. Biotechnology Techniques, 1993; 7,<br />
683–687.<br />
[7] Drochioiu, G., Arsene, C., Murariu, M. & Oniscu,<br />
C. Analysis of cyanogens with resorcinol <strong>and</strong><br />
picrate. Food <strong>and</strong> Chemical Toxicology, 2008; 46,<br />
3540–3545.<br />
[8] Guignard ML. Chemie Vegetale.-Le Haricot a<br />
acide cyanohydrique, Phaseolus lunatus L.<br />
Comptes Rendues hebdomadaires des Seances de<br />
l’Academie des <strong>Science</strong>s, 1906; 142, 545-553.<br />
[9] Gomori, G. Preparation of biological buffers.<br />
Methods of Enzymology, 1, 1955; 138-145.<br />
[10] Padonou SW, Nielsen DS, Hounhouigan JD,<br />
Thorsen L, Nago MC, Jakobsen M. The<br />
microbiota of lafun, an African traditional cassava<br />
food product. International Journal of Food<br />
Microbiology, 2009; 133, 22-30.<br />
[11] Schallmey M, Singh A, Ward OP. Developments<br />
in the use of Bacillus species in industrial<br />
production. Canadian Journal of Microbiology,<br />
2004; 50, 1-17.<br />
[12] Vetter J. Plant cyanogenic glycosides. Toxicon,<br />
2000; 38, 11-36.<br />
http://www.sciencepub.net/nature 68<br />
naturesciencej@gmail.com