Psychrometric Chart Celebrates 100th Anniversary - ashrae
Psychrometric Chart Celebrates 100th Anniversary - ashrae
Psychrometric Chart Celebrates 100th Anniversary - ashrae

Create successful ePaper yourself
Turn your PDF publications into a flip-book with our unique Google optimized e-Paper software.
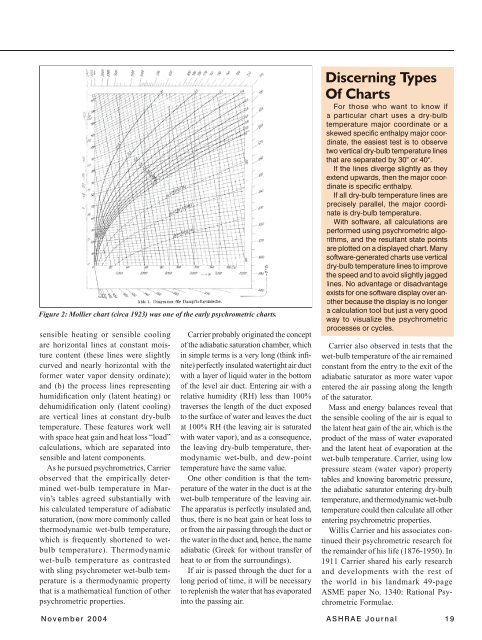
Figure 2: Mollier chart (circa 1923) was one of the early psychrometric charts.<br />
sensible heating or sensible cooling<br />
are horizontal lines at constant moisture<br />
content (these lines were slightly<br />
curved and nearly horizontal with the<br />
former water vapor density ordinate);<br />
and (b) the process lines representing<br />
humidifi cation only (latent heating) or<br />
dehumidifi cation only (latent cooling)<br />
are vertical lines at constant dry-bulb<br />
temperature. These features work well<br />
with space heat gain and heat loss “load”<br />
calculations, which are separated into<br />
sensible and latent components.<br />
As he pursued psychrometrics, Carrier<br />
observed that the empirically determined<br />
wet-bulb temperature in Marvin’s<br />
tables agreed substantially with<br />
his calculated temperature of adiabatic<br />
saturation, (now more commonly called<br />
thermodynamic wet-bulb temperature,<br />
which is frequently shortened to wetbulb<br />
temperature). Thermodynamic<br />
wet-bulb temperature as contrasted<br />
with sling psychrometer wet-bulb temperature<br />
is a thermodynamic property<br />
that is a mathematical function of other<br />
psychrometric properties.<br />
Carrier probably originated the concept<br />
of the adiabatic saturation chamber, which<br />
in simple terms is a very long (think infi -<br />
nite) perfectly insulated watertight air duct<br />
with a layer of liquid water in the bottom<br />
of the level air duct. Entering air with a<br />
relative humidity (RH) less than 100%<br />
traverses the length of the duct exposed<br />
to the surface of water and leaves the duct<br />
at 100% RH (the leaving air is saturated<br />
with water vapor), and as a consequence,<br />
the leaving dry-bulb temperature, thermodynamic<br />
wet-bulb, and dew-point<br />
temperature have the same value.<br />
One other condition is that the temperature<br />
of the water in the duct is at the<br />
wet-bulb temperature of the leaving air.<br />
The apparatus is perfectly insulated and,<br />
thus, there is no heat gain or heat loss to<br />
or from the air passing through the duct or<br />
the water in the duct and, hence, the name<br />
adiabatic (Greek for without transfer of<br />
heat to or from the surroundings).<br />
If air is passed through the duct for a<br />
long period of time, it will be necessary<br />
to replenish the water that has evaporated<br />
into the passing air.<br />
Discerning Types<br />
Of <strong>Chart</strong>s<br />
For those who want to know if<br />
a particular chart uses a dry-bulb<br />
temperature major coordinate or a<br />
skewed specifi c enthalpy major coordinate,<br />
the easiest test is to observe<br />
two vertical dry-bulb temperature lines<br />
that are separated by 30° or 40°.<br />
If the lines diverge slightly as they<br />
extend upwards, then the major coordinate<br />
is specifi c enthalpy.<br />
If all dry-bulb temperature lines are<br />
precisely parallel, the major coordinate<br />
is dry-bulb temperature.<br />
With software, all calculations are<br />
performed using psychrometric algorithms,<br />
and the resultant state points<br />
are plotted on a displayed chart. Many<br />
software-generated charts use vertical<br />
dry-bulb temperature lines to improve<br />
the speed and to avoid slightly jagged<br />
lines. No advantage or disadvantage<br />
exists for one software display over another<br />
because the display is no longer<br />
a calculation tool but just a very good<br />
way to visualize the psychrometric<br />
processes or cycles.<br />
Carrier also observed in tests that the<br />
wet-bulb temperature of the air remained<br />
constant from the entry to the exit of the<br />
adiabatic saturator as more water vapor<br />
entered the air passing along the length<br />
of the saturator.<br />
Mass and energy balances reveal that<br />
the sensible cooling of the air is equal to<br />
the latent heat gain of the air, which is the<br />
product of the mass of water evaporated<br />
and the latent heat of evaporation at the<br />
wet-bulb temperature. Carrier, using low<br />
pressure steam (water vapor) property<br />
tables and knowing barometric pressure,<br />
the adiabatic saturator entering dry-bulb<br />
temperature, and thermodynamic wet-bulb<br />
temperature could then calculate all other<br />
entering psychrometric properties.<br />
Willis Carrier and his associates continued<br />
their psychrometric research for<br />
the remainder of his life (1876-1950). In<br />
1911 Carrier shared his early research<br />
and developments with the rest of<br />
the world in his landmark 49-page<br />
ASME paper No. 1340: Rational <strong>Psychrometric</strong><br />
Formulae.<br />
N o v e m b e r 2 0 0 4 A S H R A E J o u r n a l 1 9