Psychrometric Chart Celebrates 100th Anniversary - ashrae
Psychrometric Chart Celebrates 100th Anniversary - ashrae
Psychrometric Chart Celebrates 100th Anniversary - ashrae

Create successful ePaper yourself
Turn your PDF publications into a flip-book with our unique Google optimized e-Paper software.
The following article was published in ASHRAE Journal, November 2004. © Copyright 2004 American Society of Heating, Refrigerating<br />
and Air-Conditioning Engineers, Inc. It is presented for educational purposes only. This article may not be copied and/or distributed electronically<br />
or in paper form without permission of ASHRAE.<br />
<strong>Psychrometric</strong><br />
<strong>Chart</strong> <strong>Celebrates</strong><br />
100 th <strong>Anniversary</strong><br />
By Donald P. Gatley, P.E., Fellow/Life Member ASHRAE<br />
W<br />
hat is psychrometrics? One Web site calls it the dreaded “Pword!”<br />
<strong>Psychrometric</strong>s is a subscience of physics dealing with<br />
the properties and processes of moist air. Moist air is defi ned as a<br />
mixture of two gases: dry air and water vapor (the gas phase of H 2 O). 1<br />
Some broaden the defi nition of psychrometrics to cover mixtures of<br />
the gas of one substance (any dry gas component) and the condensable<br />
vapor of a second substance. <strong>Psychrometric</strong>s is not confi ned to<br />
the world of air conditioning. It is used in the fi elds of agricultural and<br />
aeronautical engineering, food engineering, drying of crops, grains,<br />
and pharmaceuticals, dehydration, dehumidifi cation, humidifi cation,<br />
moisture control, meteorology, and weather reporting.<br />
This article looks at the state-of-the<br />
art of psychrometrics prior to 1904 when<br />
Willis H. Carrier produced the fi rst chart<br />
and then traces the developments from<br />
1904 to 2004.<br />
The <strong>Psychrometric</strong> <strong>Chart</strong><br />
So what is a psychrometric chart and<br />
why would anyone want to use it? The<br />
psychrometric chart is a convenient and<br />
useful tool for (1) determining moist air<br />
psychrometric properties, and (2) visual-<br />
izing the changes of properties in a sequence<br />
of psychrometric processes; e.g.,<br />
(a) as the outside and return air mixes,<br />
(b) proceeds through heating and cooling<br />
coils, (c) the supply fan, (d) supply duct,<br />
and on to (e) the conditioned space.<br />
Prior to the advent of personal computer<br />
psychrometric software, the psychrometric<br />
chart also was used extensively<br />
as an extremely useful graphical tool for<br />
solving and diagnosing and then visualizing<br />
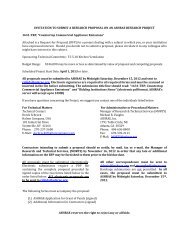
psychrometric processes. Younger<br />
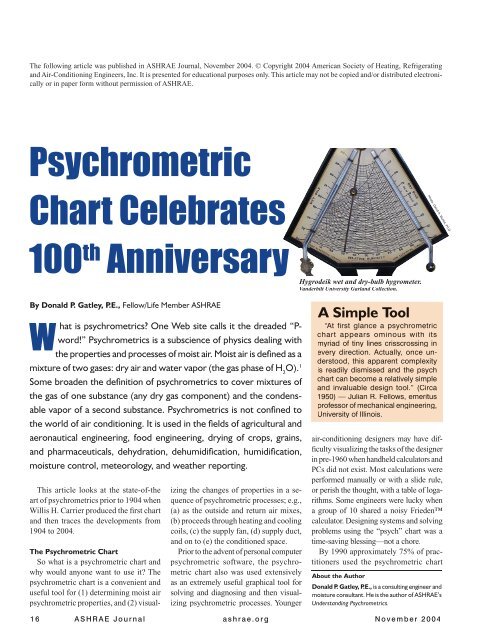
Hygrodeik wet and dry-bulb hygrometer.<br />
Vanderbilt University Garland Collection.<br />
A Simple Tool<br />
“At first glance a psychrometric<br />
chart appears ominous with its<br />
myriad of tiny lines crisscrossing in<br />
every direction. Actually, once understood,<br />
this apparent complexity<br />
is readily dismissed and the psych<br />
chart can become a relatively simple<br />
and invaluable design tool.” (Circa<br />
1950) — Julian R. Fellows, emeritus<br />
professor of mechanical engineering,<br />
University of Illinois.<br />
air-conditioning designers may have diffi<br />
culty visualizing the tasks of the designer<br />
in pre-1960 when handheld calculators and<br />
PCs did not exist. Most calculations were<br />
performed manually or with a slide rule,<br />
or perish the thought, with a table of logarithms.<br />
Some engineers were lucky when<br />
a group of 10 shared a noisy Frieden<br />
calculator. Designing systems and solving<br />
problems using the “psych” chart was a<br />
time-saving blessing—not a chore.<br />
By 1990 approximately 75% of practitioners<br />
used the psychrometric chart<br />
About the Author<br />
Donald P. Gatley, P.E., is a consulting engineer and<br />
moisture consultant. He is the author of ASHRAE’s<br />
Understanding <strong>Psychrometric</strong>s.<br />
1 6 A S H R A E J o u r n a l a s h r a e . o r g N o v e m b e r 2 0 0 4<br />
Photo: David A. Burba, Ph.D.
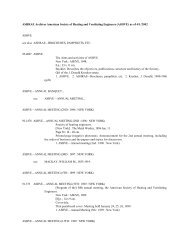
Description<br />
Dry-Bulb Temp.<br />
Wet-Bulb Temp.<br />
Dew-Point Temp.<br />
Relative Humidity<br />
Barometric Pressure<br />
Measurable <strong>Psychrometric</strong> Properties<br />
Symbol<br />
t DB<br />
t WB<br />
t DP<br />
RH<br />
P BAR<br />
SI Unit<br />
Table 1: Nine of the most common psychrometric properties.<br />
as a tool in solving psychrometric problems and the rest used<br />
computer software. In the fi rst decade of the 21st century most<br />
practitioners rely on psychrometric software based on ideal-gas<br />
algorithms (with 99% or greater accuracy). As a secondary<br />
function most software programs generate a psychrometric chart<br />
showing the state points and the psychrometric process lines<br />
connecting the state points. The displayed state point properties<br />
either will be original data entries or the results of accurate<br />
calculations, not the result of graphical plotting.<br />
The demise of printed psychrometric charts will probably be<br />
similar to the demise of the slide rule (replaced by the handheld<br />
calculator), and the log-log and other special plotting papers<br />
(replaced by plotting capabilities of spreadsheet software).<br />
It is only a matter of time before the once-familiar pads of<br />
psychrometric charts from ASHRAE and air-conditioning and<br />
dehumidifi cation manufacturers will no longer be available. Put<br />
a collection away for your grandchildren (someday they may<br />
have the value of baseball cards of the 40s and 50s).<br />
What Preceded Carrier’s 1904 <strong>Psychrometric</strong> <strong>Chart</strong>?<br />
Table 1 lists nine of the most used psychrometric properties.<br />
Thanks mainly to the fi eld of meteorology, these properties<br />
were already in use in the 1850 to 1900 era because of a host<br />
of individuals listed in Table 2.<br />
Prior to 1900, tables of empirical psychrometric property<br />
values were used by meteorologists. In 1847 Glaisher’s Hygrometrical<br />
Tables were the fi rst reliable tables listing water-vapor<br />
°C<br />
°C<br />
°C<br />
%<br />
Pa<br />
I-P Unit<br />
°F<br />
°F<br />
°F<br />
%<br />
in. H G or psia<br />
Description<br />
Specifi c Enthalpy<br />
Specifi c Volume<br />
Humidity Ratio<br />
Water Vapor Pressure<br />
Calculable <strong>Psychrometric</strong> Properties<br />
Symbol<br />
pressure; barometric pressure; stationary wet-bulb, dry-bulb, and<br />
dew-point temperature; relative humidity, water-vapor density (in<br />
grains and pounds per cubic foot), and the additional quantity<br />
of H 2 O required for complete saturation. Part of Glaisher’s data<br />
was empirical and based on two years of observations of these<br />
properties at Greenwich, England. Glaisher may not have been<br />
aware that stationary wet-bulb temperature varied widely because<br />
it was dependent not only on two other properties but also the<br />
velocity of natural (and quite variable) air currents across the<br />
(stationary) wet-wick-covered-thermometer bulb.<br />
In 1886 the American meteorologist William Ferrel developed<br />
an improved empirical formula for computing water<br />
vapor pressure from dry-bulb and sling-psychrometer-wet-bulb<br />
temperature and barometric pressure. Starting in 1886 the U.S.<br />
Weather Bureau used Ferrel’s formula, his tables, and the sling<br />
(whirled) psychrometer to achieve greater accuracy compared<br />
with Glaisher’s tables and stationary wet-bulb temperature.<br />
Improved tables were prepared for the bureau in 1900 by Professor<br />
Marvin. Willis Carrier probably had a copy of “Marvin’s<br />
<strong>Psychrometric</strong> Tables for Obtaining the Vapor Pressure, Relative<br />
Humidity, and Temperature of the Dew Point (from readings of<br />
the Wet- and Dry-Bulb Thermometers),” U.S. Department of<br />
Commerce Weather Bureau Publication No. 236.<br />
The only psychrometric-like charts prior to Carrier’s 1904<br />
chart were cross plots of the Glaisher or Ferrel empirical tabular<br />
data. A picture of a stationary wet-bulb–dry-bulb instrument<br />
called a Hygrodeik (patented in 1865) appears on the title page.<br />
N o v e m b e r 2 0 0 4 A S H R A E J o u r n a l 1 7<br />
h<br />
v<br />
w<br />
p wv<br />
SI Unit<br />
kJ/kg DA<br />
m 3 /kg DA<br />
kg wv /kg DA<br />
James Apjohn J.F. Daniell Charles LeRoy<br />
Ludwig Achim von Arnim Francesco Eschinardi John Leslie<br />
Richard Assman James Pollard Espy Charles F. Marvin<br />
Ernest Ferdinand August Gabriel Daniel Fahrenheit Edme Mariotte<br />
Amedeo Avogadro William Ferrel Sir Isaac Newton<br />
Carl Wilhelm Böckman Jr. Joseph Louis Gay-Lussac Blaise Pascal<br />
Robert Boyle James Glaisher Joseph Priestly<br />
Auguste Bravais James Hutton Henri Victor Regnault<br />
Table 2: Partial listing of psychrometric pioneers prior to 1900.<br />
Pa<br />
I-P Unit<br />
Btu/lb DA<br />
ft 3 /lb DA<br />
lb wv /lb DA<br />
in. H G or psia<br />
Anders Celsius James Ivory Horace Bénédict de Saussure<br />
Jacques Alexander Cèsar Charles Julius Juhlin C.W. Scheele<br />
John Dalton Antoine Laurent de Lavoisier Evangèlista Torricelli
Willis H. Carrier<br />
President ASRE 1927<br />
President ASHVE 1931<br />
A chart mounted between the two thermometers<br />
included wet-bulb, dry-bulb,<br />
and dew-point temperature, relative humidity,<br />
and the moisture content in units<br />
of grains per cubic foot (Note that 7,000<br />
grains = 1 lb). In addition the chart designated the region to<br />
the left of the 60% RH line as high electric tension and to the<br />
right as low electric tension.<br />
State-of-the-Art in 1901<br />
For starters, the term air conditioning did not exist until<br />
1906 when it was coined by Stuart Cramer, a Charlotte, N.C.,<br />
textile engineer.<br />
The physical and chemical laws governing many of the<br />
phenomena applicable to the atmosphere and the variable<br />
quantity of water vapor associated with the dry air gases of<br />
the atmosphere were only partially understood. The ideal gas<br />
constant, Joule’s equivalent between heat and work, the molar<br />
mass of air, the molar mass of H 2 O, the specifi c heat of dry<br />
air, and the specifi c heat of water vapor were not as accurate<br />
as they are today.<br />
Some of the psychrometric tabular data were based on examinations<br />
of recorded weather data over a period of several years.<br />
Surprisingly, thanks to dedicated meteorologists like Glacier<br />
and Ferrel, the data turned out to be fairly accurate, although<br />
it only covered a limited temperature range.<br />
1904 Carrier <strong>Psychrometric</strong> <strong>Chart</strong><br />
By 1903 Carrier had completed the world’s fi rst scientifi cally<br />
based air-conditioning system specifi cally designed to control<br />
humidity. This required estimates of space heat and moisture gain<br />
and psychrometric properties of moist air. In 1904, to simplify<br />
the task of air-conditioning design, he graphed the data from<br />
Marvin’s tables. This resulted in the basic psychrometric chart<br />
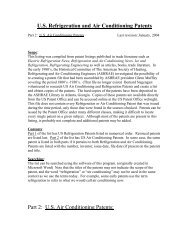
shape as we know it today. Figure 1 is a similar chart to a 1906<br />
Buffalo Air Washer and Humidifi er catalog. Carrier called it a<br />
Figure 1: Willis H. Carrier hygrometric chart, circa 1904–1906.<br />
hygrometric chart, and discussion in the catalog indicated that it<br />
was drawn in 1905. L. Logan Lewis, a coworker, indicated that<br />
the 1905 chart was similar to a much larger blueprint version of<br />
the chart made in 1904. 2 Carrier’s early charts used water vapor<br />
density (grains_WV/ft 3 ) as the ordinate. Water vapor density is<br />
directly proportional to water vapor pressure, which may have<br />
simplifi ed the task of creating the fi rst chart.<br />
Carrier’s choice of plotting coordinates made this chart<br />
nearly ideal for the analysis and plotting of air-conditioning<br />
applications. Dry-bulb temperature lines were vertical with a<br />
uniform scale along the abscissa. The horizontal lines of the<br />
chart represent moisture content expressed in the common<br />
units of the era, grains of moisture per cubic foot of air. The<br />
moisture content scale is uniform along the left ordinate of the<br />
chart. Also shown are percent saturation (now called relative<br />
humidity) curves from 10% to 100% and psychrometer wetbulb<br />
lines in 5°F increments.<br />
<strong>Psychrometric</strong> <strong>Chart</strong> from 1904 to 1911<br />
Between 1908 and 1911, the ordinate was changed to what<br />
is now called humidity ratio (lb WV /lb DA or grains WV /lb DA ),<br />
which was more useful. Humidity ratio is also called moisture<br />
content and some European practitioners call this value<br />
humidity x. To add confusion, this term is sometimes called<br />
specifi c humidity or absolute humidity despite the fact that<br />
the World Meteorological Organization, ASHRAE and most<br />
dictionaries defi ne these terms differently than humidity ratio.<br />
Carrier called this property specifi c humidity, but this was<br />
before scientists redefi ned the term.<br />
The change to humidity ratio (as the chart ordinate) added<br />
these features: (a) psychrometric process lines representing<br />
1 8 A S H R A E J o u r n a l a s h r a e . o r g N o v e m b e r 2 0 0 4
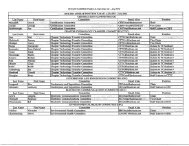
Figure 2: Mollier chart (circa 1923) was one of the early psychrometric charts.<br />
sensible heating or sensible cooling<br />
are horizontal lines at constant moisture<br />
content (these lines were slightly<br />
curved and nearly horizontal with the<br />
former water vapor density ordinate);<br />
and (b) the process lines representing<br />
humidifi cation only (latent heating) or<br />
dehumidifi cation only (latent cooling)<br />
are vertical lines at constant dry-bulb<br />
temperature. These features work well<br />
with space heat gain and heat loss “load”<br />
calculations, which are separated into<br />
sensible and latent components.<br />
As he pursued psychrometrics, Carrier<br />
observed that the empirically determined<br />
wet-bulb temperature in Marvin’s<br />
tables agreed substantially with<br />
his calculated temperature of adiabatic<br />
saturation, (now more commonly called<br />
thermodynamic wet-bulb temperature,<br />
which is frequently shortened to wetbulb<br />
temperature). Thermodynamic<br />
wet-bulb temperature as contrasted<br />
with sling psychrometer wet-bulb temperature<br />
is a thermodynamic property<br />
that is a mathematical function of other<br />
psychrometric properties.<br />
Carrier probably originated the concept<br />
of the adiabatic saturation chamber, which<br />
in simple terms is a very long (think infi -<br />
nite) perfectly insulated watertight air duct<br />
with a layer of liquid water in the bottom<br />
of the level air duct. Entering air with a<br />
relative humidity (RH) less than 100%<br />
traverses the length of the duct exposed<br />
to the surface of water and leaves the duct<br />
at 100% RH (the leaving air is saturated<br />
with water vapor), and as a consequence,<br />
the leaving dry-bulb temperature, thermodynamic<br />
wet-bulb, and dew-point<br />
temperature have the same value.<br />
One other condition is that the temperature<br />
of the water in the duct is at the<br />
wet-bulb temperature of the leaving air.<br />
The apparatus is perfectly insulated and,<br />
thus, there is no heat gain or heat loss to<br />
or from the air passing through the duct or<br />
the water in the duct and, hence, the name<br />
adiabatic (Greek for without transfer of<br />
heat to or from the surroundings).<br />
If air is passed through the duct for a<br />
long period of time, it will be necessary<br />
to replenish the water that has evaporated<br />
into the passing air.<br />
Discerning Types<br />
Of <strong>Chart</strong>s<br />
For those who want to know if<br />
a particular chart uses a dry-bulb<br />
temperature major coordinate or a<br />
skewed specifi c enthalpy major coordinate,<br />
the easiest test is to observe<br />
two vertical dry-bulb temperature lines<br />
that are separated by 30° or 40°.<br />
If the lines diverge slightly as they<br />
extend upwards, then the major coordinate<br />
is specifi c enthalpy.<br />
If all dry-bulb temperature lines are<br />
precisely parallel, the major coordinate<br />
is dry-bulb temperature.<br />
With software, all calculations are<br />
performed using psychrometric algorithms,<br />
and the resultant state points<br />
are plotted on a displayed chart. Many<br />
software-generated charts use vertical<br />
dry-bulb temperature lines to improve<br />
the speed and to avoid slightly jagged<br />
lines. No advantage or disadvantage<br />
exists for one software display over another<br />
because the display is no longer<br />
a calculation tool but just a very good<br />
way to visualize the psychrometric<br />
processes or cycles.<br />
Carrier also observed in tests that the<br />
wet-bulb temperature of the air remained<br />
constant from the entry to the exit of the<br />
adiabatic saturator as more water vapor<br />
entered the air passing along the length<br />
of the saturator.<br />
Mass and energy balances reveal that<br />
the sensible cooling of the air is equal to<br />
the latent heat gain of the air, which is the<br />
product of the mass of water evaporated<br />
and the latent heat of evaporation at the<br />
wet-bulb temperature. Carrier, using low<br />
pressure steam (water vapor) property<br />
tables and knowing barometric pressure,<br />
the adiabatic saturator entering dry-bulb<br />
temperature, and thermodynamic wet-bulb<br />
temperature could then calculate all other<br />
entering psychrometric properties.<br />
Willis Carrier and his associates continued<br />
their psychrometric research for<br />
the remainder of his life (1876-1950). In<br />
1911 Carrier shared his early research<br />
and developments with the rest of<br />
the world in his landmark 49-page<br />
ASME paper No. 1340: Rational <strong>Psychrometric</strong><br />
Formulae.<br />
N o v e m b e r 2 0 0 4 A S H R A E J o u r n a l 1 9
<strong>Chart</strong> from 1911 to 2004<br />
In the 100 years since the fi rst Willis Carrier chart, the science<br />
of psychrometrics has progressed from its infancy to a very<br />
mature science. Many changes have been made to the chart to<br />
improve its usefulness, accuracy and the accuracy of process<br />
plots on the chart.<br />
Through all of these changes, the chart has retained its basic<br />
and familiar form—a testimony to the foresight of its creator.<br />
Advertisement formerly in this space.<br />
ASHVE initially adopted the Carrier chart until 1926 when it<br />
changed to the Bulkely log scale psychrometric chart. In 1938,<br />
ASHVE returned to the Carrier-style chart.<br />
A subtle change to increase the accuracy of process plots and<br />
calculations is the use of a skewed specifi c enthalpy 3 scale to<br />
replace the dry-bulb temperature plotting coordinate. This resulted<br />
in perfectly straight wet-bulb temperature and enthalpy<br />
lines which formerly had a very slight curvature. The dry-bulb<br />
temperature lines are perfectly straight,<br />
but diverge slightly from one another as<br />
the moisture content increases. In 1963<br />
the new ASHRAE psychrometric charts<br />
changed to the humidity ratio—skewed<br />
enthalpy coordinates. 4<br />
This wraps up the history of the fi rst<br />
psychrometric chart. To view 20 other<br />
historical charts including the 1908 Grosvenor<br />
chart, the 1923 Mollier chart, and<br />
the other early psychrometric charts, see<br />
Note 1, Understanding <strong>Psychrometric</strong>s.<br />
These early charts range from those signifi<br />
cantly stretched in one or both directions,<br />
to those using log scales and even<br />
include two triangular shaped charts.<br />
The author has yet to see a circular<br />
chart, but on second thought, the<br />
1862 chart on the title page used 60°<br />
of a circle with the RH lines radiating<br />
from the center at 6° for every 10%<br />
change in RH.<br />
www.info.ims.ca/3261-21 or circle 21<br />
Notes<br />
1. Gatley, Donald P. 2002. Understanding<br />
<strong>Psychrometric</strong>s. 292 p. Atlanta: ASHRAE.<br />
2. Wile, D.D. 1960. “<strong>Psychrometric</strong><br />
charts.” ASHRAE Journal p. 61. March.<br />
3. The use of a skewed plotting coordinate<br />
or grid was conceived by Richard Mollier in<br />
1923 in “Ein neues Diagramm für Dampfl<br />
uftgemische,” in which he introduced the<br />
“h x” moist air chart (h is Mollier’s symbol<br />
for enthalpy; x his symbol for humidity<br />
ratio). Some engineers, scientists and meteorologists<br />
of Northern and Eastern European<br />
Countries use the Mollier h x Enthalpy<br />
– Humidity Ratio chart. This Mollier moist<br />
air chart differs from the ASHRAE chart as<br />
follows: humidity ratio is the abscissa (vertical<br />
grid with horizontal scale) and enthalpy<br />
is the skewed grid with vertical scale. The<br />
accuracy of the two charts is identical. An<br />
ASHRAE chart can be “seen” as a Mollier<br />
h x chart by rotating it 90° counterclockwise,<br />
and observing the image in a mirror.<br />
4. Palmatier, E.P. 1963. “Construction of the<br />
normal temperature ASHRAE psychrometric<br />
chart.” ASHRAE Transactions 69:7–12.<br />
2 0 A S H R A E J o u r n a l a s h r a e . o r g N o v e m b e r 2 0 0 4