POST HARVEST PROFILE OF JOWAR - Agmarknet
POST HARVEST PROFILE OF JOWAR - Agmarknet
POST HARVEST PROFILE OF JOWAR - Agmarknet

Create successful ePaper yourself
Turn your PDF publications into a flip-book with our unique Google optimized e-Paper software.
Country<br />
2.0 PRODUCTION<br />
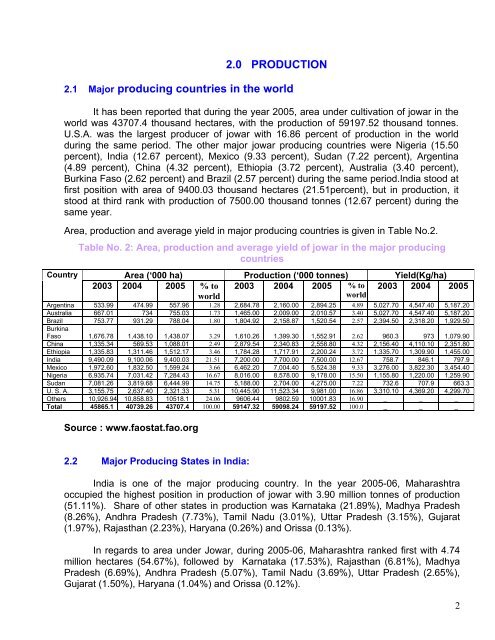
2.1 Major producing countries in the world<br />
It has been reported that during the year 2005, area under cultivation of jowar in the<br />
world was 43707.4 thousand hectares, with the production of 59197.52 thousand tonnes.<br />
U.S.A. was the largest producer of jowar with 16.86 percent of production in the world<br />
during the same period. The other major jowar producing countries were Nigeria (15.50<br />
percent), India (12.67 percent), Mexico (9.33 percent), Sudan (7.22 percent), Argentina<br />
(4.89 percent), China (4.32 percent), Ethiopia (3.72 percent), Australia (3.40 percent),<br />
Burkina Faso (2.62 percent) and Brazil (2.57 percent) during the same period.India stood at<br />
first position with area of 9400.03 thousand hectares (21.51percent), but in production, it<br />
stood at third rank with production of 7500.00 thousand tonnes (12.67 percent) during the<br />
same year.<br />
Area, production and average yield in major producing countries is given in Table No.2.<br />
Table No. 2: Area, production and average yield of jowar in the major producing<br />
countries<br />
Area (‘000 ha) Production (‘000 tonnes) Yield(Kg/ha)<br />
2003 2004 2005 % to 2003 2004 2005 % to 2003 2004 2005<br />
world<br />
world<br />
Argentina 533.99 474.99 557.96 1.28 2,684.78 2,160.00 2,894.25 4.89 5,027.70 4,547.40 5,187.20<br />
Australia 667.01 734 755.03 1.73 1,465.00 2,009.00 2,010.57 3.40 5,027.70 4,547.40 5,187.20<br />
Brazil 753.77 931.29 788.04 1.80 1,804.92 2,158.87 1,520.54 2.57 2,394.50 2,318.20 1,929.50<br />
Burkina<br />
Faso 1,676.78 1,438.10 1,438.07 3.29 1,610.26 1,399.30 1,552.91 2.62 960.3 973 1,079.90<br />
China 1,335.34 569.53 1,088.01 2.49 2,879.54 2,340.83 2,558.80 4.32 2,156.40 4,110.10 2,351.80<br />
Ethiopia 1,335.83 1,311.46 1,512.17 3.46 1,784.28 1,717.91 2,200.24 3.72 1,335.70 1,309.90 1,455.00<br />
India 9,490.09 9,100.06 9,400.03 21.51 7,200.00 7,700.00 7,500.00 12.67 758.7 846.1 797.9<br />
Mexico 1,972.60 1,832.50 1,599.24 3.66 6,462.20 7,004.40 5,524.38 9.33 3,276.00 3,822.30 3,454.40<br />
Nigeria 6,935.74 7,031.42 7,284.43 16.67 8,016.00 8,578.00 9,178.00 15.50 1,155.80 1,220.00 1,259.90<br />
Sudan 7,081.26 3,819.68 6,444.99 14.75 5,188.00 2,704.00 4,275.00 7.22 732.6 707.9 663.3<br />
U. S. A. 3,155.75 2,637.40 2,321.33 5.31 10,445.90 11,523.34 9,981.00 16.86 3,310.10 4,369.20 4,299.70<br />
Others 10,926.94 10,858.83 10518.1 24.06 9606.44 9802.59 10001.83 16.90 _ _ _<br />
Total 45865.1 40739.26 43707.4 100.00 59147.32 59098.24 59197.52 100.0 _ _ _<br />
Source : www.faostat.fao.org<br />
2.2 Major Producing States in India:<br />
India is one of the major producing country. In the year 2005-06, Maharashtra<br />
occupied the highest position in production of jowar with 3.90 million tonnes of production<br />
(51.11%). Share of other states in production was Karnataka (21.89%), Madhya Pradesh<br />
(8.26%), Andhra Pradesh (7.73%), Tamil Nadu (3.01%), Uttar Pradesh (3.15%), Gujarat<br />
(1.97%), Rajasthan (2.23%), Haryana (0.26%) and Orissa (0.13%).<br />
In regards to area under Jowar, during 2005-06, Maharashtra ranked first with 4.74<br />
million hectares (54.67%), followed by Karnataka (17.53%), Rajasthan (6.81%), Madhya<br />
Pradesh (6.69%), Andhra Pradesh (5.07%), Tamil Nadu (3.69%), Uttar Pradesh (2.65%),<br />
Gujarat (1.50%), Haryana (1.04%) and Orissa (0.12%).<br />
2