Bowser Basin Geochemical Survey, North-Central BC: Anomaly
Bowser Basin Geochemical Survey, North-Central BC: Anomaly
Bowser Basin Geochemical Survey, North-Central BC: Anomaly

You also want an ePaper? Increase the reach of your titles
YUMPU automatically turns print PDFs into web optimized ePapers that Google loves.
<strong>Bowser</strong> <strong>Basin</strong> <strong>Geochemical</strong> <strong>Survey</strong>, <strong>North</strong>-<strong>Central</strong> British Columbia:<br />
<strong>Anomaly</strong> Follow-up, 2005<br />
KEYWORDS: geochemistry, <strong>Bowser</strong> <strong>Basin</strong>, regional geochemical<br />
survey, gold anomaly, heavy minerals<br />
INTRODUCTION<br />
Reconnaissance-scale regional drainage surveys carried<br />
out as part of Canada’s National <strong>Geochemical</strong> Reconnaissance<br />
(NGR) program routinely analyze the –80 mesh<br />
(
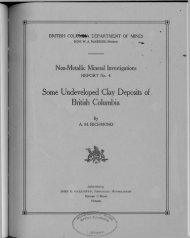
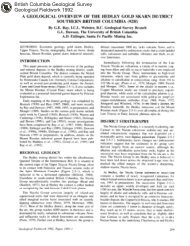
Figure 2. Gold in stream sediments from the <strong>Bowser</strong> Lake – Spatsizi River survey (Friske et al., 2005; Jackaman, 2005) and regional geochemical<br />
surveys covering the adjacent NTS maps sheets 104B and G. Symbols show concentrations at the 90 th ,95 th ,98 th and 99 th percentile<br />
levels.<br />
54 British Columbia Geological <strong>Survey</strong>
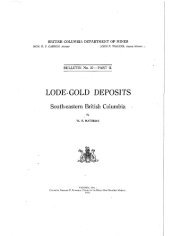
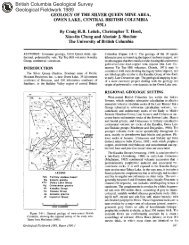
Figure 3. Multielement anomalies, <strong>Bowser</strong> Lake – Spatsizi River survey and regional geochemical surveys covering the adjacent NTS<br />
maps sheets 104B and G. Symbols show samples with As, Sb and Hg all above the 90 th and 95 th percentile levels.<br />
Geological Fieldwork 2005, Paper 2006-1 55
MINFILE, 2005), where disseminated pyrite<br />
and localized chalcopyrite, malachite,<br />
azurite and sphalerite occur in northeasttrending<br />
faults and shears.<br />
Hazelton Group rocks also host the<br />
world-class Eskay Creek Au mine and several<br />
past-producing Au-Cu mines, such as<br />
the Red Cliff, Goat and Roosevelt, located in<br />
the southwestern part of NTS 104A. The<br />
area also has potential for alkalic porphyry<br />
Cu-Mo-Au-Ag deposits similar to Red Chris<br />
(MINFILE 104H 022), epithermal<br />
volcanogenic massive sulphide deposits<br />
and, possibly, sedimentary-exhalitive Pb-Zn<br />
mineralization in <strong>Bowser</strong> Lake sedimentary<br />
rocks.<br />
BOWSER LAKE – SPATSIZI<br />
RIVER REGIONAL SURVEY<br />
RESULTS<br />
Results of a helicopter-supported<br />
stream sediment and water RGS completed<br />
in 2004 were released in August 2005 (Friske<br />
et al., 2005). In total, 1463 stream sediment<br />
and 1458 water samples were collected from<br />
1385 sites covering over 18 500 km 2 at a density<br />
of one sample per 13.5 km 2 . Sediment<br />
samples were analyzed for Ag, Al, As, Au,<br />
Bi, Ba, Br, Ca, Cd, Ce, Co, Cr, Cu, Eu, Fe,<br />
Ga,Hf,Hg,K,La,Lu,Mg,Mn,Mo,Na,Ni,<br />
P, Pb, Rb, S, Sb, Sc, Se, Sm, Sr, Ta, Tb, Te,<br />
Th,Ti,Tl,U,V,W,YbandZnbyacombination<br />
of instrumental neutron activation analysis<br />
(INAA) and aqua regia digestion – inductively<br />
coupled plasma mass spectrometry<br />
(ICP-MS) and for loss-on-ignition (LOI).<br />
Water samples were analyzed for pH, conductivity,<br />
Cl, F, NO3,SO4 and U. Filtered and<br />
acidified water samples from 320 of the sites<br />
were also analyzed for 52 major and trace elements<br />
(Friske et al., 2005; Jackaman,<br />
2005).<br />
Figure 2 is a symbol plot of Au in the –80<br />
mesh fraction of stream sediment samples<br />
from this RGS and from surveys covering the<br />
adjacent NTS 104B and G map sheets<br />
(Matysek et al., 1988a, b). Stream sediment<br />
Au anomalies, where values exceed the 99 th<br />
percentile (>97.5 ppb), cluster in the southwestern<br />
and western parts of the surveyed<br />
area, where the rocks are predominantly<br />
Hazelton Group. Many of the Au anomalies<br />
correspond to areas of known mineralization,<br />
such as those draining the Sulphurets<br />
camp. There are a smaller number of weaker<br />
(22.9–56.5 ppb Au) anomalies in <strong>Bowser</strong><br />
<strong>Basin</strong> drainages, and the largest cluster is located<br />
in the southern part of the <strong>Bowser</strong> Lake<br />
map sheet. Sulphide mineralization typical<br />
of the Eskay Creek deposit is typically enriched<br />
in Hg, As and Sb, among other elements.<br />
Drainage sample sites where As, Sb<br />
and Hg values all exceed the 80 th and 90 th<br />
TABLE 1. STATISTICS AND CONTRAST FOR AU, AG, AS AND HG IN –80 AND<br />
–230 MESH FRACTION OF STREAM SEDIMENT BASED ON GEOCHEMICAL<br />
DATA FOR 46 SAMPLES. CONTRAST = MAXIMUM/MEDIAN<br />
Element Mean Median<br />
Third<br />
Quartile Maximum<br />
95th<br />
Percentile Contrast<br />
Ag-80_MS 3752 264 686 >100000 2050 378<br />
Ag-230_MS 4384 361 1098 >100000 3622 277<br />
As-80_MS 46.2 17.0 40.8 623.5 161.6 37<br />
As-230_MS 63.5 22.5 61.8 809.9 223.9 36<br />
As-80_NA 10.8 13.5 30.8 91.6 67.7 7<br />
As-230_NA 18.2 15.5 41.3 96.2 89.6 6<br />
Au-80_MS 63.1 2.2 5.5 2138.5 45.8 972<br />
Au-230_MS 140.8 1.8 6.9 4431.0 224.7 2461<br />
Au-80_NA 178 6 14 5840 318 1062<br />
Au-230_NA 236 8 25 6440 257 805<br />
Hg-80_MS 2620 105 158 86756 2251 326<br />
Hg-230_MS 3009 144 200 98406 2507 492<br />
TABLE 2. STATISTICS CALCULATED FROM SELECTED ELEMENT DATA IN<br />
–80 MESH FRACTION OF 37 STREAM SEDIMENT SAMPLES.<br />
ABBREVIATIONS: ICP-MS, AQUA REGIA DIGESTION – INDUCTIVELY<br />
COUPLED PLASMA MASS SPECTROMETRY; INAA, INSTRUMENTAL<br />
NEUTRON ACTIVATION ANALYSIS; GRAV, LOSS-ON-IGNITION AT 550C<br />
Element Units Det.<br />
Limit<br />
Method Mean Median<br />
Third<br />
Quartile Maximum<br />
Ag ppb 2 ICP-MS 4464 237 419 >100000<br />
As ppm 0.1 ICP-MS 28.1 15.5 36.7 167.5<br />
As ppm 0.5 INAA 15.7 19.0 42.0 91.6<br />
Au ppb 0.2 ICP-MS 76.9 2.2 4.8 2138.5<br />
Au ppb 2 INAA 223 7 21 5840<br />
Ba ppm 50 INAA 1392 1100 1500 3800<br />
Bi ppm 0.02 ICP-MS 0.19 0.11 0.16 1.72<br />
Br ppm 0.5 INAA 3.6 1.0 5.3 16.0<br />
Cd ppm 0.01 ICP-MS 1.95 0.57 0.86 18.14<br />
Co ppm 0.1 ICP-MS 18.2 17.4 21 25.8<br />
Co ppm 5 INAA 19 18 23 34<br />
Cr ppm 0.5 ICP-MS 41.9 30.9 54.8 103.4<br />
Cr ppm 2 INAA 149 120 210 630<br />
Cu ppm 0.01 ICP-MS 68.58 51.58 63.0 495.99<br />
Fe % 0.01 ICP-MS 4.37 4.18 4.82 7.46<br />
Fe % 0.02 INAA 5.30 4.90 5.90 9.20<br />
Ga ppm 0.2 ICP-MS 5.2 5.0 5.5 10.9<br />
Hg ppb 5 ICP-MS 3236 104 219 86756<br />
LOI % 0.1 Grav 5.45 4.30 6.80 14.50<br />
Mn ppm 1 ICP-MS 1036 942 1258 2057<br />
Mo ppm 0.01 ICP-MS 3.25 1.81 2.80 23.38<br />
Ni ppm 0.1 ICP-MS 60.9 57.3 94.9 147.3<br />
Pb ppm 0.01 ICP-MS 66.90 9.82 20.0 1453.11<br />
S % 0.02 ICP-MS 0.29 0.16 0.32 2.56<br />
Sb ppm 0.02 ICP-MS 29.18 1.34 3.59 762.60<br />
Sb ppm 0.1 INAA 40.5 2.3 6.8 1050.0<br />
Se ppm 0.1 ICP-MS 2.1 1.0 1.9 21.4<br />
Te ppm 0.02 ICP-MS 0.08 0.05 0.1 0.87<br />
Th ppm 0.1 ICP-MS 1.2 1.2 1.3 2.0<br />
Th ppm 0.2 INAA 4.1 3.9 4.9 8.0<br />
Tl ppm 0.02 ICP-MS 0.28 0.13 0.24 1.67<br />
U ppm 0.1 INAA 2.4 2.4 2.8 7.2<br />
V ppm 2 ICP-MS 65 54 70 191<br />
Zn ppm 0.1 ICP-MS 322.1 136.4 176.3 3763.2<br />
56 British Columbia Geological <strong>Survey</strong>
TABLE 3. STATISTICS CALCULATED FROM SELECTED<br />
ELEMENT DATA FROM 35 HEAVY MINERAL<br />
CONCENTRATES ANALYZED BY AQUA REGIA DIGESTION<br />
ICP-MS AND 26 HEAVY MINERAL CONCENTRATES<br />
ANALYZED BY INAA. ABBREVIATIONS: ICP-MS, AQUA<br />
REGIA DIGESTION – INDUCTIVELY COUPLED PLASMA<br />
MASS SPECTROMETRY; INAA, INSTRUMENTAL NEUTRON<br />
ACTIVATION ANALYSIS<br />
Element Units Method Median<br />
Third<br />
Quartile Maximum<br />
Ag ppb ICP-MS 4499 8145 >100000<br />
As ppm ICP-MS 241.5 484.5 1737.8<br />
As ppm INAA 279.5 523.0 1570<br />
Au ppb ICP-MS 437.4 2301.9 >100000<br />
Au ppb INAA 3095 8438 161000<br />
Ba ppm ICP-MS 31.4 76.7 4289.9<br />
Ba ppm INAA 18250 32625 92100<br />
Bi ppm ICP-MS 0.54 1.85 10.94<br />
Cd ppm ICP-MS 2.59 8.34 310<br />
Co ppm ICP-MS 79.1 113.15 577.9<br />
Co ppm INAA 81 143 615<br />
Cr ppm ICP-MS 21.3 52.7 258.7<br />
Cr ppm INAA 500 1225 46100<br />
Cu ppm ICP-MS 337.05 765.47 >10000<br />
Fe % ICP-MS 16.28 25.25 40<br />
Fe % INAA 28.7 33.3 41.4<br />
Hg ppb ICP-MS 1869 5257 >100000<br />
Mn ppm ICP-MS 1096 2162 25909<br />
Mo ppm ICP-MS 9.9 16.34 101.45<br />
Mo ppm INAA 6 10 87<br />
Ni ppm ICP-MS 94 239.2 793.2<br />
Ni ppm INAA 71 95 730<br />
S % ICP-MS 5.79 10 10<br />
Sb ppm ICP-MS 12.41 24.79 2000<br />
Sb ppm INAA 21.8 52.7 33000<br />
Se ppm ICP-MS 10.8 17.65 100<br />
Te ppm ICP-MS 0.18 0.7 4.17<br />
Tl ppm ICP-MS 0.5 1.28 19.61<br />
V ppm ICP-MS 80 160 361<br />
W ppm ICP-MS 0.9 4.8 58.3<br />
W ppm INAA 4 15.5 98<br />
Zn ppm ICP-MS 374.3 1077.8 >10000<br />
Zn ppm INAA 460 1100 116000<br />
percentile levels are identified in Figure 3. Data used to create<br />
this map were combined from those reported in RGS 58<br />
(Friske et al., 2005) and results of the 104B and G sediment<br />
sample reanalysis previously reported by Lett and<br />
Jackaman (2003). Although most sites with this element<br />
signature are from streams draining the Hazelton Group,<br />
there are several anomalous drainages in the southeastern<br />
part of the <strong>Bowser</strong> Lake sheet (NTS 104A) underlain by<br />
sedimentary rocks.<br />
FOLLOW-UP SAMPLING<br />
Sample Collection<br />
During the summers of 2004 and 2005, stream sediment,<br />
bulk sediment samples (for preparation of HMCs)<br />
and stream water samples were collected at 44 sites in NTS<br />
areas 104A, 104B and 104G. Information about the site,<br />
such as sediment texture, drainage size and water flow was<br />
recorded. Sediment typical of that collected during a reconnaissance-scale<br />
geochemical survey was taken from mid<br />
and lateral bars in active stream channels at locations selected<br />
to avoid high or low-energy extremes. Where abundant,<br />
living moss attached to boulders and logs from just<br />
above the stream high-water mark was also collected.<br />
Stream sediment and moss samples were stored in highwet-strength<br />
Kraft paper sample bags for shipment to a<br />
commercial laboratory.<br />
Ideally, sediment for preparation of a HMC fraction<br />
was taken at the upstream point of midchannel bars. At each<br />
site, a 5 gallon plastic pail was lined with a heavy-duty<br />
polyethyleneplasticbag(18x24inches,4mil)andsediment<br />
was wet sieved through a 12-mesh (1.68 mm) stainless<br />
steel sieve until a sample weight of 10–15 kg was obtained.<br />
The sample was weighed in the pail before the<br />
opening was taped shut with black plastic tape and placed<br />
in a second bag.<br />
Water was also collected at each site in a rinsed<br />
Nalgene ® bottle, and the pH and conductivity were measured<br />
within twenty-four hours. Later, a portion of the water<br />
sample was filtered through a 0.45 m glass-fibre filter<br />
and the filtered water acidified to pH 2 with ISTAR ® nitric<br />
acid.<br />
Sample Preparation and Analysis<br />
Fine-textured sediment and moss samples were air<br />
dried and the –18 mesh (
TABLE 4. ENHANCED (>3 RD QUARTILE) CONCENTRATIONS OF ELEMENTS IN THE –80 MESH<br />
FRACTION OF STREAM SEDIMENT AND ELEMENTS ELEVATED IN STREAM WATER SAMPLES<br />
COLLECTED IN 2004. ABBREVIATION: REE, RARE EARTH ELEMENTS (E.G., DY, ER, EU)<br />
Year Map<br />
Sheet Site<br />
plasma mass spectrometry at the Geological <strong>Survey</strong> of<br />
Canada, Ottawa.<br />
DETAILED SAMPLING RESULTS<br />
Size Fraction Chemistry<br />
Element concentrations in the –230 mesh size fraction<br />
of sediment samples are typically higher than in the –80<br />
mesh fraction. For some elements, such as V and Cr, the difference<br />
in median for the two size fraction populations is in<br />
the order of 10%. Other elements, such Au, Ag, As and Hg,<br />
have larger median differences (Table 1). Based on a population<br />
size of 46 samples, the Au median (INAA) for the –<br />
230 mesh fraction is 8 ppb, compared to 6 ppb for the –80<br />
mesh fraction. Table 1 also compares anomaly contrast<br />
(maximum/median) for As, Ag, Au and Hg in the two size<br />
fractions. Arsenic contrast is almost identical for the two<br />
size fractions, whereas Au by aqua regia ICP-MS and Hg<br />
show a greater anomaly contrast for the –230 mesh fraction.<br />
Gold by INAA and Ag by aqua regia ICP-MS show larger<br />
Elements Enhanced ( >3rd Quartile) in<br />
80 Mesh Fraction of Sediment<br />
Elements Elevated<br />
in Stream Water<br />
2004 104A 7002 Mo<br />
2004 104A 7003<br />
2004 104A 7004<br />
2004 104A 7005 Pb, As, Bi<br />
2004 104A 7006 Cd, Pb<br />
2004 104A 7007<br />
2004 104A 7008<br />
2004 104A 7009<br />
2004 104A 7010<br />
2004 104A 7011 Mo<br />
2004 104B 7002 Au, Ag, Cd, Hg, Mo, Pb, Sb Sb<br />
2004 104B 7003 Cd, Pb<br />
2004 104B 7004 Bi<br />
2004 104B 7005 Au, As. Bi<br />
2004 104B 7006 Bi<br />
2004 104B 7007<br />
2004 104B 7008<br />
2004 104B 7009 Au, Ag, Bi, Cd, Cu, Hg, Mo, Pb, Sb, Zn Sb<br />
2004 104B 7010 Au, Ag, Bi, Cd, Cu, Hg, Mo, Pb, Sb, Se, Tl, Zn Pb, Sb, Tl<br />
2004 104B 7011 Au, Ag, Bi, Cd, Cu, Hg, Mo, Pb, Sb, Se, Tl, Zn<br />
2004 104B 7012 Au, Ag, Bi, Cd, Hg, Mo, Pb, Sb, Tl, Zn Zn<br />
2004 104B 7013 Ag, Bi, Cd, Hg, Mo, Pb, Sb, Zn<br />
2004 104B 7014 Cu, Hg, Pb<br />
2004 104B 7015 Au, Ag, Bi, Cd, Hg, Mo, Pb, Sb, Zn Zn<br />
2004 104B 7016<br />
2004 104B 7017 Au, Cu<br />
2004 104B 7018 As, Bi, Cu<br />
2004 104G 7002 Au, As. Cu, Hg, Sb<br />
2004 104G 7003<br />
2004 104G 7004<br />
2004 104G 7005 Au, Cd, Mo, Tl, Zn<br />
2004 104G 7006 Au. Cu, Mo Al<br />
2004 104G 7007 Au, Ag, Bi, Hg, Mo, Pb, Sb, Tl Al, Cd, Cu, Zn, REE<br />
contrast for the –80 mesh fraction. Depending on the analytical<br />
method, the –230 mesh fraction may have an<br />
advantage for improving anomaly contrast for Au and Hg,<br />
but not necessarily for other elements. Also, there are limitations<br />
to using the –230 mesh fraction, such as the need to<br />
collect a larger sample for screening enough material for<br />
analysis and the problem of levelling geochemical data<br />
produced from the –80 and –230 mesh fractions.<br />
Multielement Associations in Sediment and<br />
Heavy Mineral Concentrates<br />
The multielement signature of stream sediment and<br />
HMC anomalies can help characterize the source mineralization.<br />
Tables 2 and 3 list 3 rd quartile values for selected elements<br />
calculated from the combined 2004 and 2005 –80<br />
mesh sediment data and the 2004 HMC results. The 3 rd<br />
quartile, rather than the more traditional 95 th percentile, has<br />
been used as a threshold because it may be a more realistic<br />
value, given the small number of samples. Detection limit<br />
and mean, median and maximum concentrations are given<br />
in Table 2 for elements determined by aqua regia ICP-MS<br />
58 British Columbia Geological <strong>Survey</strong>
Year<br />
Number of Visible Gold Grains<br />
Total Reshaped Modified Pristine<br />
2004 104A 7002 0 0 0 0<br />
2004 104A 7003 0 0 0 0<br />
2004 104A 7004 0 0 0 0<br />
2004 104A 7005 Au, Ag, As, Bi, Pb, Tl 9 6 2 1<br />
2004 104A 7006 Bi, Pb 0 0 0 0<br />
2004 104A 7007 Cd, Mo, Se 0 0 0 0<br />
2004 104A 7008 Bi, Cu, Mo, Se 0 0 0 0<br />
2004 104A 7009 Cd, Zn 0 0 0 0<br />
2004 104A 7010 Mo 0 0 0 0<br />
2004 104A 7011 Hg 0 0 0 0<br />
2004 104B 7002 Ag, Sb 0 0 0 0<br />
2004 104B 7003 Hg 0 0 0 0<br />
2004 104B 7004 Cd, Cu, Se, Zn 0 0 0 0<br />
2004 104B 7005 As, Sb, Pb 30 20 4 6<br />
2004 104B 7006 Au, Bi 177 145 9 23<br />
2004 104B 7007 Au, Se, Bi 7 5 1 1<br />
2004 104B 7008 Au, Ag, Cu 2 2 0 0<br />
2004 104B 7009 Au, Ag, Bi, Cd, Cu, Hg, Mo, Pb, Sb, Se, Tl, Zn 70 19 13 38<br />
2004 104B 7010 Au, Ag, Bi, Cd, Cu, Hg, Mo, Pb, Sb, Se, Tl, Zn 413 204 0 209<br />
2004 104B 7011 Cd, Cu, Hg, Mo, Pb, Sb, Se, Tl, Zn 36 4 0 32<br />
2004 104B 7012 Au, Ag, Cd, Hg, Mo, Pb, Sb, Tl, Zn 0 0 0 0<br />
2004 104B 7013 Ag, Cd, Cu, Hg, Mo, Pb, Sb, Tl, Zn 1 1 0 0<br />
2004 104B 7014 Cd, Cu, Mo, Pb, Sb, Tl 0 0 0 0<br />
2004 104B 7015 Ag, As, Cu, Cd, Mo, Se , Zn 0 0 0 0<br />
2004 104B 7016 0 0 0 0<br />
2004 104B 7017 Sb 0 0 0 0<br />
2004 104B 7018 As, Bi, Se 2 2 0 0<br />
2004 104G 7002 Au 1 1 0 0<br />
2004 104G 7003 0 0 0 0<br />
2004 104G 7004 0 0 0 0<br />
2004 104G 7005 Mo 1 1 0 0<br />
2004 104G 7006 As 2 1 0 1<br />
2004 104G 7007 Ag, As, Bi, Hg, Sb, Se, Tl 2 2 0 0<br />
Map<br />
Sheet Site<br />
TABLE 5. ENHANCED (>3<br />
Elements Enhanced (>3rd Quartile) in<br />
Sediment Heavy Mineral Concentrates<br />
RD QUARTILE) ELEMENTS IN THE 100 000 ppb reflects concentrations in excess of<br />
the ICP-MS upper limit.<br />
Tables 4 and 5 list samples and corresponding elements<br />
that are above the 3 rd quartile for the –80 mesh fraction<br />
(Table 4) and the 3 RD QUARTILE) ELEMENTS IN THE<br />
MINUS 80 MESH FRACTION OF STREAM SEDIMENT<br />
SAMPLES COLLECTED IN 2005<br />
Year Map<br />
Sheet<br />
Site Elements enhanced ( > 3rd Quartile) in<br />
the minus 80 mesh fraction of sediment<br />
2005 104A 1002<br />
2005 104A 1003 Mo<br />
2005 104A 1004 Ag, Cd, Se, Tl<br />
2005 104A 1005<br />
2005 104A 1006 Ag, Bi. Cd, Cu, Pb, Sb, Zn<br />
2005 104A 1007 Ag, Bi, Cu, Pb, Zn<br />
2005 104A 1008 Au, Ag, As, Bi, Cd, Cu, Pb, Sb, Zn<br />
2005 104A 1009 Au, Ag, As, Bi, Cd, Cu, Pb, Sb, Zn<br />
2005 104A 1010 Au, Ag, As, Bi, Cd, Cu, Pb, Sb, Zn<br />
2005 104A 1011 Ag, As, Cd, Pb<br />
2005 104A 1012 Au, Ag, As, Bi, Cd, Cu, Pb, Sb, Zn<br />
2005 104A 1013<br />
2005 104B 1002 Bi<br />
Geological Fieldwork 2005, Paper 2006-1 59
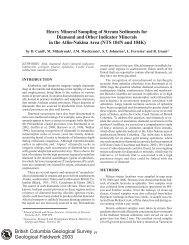
Figure 4. Mineral deposit and detailed sample locations discussed in the paper are identified on the map.<br />
60 British Columbia Geological <strong>Survey</strong>
streams closer to the Eskay Creek mine suggests a similar<br />
epithermal mineral source for these anomalies. <strong>North</strong>west<br />
of the mine, sediment from a creek draining the area surrounding<br />
the Iskut Palmiere prospect contains 177 visible<br />
gold grains (Lett, at al., 2005). Amore detailed examination<br />
of the chemistry and mineralogy of this sediment reveals a<br />
significant number of pristine gold grains in the HMC (i.e.,<br />
local source) and that Bi is the common anomalous element<br />
in both HMC and sediment. There are several single or<br />
multielement anomalies in the northwestern part of the follow-up<br />
survey area. Among them is sample 104G 7007,<br />
which has a distinct Au, Ag, As, Bi, Hg, Sb, Se and Tl association<br />
in sediment and HMC, and elevated Al, Cd, Cu, Zn<br />
and rare earth elements in the stream water. The source of<br />
this sediment-water geochemical anomaly may be Ag-Pb-<br />
Zn epithermal vein mineralization at prospects near the<br />
sample site, such as the Hank (MINFILE 104G07) and the<br />
MAL (MINFILE 104G147) prospects.<br />
Sample 104A7005, located in the southwestern corner<br />
of the <strong>Bowser</strong> Lake map sheet (104A), has anomalous Au,<br />
Ag, As, Bi, Pb and Tl in the HMC and anomalous Pb, As<br />
and Bi in the sediment. This anomaly can be explained by<br />
geochemical dispersion from the past-producing Goat Ag-<br />
Pb-Zn-Au mine (MINFILE 104A02), located about 10 km<br />
upstream from the sample site. There are several sediment<br />
anomalies (e.g.. 104A 7007, 7008 and 7009) about 10 km<br />
northeast of the Goat deposit in an area underlain by <strong>Bowser</strong><br />
Group sedimentary rocks. Among the elements characterizing<br />
these anomalies are Bi, Cd, Cu, Mo, Pb, Se and Zn.<br />
One possible source for these metals may be metal-rich<br />
shale.<br />
Table 6 lists elements above the 3 rd quartile for the –80<br />
mesh fraction of sediment samples collected in 2005. Currently,<br />
no HMC or water geochemical data are available for<br />
the 2005 samples. However, water SO4 was measured in the<br />
field using a Hach model SF-1 test kit. Several<br />
multielement anomalies defined by a 3 rd quartile threshold<br />
are revealed in the –80 mesh fraction of the sediment. A<br />
number of these (i.e., 2005104A 1008,1009,1012), located<br />
in the southwestern part of NTS 104A in an area underlain<br />
by <strong>Bowser</strong> Group sedimentary rocks, have a similar Au,<br />
Ag, As, Bi, Cd, Cu, Pb, Sb and Zn signature. There are currently<br />
no known sulphide mineral occurrences in the area.<br />
Among a cluster of anomalies in the northeastern part of the<br />
detailed survey area are one site (2005104A 1004) with a<br />
Ag, Cd, Se and Tl signature (Table 6), and three sites<br />
(2005104A 1002, 1005, 1013) with more than 50 ppm SO4<br />
in weakly alkaline water, but no corresponding elevated<br />
metal concentrations in the sediment. These samples are<br />
from streams draining the north side of the Oweegee Dome.<br />
The Delta 2 showing (MINFILE 104A166) is roughly<br />
10 km to the south, but no mineralization has been found in<br />
the immediate area of the water anomalies.<br />
CONCLUSIONS<br />
Recently published regional stream sediment survey<br />
data for the <strong>Bowser</strong> <strong>Basin</strong> – Spatsizi River area reveals that<br />
most of the Au and pathfinder As-Sb-Hg element anomalies<br />
are in streams draining Hazelton Group rocks. However,<br />
there are also several weaker anomalies in drainages<br />
within the sedimentary <strong>Bowser</strong> <strong>Basin</strong>. Although many of<br />
the Hazelton anomalies can be traced to known base-precious<br />
metal mineralization, those in the <strong>Bowser</strong> <strong>Basin</strong> are<br />
still unexplained.<br />
Detailed geochemical studies reveal a multielement<br />
Au, Ag, Bi, Cd, Cu, Hg, Mo, Pb, Sb, Se, Tl and Zn signature<br />
in the sediments and HMCs from streams draining the area<br />
around the Eskay Creek Au mine. The pristine shape of<br />
gold grains suggests a relatively local source for the grains.<br />
Stream waters typically have elevated Sb levels. A smaller<br />
Ag,As,Bi,Hg,Sb,Se,TlAu element association characterizes<br />
sediment and HMC anomalies in streams draining<br />
other areas with known mineralization to the north of the<br />
Eskay Creek mine.<br />
Heavy mineral geochemistry and the use of a smaller<br />
size fraction (–230 mesh) complements routine reconnaissance-scale<br />
regional geochemical surveys based on analysis<br />
of the –80 mesh fraction.<br />
ACKNOWLEDGMENTS<br />
Advice and assistance from Brian Grant during the<br />
fieldwork was very much appreciated. The authors would<br />
also like to thank Derek Weismiller of Lakelse Air for helicopter<br />
support, and the manager and staff of the Bell 2<br />
Lodge for their hospitality. Acme Analytical Laboratories<br />
Ltd., Vancouver prepared the stream sediment samples and<br />
Overburden Drilling Management, Nepean, Ontario processed<br />
the heavy mineral concentrates.<br />
REFERENCES<br />
Alldrick, D., Jackaman, W. and Lett, R.E.W. (2004): Compilation<br />
and analysis of regional geochemical surveys around the<br />
<strong>Bowser</strong> <strong>Basin</strong>; in Geological Fieldwork 2003, <strong>BC</strong> Ministry<br />
of Energy, Mines and Petroleum Resources, Paper 2004-1,<br />
pages 163–166.<br />
Alldrick, D., Nelson, J.L and Barresi, T. (2005): Geology and mineral<br />
occurrences of the upper Iskut River area — tracking the<br />
Eskay Rift through northern British Columbia; in Geological<br />
Fieldwork 2004, <strong>BC</strong> Ministry of Energy, Mines and Petroleum<br />
Resources, Paper 2005-1, pages 1–30.<br />
Ferri. F, Osadetz. K and Evenchick, C. (2004): Petroleum source<br />
rock potential of Lower to Middle Jurassic clastic<br />
intermountain basins, British Columbia; in Summary of Activities<br />
2004, <strong>BC</strong> Ministry of Energy, Mines and Petroleum<br />
Resources, pages 87–96.<br />
Friske, P.W.B., Jackaman, W., Lett, R.E.W. and McCurdy, M.W.<br />
(2005): Regional stream sediment and water geochemical<br />
data, northwestern British Columbia, Geological <strong>Survey</strong> of<br />
Canada, Open File 5000, <strong>BC</strong> Ministry of Energy, Mines and<br />
Petroleum Resources, RGS Open File 58<br />
Holland, S.S. (1964): Landforms of British Columbia; <strong>BC</strong> Ministry<br />
of Energy, Mines and Petroleum Resources, Bulletin 48,<br />
138 pages.<br />
Jackaman, W. (2005) Spatsizi River stream sediment and water<br />
survey; in Geological Fieldwork 2004, <strong>BC</strong> Ministry of Energy,<br />
Mines and Petroleum Resources, Paper 2005-1, pages<br />
221–224.<br />
Lett, R.E.W. and Jackaman, W. (2003): Re-analysis of regional<br />
stream sediment survey samples from the Iskut River area<br />
(NTS 104B and G); <strong>BC</strong> Ministry of Energy, Mines and Petroleum<br />
Resources, Geofile 2003-20, 14 pages.<br />
Lett, R.E.W., Friske, P.W.B. and Jackaman, W. (2005): National<br />
<strong>Geochemical</strong> Reconnaissance Program in northwestern <strong>BC</strong>:<br />
<strong>Bowser</strong> Lake (NTS 104A) regional geochemical survey; <strong>BC</strong><br />
Ministry of Energy, Mines and Petroleum Resources, Paper<br />
2005-1, pages 61–66.<br />
Matysek, P.F., Day, S.J., Gravel, J.L. and Jackaman, W. (1988a):<br />
1987 regional geochemical survey: 104F (Sumdum) and<br />
Geological Fieldwork 2005, Paper 2006-1 61
104G (Telegraph Creek): <strong>BC</strong> Ministry of Energy, Mines and<br />
Petroleum Resources, RGS 19, Geological <strong>Survey</strong> of Canada,<br />
Open File 1646.<br />
Matysek, P.F., Day, S.J., Gravel, J.L. and Jackaman, W. (1988b):<br />
1987 regional geochemical survey: 104B (Iskut River); <strong>BC</strong><br />
Ministry of Energy, Mines and Petroleum Resources, RGS<br />
18, Geological <strong>Survey</strong> of Canada, Open File 1645.<br />
MINFILE (2005): MINFILE <strong>BC</strong> mineral deposits database; <strong>BC</strong><br />
Ministry of Energy, Mines and Petroleum Resources,<br />
<br />
[Nov 2005].<br />
62 British Columbia Geological <strong>Survey</strong>