Q3 2012 Financial Statements - Sheng Siong
Q3 2012 Financial Statements - Sheng Siong
Q3 2012 Financial Statements - Sheng Siong

You also want an ePaper? Increase the reach of your titles
YUMPU automatically turns print PDFs into web optimized ePapers that Google loves.
SHENG SIONG GROUP LTD<br />
Third Quarter <strong>Financial</strong> Statement<br />
PART 1- INFORMATION REQUIRED FOR ANNOUNCEMENTS OF QUARTERLY (Q1, Q2,<br />
<strong>Q3</strong>), HALF-YEAR AND FULL YEAR ANNOUNCEMENTS<br />
1(a)(i) An income statement (for the group) together with a comparative statement for the<br />
corresponding period of the immediately preceding financial year.<br />
UNAUDITED CONSOLIDATED STATEMENT OF COMPREHENSIVE INCOME<br />
GROUP GROUP<br />
3 months ended 9 months ended<br />
30 September 30 September<br />
<strong>2012</strong> 2011 <strong>2012</strong> 2011<br />
S$’000 S$’000 +/ (-) S$’000 S$’000 +/ (-)<br />
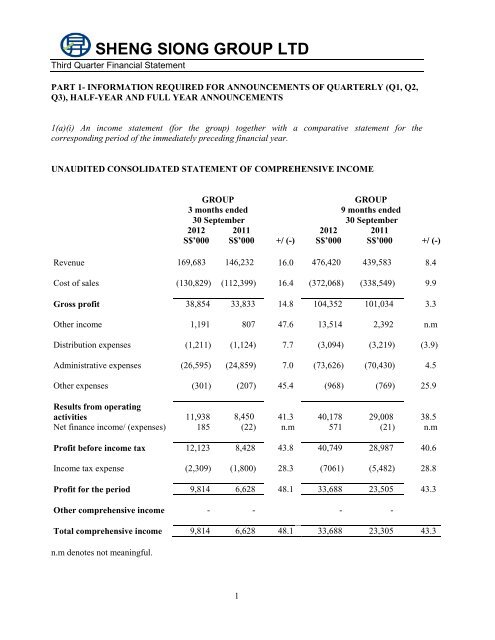
Revenue 169,683 146,232 16.0 476,420 439,583 8.4<br />
Cost of sales (130,829) (112,399) 16.4 (372,068) (338,549) 9.9<br />
Gross profit 38,854 33,833 14.8 104,352 101,034 3.3<br />
Other income 1,191 807 47.6 13,514 2,392 n.m<br />
Distribution expenses (1,211) (1,124) 7.7 (3,094) (3,219) (3.9)<br />
Administrative expenses (26,595) (24,859) 7.0 (73,626) (70,430) 4.5<br />
Other expenses (301) (207) 45.4 (968) (769) 25.9<br />
Results from operating<br />
activities 11,938 8,450 41.3 40,178 29,008 38.5<br />
Net finance income/ (expenses) 185 (22) n.m 571 (21) n.m<br />
Profit before income tax 12,123 8,428 43.8 40,749 28,987 40.6<br />
Income tax expense (2,309) (1,800) 28.3 (7061) (5,482) 28.8<br />
Profit for the period 9,814 6,628 48.1 33,688 23,505 43.3<br />
Other comprehensive income - - - -<br />
Total comprehensive income 9,814 6,628 48.1 33,688 23,305 43.3<br />
n.m denotes not meaningful.<br />
1
SHENG SIONG GROUP LTD<br />
Third Quarter <strong>Financial</strong> Statement<br />
1(a)(ii) Notes to the statement of comprehensive income<br />
GROUP GROUP<br />
3 months ended 9 months ended<br />
30 September 30 September<br />
<strong>2012</strong> 2011 <strong>2012</strong> 2011<br />
S$’000 S$’000 S$’000 S$’000<br />
Depreciation of property, plant and<br />
equipment 2,058 1,857 [1] 5,900 3,997<br />
Exchange (gain)/loss net 52 (106) (15) (156)<br />
Loss (gain) on disposal of property, plant<br />
and equipment (111) 26 (92) 29<br />
Other income:<br />
Rental received 329 287 [2] 850 786<br />
Sale of scrap materials 242 302 725 839<br />
Government grants 290 - [3] 353 -<br />
Gain on disposal of Leasehold Property - - [4] 10,465 -<br />
Miscellaneous income 330 218 1,121 767<br />
1,191 807 13,514 2,392<br />
Net finance income/(expenses):<br />
Interest income 185 1 571 2<br />
Interest expenses - (23) - (23)<br />
GROUP GROUP<br />
3 months ended 9 months ended<br />
30 September 30 September<br />
<strong>2012</strong> 2011 <strong>2012</strong> 2011<br />
Tax S$’000 S$’000 S$’000 S$’000<br />
Under provision in respect of<br />
Prior years - 158 [5] 1,626 158<br />
2
SHENG SIONG GROUP LTD<br />
Third Quarter <strong>Financial</strong> Statement<br />
Notes<br />
1. The increase in depreciation was attributable mainly to the new office and distribution<br />
centre in Mandai Link, which was completed in May 2011.<br />
2. Rental received was from the leasing of excess space at our supermarket outlets. The<br />
increase was due to upward revisions in monthly rent.<br />
3. The government grants were mainly from SPRING Singapore for a productivity<br />
improvement project. This project involved computerisation and streamlining of our<br />
workflow for the purchase of seafood.<br />
4. The gain relates to the sale of our old warehouse at 3000 Marsiling Road (“Leasehold<br />
property”), which was no longer needed after the Group moved to the new distribution<br />
centre in July 2011. The sale was completed in the first quarter of <strong>2012</strong>.<br />
5. This amount of $1.6m relates to the tax on the gain on disposal of available for sale<br />
investment in FY2010, which was previously deemed as capital in nature.<br />
3
SHENG SIONG GROUP LTD<br />
Third Quarter <strong>Financial</strong> Statement<br />
1(b)(i) CONSOLIDATED STATEMENT OF FINANCIAL POSITION<br />
GROUP COMPANY<br />
30 Sep <strong>2012</strong> 31 Dec 2011 30 Sep <strong>2012</strong> 31 Dec 2011<br />
S$’000 S$’000 S$’000 S$’000<br />
Non-current assets<br />
Property, plant and equipment 71,650 72,095 - -<br />
Investment in subsidiaries - 78,234 78,234<br />
71,650 72,095 78,234 78,234<br />
Current assets<br />
Inventories 34,217 36,427 - -<br />
Trade and other receivables 10,840 6,959 48,815 43,728<br />
Cash and cash equivalents 107,226 122,120 30,974 60,212<br />
Asset classified as held for sale - 3,584 - -<br />
152,283 169,090 79,789 103,940<br />
Total assets 223,933 241,185 158,023 182,174<br />
Equity attributable to equity<br />
holders of the Company<br />
Share capital 156,349 156,349 156,349 156,349<br />
Merger reserve (68,234) (68,234) - -<br />
Accumulated profits 55,574 60,210 1,374 25,595<br />
Total equity 143,689 148,325 157,723 181,944<br />
Non-current liabilities<br />
Deferred tax liabilities 1,446 1,075 - -<br />
1,446 1,075 - -<br />
Current liabilities<br />
Trade and other payables 71,930 83,362 238 230<br />
Current tax payable 6,868 8,423 62 -<br />
78,798 91,785 300 230<br />
Total liabilities 80,244 92,860 300 230<br />
Total equity and liabilities 223,933 241,185 158,023 182,174<br />
1(b)(ii) Aggregate amount of Group’s borrowings and debt securities<br />
The Group has no borrowings as at 30 September <strong>2012</strong> and 31 December 2011 respectively.<br />
4
SHENG SIONG GROUP LTD<br />
Third Quarter <strong>Financial</strong> Statement<br />
1(c) A cash flow statement (for the Group), together with a comparative statement for the<br />
corresponding period of the immediately preceding financial year.<br />
CONSOLIDATED STATEMENT OF CASH FLOW<br />
5<br />
GROUP<br />
3 months ended 9 months ended<br />
30 September 30 September<br />
<strong>2012</strong> 2011 <strong>2012</strong> 2011<br />
S$’000 S$’000 S$’000 S$’000<br />
Operating activities<br />
Profit for the period 9,814 6,628 33,688 23,505<br />
Adjustments for:<br />
Depreciation of property, plant and equipment 2,058 1,857 5,900 3,997<br />
Loss/(gain) on disposal of property, plant and<br />
equipment (111) 26 (92) 29<br />
Gain on disposal of Leasehold property - - (10,465) -<br />
Unrealised exchange loss/(gain) 44 - 12 (156)<br />
Interest income (185) (1) (571) (2)<br />
Interest expense - 23 - 23<br />
Income tax expense 2,309 1,800 7,061 5,482<br />
13,929 10,333 35,533 32,878<br />
Changes in working capital:<br />
Inventories 203 (6,138) 2,210 (6,247)<br />
Trade and other receivables (3,748) 660 (3,881) 634<br />
Trade and other payables (895) 11,953 (11,432) 8,347<br />
Cash generated from operations 9,489 16,808 22,430 35,612<br />
Income taxes paid (3,121) (2,682) (8,245) (5,202)<br />
Cash flows from operating activities 6,368 14,126 14,185 30,410<br />
Investing activities<br />
Proceeds from disposal of Leasehold property - 18 14,050 69<br />
Proceeds from disposal of property, plant and<br />
equipment 108 - 126 -<br />
Purchase of property, plant and equipment (2,198) (4,995) (5,490) (21,355)<br />
Interest received 185 1 571 2<br />
Capital reduction - - - (20,000)<br />
Net initial public offering (“IPO”) proceeds - 78,115 - 78,115<br />
Cash flows(used in)/ from investing activities (1,905) 73,139 9,257 36,831
SHENG SIONG GROUP LTD<br />
Third Quarter <strong>Financial</strong> Statement<br />
CONSOLIDATED STATEMENT OF CASH FLOW<br />
GROUP<br />
3 months ended 9 months ended<br />
30 September 30 September<br />
<strong>2012</strong> 2011 <strong>2012</strong> 2011<br />
S$’000 S$’000 S$’000 S$’000<br />
Financing activities<br />
Proceeds from bank loan - 586 - 2,898<br />
Non-trade amounts due from affiliated companies - - - 106<br />
Non-trade amounts due to directors - - - (8,700)<br />
Dividend paid (13,835) - (38,324) (927)<br />
Interest paid - (23) - (23)<br />
Cash flows(used in)/ from financing activities (13,835) 563 (38,324) (6,646)<br />
Net increase/(decrease) in cash and cash equivalents (9,372) 87,828 (14,882) 60,595<br />
Cash and cash equivalents at beginning of the period 116,642 58,808 122,120 85,885<br />
Effect of exchange rate changes on balances held in<br />
foreign currencies. (44) - (12) 156<br />
Cash and cash equivalents at end of the period 107,226 146,636 107,226 146,636<br />
6
SHENG SIONG GROUP LTD<br />
Third Quarter <strong>Financial</strong> Statement<br />
1(d)(i) A statement (for the issuer and group) showing (i) all change in equity or (ii) change in equity<br />
other than those arising from capitalization issues and distributions to shareholders, together with a<br />
comparative statement for the corresponding period of the immediately preceding financial period.<br />
Group<br />
Share<br />
capital<br />
7<br />
Merger<br />
reserve<br />
Accumulated profits<br />
Total<br />
equity<br />
S$’000 S$’000 S$’000 S$’000<br />
As at 1 January 2011<br />
Total comprehensive<br />
income for the period<br />
78,234 (68,234) 33,881 43,881<br />
Profit for the period<br />
Transactions with owners,<br />
recorded directly in equity:<br />
Contributions by and<br />
distributions to owners<br />
Issuance of shares pursuant to<br />
- - 23,505 23,505<br />
the IPO<br />
80,367 -<br />
- 80,367<br />
Issuance of dividend - - (927) (927)<br />
IPO expenses taken to equity<br />
Total transactions with<br />
(2,252) - - (2,252)<br />
owners<br />
78,115 -<br />
(927) (77,188)<br />
At 30 September 2011 156,349 (68,234) 56,459 144,574<br />
Share Merger<br />
Accumulated Total<br />
Group<br />
capital reserve<br />
profits equity<br />
S$’000<br />
S$’000<br />
S$’000 S$’000<br />
As at 1 January <strong>2012</strong><br />
Total comprehensive<br />
income for the period<br />
156,349 (68,234) 60,210 148,325<br />
Profit for the period<br />
Transactions with owners,<br />
recorded directly in equity:<br />
Contributions by and<br />
distributions to owners<br />
- - 33,688 33,688<br />
Issuance of dividend<br />
Total transactions with<br />
- - (38,324) (38,324)<br />
owners<br />
- - (38,324) (38,324)<br />
At 30 September <strong>2012</strong> 156,349 (68,234) 55,574 143,689
SHENG SIONG GROUP LTD<br />
Third Quarter <strong>Financial</strong> Statement<br />
Company<br />
8<br />
Share Accumulated Total<br />
capital profits equity<br />
S$’000 S$’000 S$’000<br />
As at 1 January 2011 78,234 - 78,234<br />
Total comprehensive income for the period<br />
Profit for the period - (1,847) (1,847)<br />
Total comprehensive income for the period - (1,847) (1,847)<br />
Transactions with owners, recorded<br />
directly in equity:<br />
Contributions by and distributions to<br />
owners<br />
Issue of 243,537,000 pursuant to the IPO 80,367 - 80,367<br />
IPO expenses taken to equity (2,252) - (2,252)<br />
Total transactions with owners 78,115 - 78,115<br />
At 30 September 2011 156,349 (1,847) 154,502<br />
As at 1 January <strong>2012</strong><br />
Total comprehensive income for the<br />
156,349 25,595 181,944<br />
period<br />
-<br />
Profit for the period<br />
Transactions with owners, recorded<br />
directly in equity:<br />
Contributions by and distributions to<br />
owners<br />
14,103 14,103<br />
Issuance of dividend - (38,324) (38,324)<br />
Total transactions with owners - (38,324) (38,324)<br />
As at 30 September <strong>2012</strong> 156,349 1,374 157,723<br />
1(d)(ii) Details of any changes in the company’s share capital arising from rights issue, bonus issue, share buybacks,<br />
exercise of share option or warrants, conversion of other issues of equity securities, issue of shares for<br />
cash or as consideration for acquisition or for any other purpose since the end of the previous period reported on.<br />
State also the number of shares that may be issued on conversion of all the outstanding convertibles, as well as<br />
the number of shares held as treasury shares, if any, against the total number of issued shares excluding treasury<br />
shares of the issuer, as at the end of the current financial period reported on and as at the end of the<br />
corresponding period of the immediately preceding financial year.<br />
There were no changes to the Company‟s share capital since the end of the previous period reported on. There<br />
were no outstanding convertibles which may be converted into ordinary shares. There were no treasury shares<br />
held.
SHENG SIONG GROUP LTD<br />
Third Quarter <strong>Financial</strong> Statement<br />
1(d)(iii) To show the total number of issued shares as at the end of the current financial period and as<br />
at the end of the immediately preceding year.<br />
As at<br />
30 Sep <strong>2012</strong> 31 Dec 2011<br />
Company No of shares No of shares<br />
Total number of issued shares 1,383,537,000 1,383,537,000<br />
1(d)(iv) A statement showing all sales, transfer, disposal, cancellation and/or use of treasury shares as<br />
at the end of the current financial period reported on.<br />
Not applicable<br />
2. Whether the figures have been audited, or reviewed and in accordance with which auditing standard<br />
or practice.<br />
The figures have not been audited or reviewed.<br />
3. Where the figures have been audited or reviewed, the auditors’ report (including any qualifications<br />
or emphasis of matter).<br />
Not applicable.<br />
4. Whether the same accounting policies and methods of computation as in the issuer’s most recently<br />
audited annual financial statements have been applied.<br />
The Group has applied the same accounting policies and computation methods used in the preparation<br />
of the consolidated financial statements for the current reporting period as compared with the audited<br />
consolidated financial statements as at 31 December 2011, except for the adoption of the new and<br />
revised <strong>Financial</strong> Reporting Standards (FRS) which become effective for the financial year beginning<br />
on or after 1 January <strong>2012</strong>. The adoption of these new and revised accounting standards did not give<br />
rise to any significant changes to the financial statements.<br />
5. If there any changes in the accounting policies and methods of computation, including any required<br />
by an accounting standard, what has changed, as well as the reasons for, and the effect of, the change.<br />
Please refer to paragraph 4.<br />
9
SHENG SIONG GROUP LTD<br />
Third Quarter <strong>Financial</strong> Statement<br />
6. Earning per ordinary share of the group for the current period reported on and the corresponding<br />
period of the immediately preceding financial year, after deducting any provision for preference<br />
dividends.<br />
Earning per ordinary share of the group for<br />
the financial period based on net profit<br />
attributable to shareholders:<br />
GROUP GROUP<br />
3 months ended 9 months ended<br />
30 Sep <strong>2012</strong> 30 Sep 2011 30 Sep <strong>2012</strong> 30 Sep 2011<br />
- based on weighted average number of<br />
shares in issue (cents) 0.71 0.56 2.43 1.99<br />
Weighted average number of shares in<br />
issue during the period („000) 1,383,537 1,180,589 1,383,537 1,180,589<br />
Note:-<br />
There were no potentially dilutive shares.<br />
7. Net asset value (for the issuer and group) per ordinary share based on the total number of issued<br />
shares excluding treasury shares of the issuer at the end of the (a) current period reported on and (b)<br />
immediately preceding financial year.<br />
GROUP COMPANY<br />
30 Sep <strong>2012</strong> 31 Dec 2011 30 Sep <strong>2012</strong> 31 Dec 2011<br />
cents cents cents cents<br />
Net asset value per ordinary share based on<br />
issued share capital at the end of the period<br />
reported on 10.39 10.72 11.40 13.15<br />
No. of shares at the end of period („000) 1,383,537 1,383,537 1,383,537 1,383,537<br />
10
SHENG SIONG GROUP LTD<br />
Third Quarter <strong>Financial</strong> Statement<br />
8. A review of the performance of the group, to the extent necessary for a reasonable understanding of<br />
the group’s business. The review must discuss any significant factors that affected the turnover, costs<br />
and earnings of the group for the current financial period reported on, including (where applicable)<br />
seasonal or cyclical factors. It must also discuss any material factors that affected the cash flow,<br />
working capital, assets or liabilities of the group during the current financial period reported on.<br />
STATEMENT OF COMPREHENSIVE INCOME<br />
Revenue<br />
30 Sep <strong>2012</strong> 30 Jun <strong>2012</strong> 30 Sep 2011<br />
Number of outlets 31 27 23<br />
Retail area 391,000 square feet 368,000 square feet 323,000 square feet<br />
Changes in revenue 3 months YOY 9 months YOY 3 months QOQ<br />
3Q<strong>2012</strong> vs 3Q2011 9M<strong>2012</strong> vs9 M2011 3Q<strong>2012</strong> vs 2Q<strong>2012</strong><br />
Increase in revenue $m 23.5 36.8 22.7<br />
Increase in revenue % 16.0 8.4 15.5<br />
Revenue increased mainly because of contribution from new stores followed by improvement in<br />
comparable same store sales. The increase was partially offset by the closure of the Katong outlet in<br />
August 2011. Comparable same store sales for the 9 months yoy grew by 4.3% as a result of marketing<br />
initiatives and a turnaround in most of our stores in the older matured housing estates, brought about<br />
either by stabilization or improvement in the population numbers and profiles.<br />
Cost of sale and gross margin<br />
Gross margin<br />
3Q<strong>2012</strong> 2Q<strong>2012</strong> 1Q<strong>2012</strong> 4Q2011 3Q2011<br />
22.9% 21.9% 20.8% 20.5%* 23.1%<br />
*After adjusting for stock count write-off of $1.7m.<br />
The industry remained competitive and the prices of our purchases, which had increased marginally,<br />
cannot be passed on in full to our customers. Consequently, the increases in cost of sales out-paced the<br />
growth in turnover, although, to a certain extent, these increases were offset by cost savings facilitated<br />
by the new distribution centre. Nonetheless, the gap had narrowed, as shown in the table below as the<br />
deterioration in selling prices had eased.<br />
% Change 3Q<strong>2012</strong> 2Q<strong>2012</strong> 1Q<strong>2012</strong> 4Q2011<br />
Sales +16.0 +5.2 +4.0 -6.1<br />
Cost of sales +16.4 +6.6 +6.7 -1.0<br />
11
SHENG SIONG GROUP LTD<br />
Third Quarter <strong>Financial</strong> Statement<br />
Other Income<br />
In 3Q<strong>2012</strong>, other income increased by approximately $0.4m yoy mainly because of grants received<br />
from the government. As for the 9 months yoy comparison, the gain of $10.5m from the sale of our old<br />
warehouse was the main reason for the increase of $11.1m.<br />
Distribution expenses<br />
Savings in distribution expenses in the 9 months ended 30 September <strong>2012</strong> compared with the 9 months<br />
ended 30 September 2011, came from lower depreciation expenses, which was partially offset by higher<br />
running cost of the fleet. Depreciation expenses were lower as some of the trucks became fully<br />
depreciated.<br />
Administrative expenses<br />
Costs were tightly controlled. After excluding the IPO expenses of $1.8m in 3Q2011 for comparison<br />
purposes, the increases in administrative expenses on a yoy basis were $5m for the 9 months ended 30<br />
September <strong>2012</strong> and $3.5m for 3Q<strong>2012</strong>. The increases in the 9 months period ended 30 September<br />
<strong>2012</strong> were in manpower cost ($1.7m), rent and utilities relating to our supermarket operations ($2.3m)<br />
and other expenses like professional fees and commission ($1m). These increases were in line with the<br />
expansion of our supermarket operations.<br />
Likewise, these same factors contributed to the increase in administrative expenses in 3Q<strong>2012</strong>. As a %<br />
of revenue, administrative expenses remained stable at around the mid 15% level.<br />
Other expenses<br />
Increase in charges arising from higher incidence of use of credit cards and NETS by our customers<br />
was the main reason for the increase in other expenses.<br />
Finance Income<br />
This was interest earned from fixed deposits placed with banks in Singapore dollars. The increase in<br />
both the 3months and 9 months period in <strong>2012</strong> was due to the larger amounts placed.<br />
Tax<br />
The effective tax rate for the 3Q<strong>2012</strong> is higher than the corporate tax rate of 17% mainly because tax<br />
allowances were not granted for some of the capital expenditures relating to the construction of our<br />
distribution centre in Mandai. Profit before tax for the 9 months <strong>2012</strong> included the gain on the sale of<br />
the old warehouse which is deemed to be capital in nature and is therefore, not taxable. However, the<br />
tax expense of $7.0m included a provision of $1.6m for prior year‟s tax relating to gain made on<br />
disposal of investments in 2010.<br />
Net profit<br />
Net profit after tax increased by 48.1% (3Q yoy) because of higher revenue, gross profit and tight<br />
control over costs. Net profit increased yoy by 43.3% in the 9 months <strong>2012</strong> mainly because of the gain<br />
from the sale of the old warehouse which was partially offset by the tax expense in respect of<br />
investment gains made in 2010.<br />
12
SHENG SIONG GROUP LTD<br />
Third Quarter <strong>Financial</strong> Statement<br />
STATEMENT OF FINANCIAL POSITION<br />
Property, plant and equipment decreased by $0.4m due to depreciation charges which were offset by<br />
capital expenditure incurred mainly in fitting out the new outlets.<br />
The run down of inventory which was carried as at 31 December 2011 to cater for Chinese New Year<br />
sales in January <strong>2012</strong> was the main reason for the decrease in inventory of $2.2m as at 30 September<br />
<strong>2012</strong>. Despite higher revenue, inventory level remained stable at around $34m for the quarters ended<br />
30 June and 30 September <strong>2012</strong>.<br />
The increase in deposits placed with landlords for new outlets as well as the net increase in trade and<br />
other receivables arising mainly from higher amounts due from credit card companies were the main<br />
reasons for the increase in trade and other receivables by $3.9m.<br />
The asset classified as held for sale referred to the old warehouse at Marsiling, which was sold in <strong>2012</strong>.<br />
Bonuses for FY2011 which were accrued as at the 31 December 2011 were paid in May <strong>2012</strong>.<br />
Following a change in human resource policy, bonuses are now paid semi-annually and bonuses for the<br />
first half of FY<strong>2012</strong>, which would otherwise be in accruals, were paid in August <strong>2012</strong>. The reduction<br />
in accruals relating to these two tranches of bonuses as well as reduction of other payables were the<br />
main reasons for trade and other payables decreasing by $11.4m.<br />
CASH FLOW<br />
The Group continued to generate healthy cash flow from operating activities before working capital<br />
changes. Working capital changes were impacted mainly by the reduction in accruals relating to the<br />
payment of bonuses.<br />
Purchase of property, plant and equipment in <strong>2012</strong> was mainly for the new supermarket outlets. In 2011,<br />
the cash outflows were due to the payment for the construction of the new distribution centre at Mandai.<br />
The main cash outflows for financing activities were the payment of the final dividend for FY2011 in<br />
May <strong>2012</strong> and the interim dividend in August <strong>2012</strong>.<br />
As a result of the cash flows described above cash and cash equivalents reduced by $14.9m for the 9<br />
months ended 30 September <strong>2012</strong>. Nonetheless, as at 30 September <strong>2012</strong>, the Group had a healthy cash<br />
and cash equivalent of $107.2m.<br />
9. Where a forecast, or a prospect statement, has been previously disclosed to shareholders, any<br />
variance between it and the actual results.<br />
Not applicable.<br />
13
SHENG SIONG GROUP LTD<br />
Third Quarter <strong>Financial</strong> Statement<br />
10. A commentary at the date of the announcement of the significant trends and competitive conditions<br />
of the industry in which the group operates and any known factors or events that may affect the group<br />
in the next reporting period and the next 12 months.<br />
The global economic climate is uncertain and economic growth in Singapore is forecast to be about 1.5%<br />
to 2.5% for <strong>2012</strong>. The weak external environment has affected spending on consumer confidence which<br />
remained weak.<br />
The industry is expected to remain competitive and while we aim to open new outlets in areas where we<br />
do not have a presence, we expect our competitors to compete with us for new retail space.<br />
We will be fitting out and opening two more new outlets before the end of the year, bringing our total<br />
store count to 33. The new outlets which were opened in 2011 and <strong>2012</strong> should continue to grow and<br />
contribute to revenue.<br />
Cost pressures, particularly on food and manpower is likely to continue as the supply chain for food<br />
may be disrupted by weather and geo-political problems. The supply of foreign labor is shrinking<br />
because of tightening regulations on employment and the perennial problems with employing<br />
Singaporeans and Permanent Residents are not likely to ease in the short term.<br />
The annual stock count will be done in 4Q <strong>2012</strong> and the stock count variance will be expensed in that<br />
quarter. Consequently, this is expected to impact the gross margin on a quarter on quarter basis.<br />
11. Dividend<br />
(a) Current <strong>Financial</strong> Period Reported On<br />
Nil<br />
(b) Corresponding Period of the immediately Preceding <strong>Financial</strong> Year<br />
Nil<br />
(c) Whether the dividend is before tax, net of tax or tax exempt. If before tax or net of tax, state the<br />
tax rate and the country where the dividend is derived. (If the dividend is not taxable in the hands<br />
of shareholders, this must be stated).<br />
Not applicable<br />
(d) The date the dividend is payable.<br />
Not applicable<br />
(e) The date on which Registrable Transfers received by the company (up to 5.00 pm) will be<br />
registered before entitlements to the dividend are determined<br />
Not applicable.<br />
14
SHENG SIONG GROUP LTD<br />
Third Quarter <strong>Financial</strong> Statement<br />
12. If no dividend has been declared (recommended), a statement to that effect.<br />
The Company has not declared a dividend for the current period reported on.<br />
13. If the Group has obtained a general mandate from shareholders for IPTs, the aggregate value of<br />
such transactions as required under Rule 920(1)(a)(ii). If no IPT mandate has been obtained, a<br />
statement to that effect.<br />
The Group has not obtained an IPT mandate under Rule 920(1). The interested person transactions<br />
conducted during the period 1 January <strong>2012</strong> to 30 September <strong>2012</strong> were:-<br />
Name of<br />
Interested<br />
Person(s)<br />
F M Food<br />
Court Pte. Ltd.<br />
/<br />
Lim Hock Eng<br />
Lim Hock Chee<br />
Lim Hock Leng<br />
E Land<br />
Properties Pte.<br />
Ltd. /<br />
Lim Hock Eng<br />
Lim Hock Chee<br />
Lim Hock Leng<br />
INTERESTED PERSON TRANSACTIONS<br />
From 1 January <strong>2012</strong> to 30 September <strong>2012</strong><br />
Description of Interested<br />
Person Transactions<br />
Sale of goods by F M Food<br />
Court Pte. Ltd. See Notes (1), (2) to<br />
<strong>Sheng</strong> <strong>Siong</strong> Group Ltd.<br />
Purchase of goods by F M<br />
See Notes<br />
Food Court Pte. Ltd.<br />
(1), (2)<br />
from <strong>Sheng</strong> <strong>Siong</strong><br />
Group Ltd.<br />
Lease of operation space by<br />
F M Food Court Pte Ltd from<br />
Aggregate value of<br />
all interested person<br />
transactions during<br />
the financial period<br />
under review<br />
(excluding<br />
transactions less<br />
than S$100,000 and<br />
transactions<br />
conducted under<br />
shareholders’<br />
mandate pursuant<br />
to Rule 920)<br />
($’000)<br />
<strong>Sheng</strong> <strong>Siong</strong> Group Ltd. 276<br />
Rent and utilities paid by<br />
<strong>Sheng</strong> <strong>Siong</strong> Group Ltd. to E<br />
Land Properties Pte. Ltd. See<br />
Note (1) for lease and license of<br />
operations space.<br />
15<br />
272 -<br />
298 -<br />
732 -<br />
Aggregate value of<br />
all interested<br />
person<br />
transactions<br />
conducted under<br />
shareholders’<br />
mandate pursuant<br />
to Rule 920<br />
(excluding<br />
transactions less<br />
than $100,000)
SHENG SIONG GROUP LTD<br />
Third Quarter <strong>Financial</strong> Statement<br />
Notes:<br />
(1) These entities are associates of Messrs Lim Hock Eng, Lim Hock Chee and Lim Hock Leng,<br />
the executive directors and controlling shareholders of <strong>Sheng</strong> <strong>Siong</strong> Group Ltd.<br />
(2) F M Food Court Pte. Ltd. was formerly known as <strong>Sheng</strong> <strong>Siong</strong> Food Court Pte. Ltd.<br />
14. An update on the use of net proceeds from the issue of new shares for the IPO.<br />
Purpose Estimated<br />
amount<br />
($ m)<br />
Repayment of the<br />
Term Loan<br />
Development and<br />
expansion of grocery<br />
retailing business and<br />
operations in<br />
Singapore and overseas<br />
Working capital<br />
purposes<br />
Expenses incurred in<br />
connection with the<br />
issue of New Shares<br />
Total 76.4 (2)<br />
Notes:<br />
USE OF PROCEEDS FROM IPO<br />
Estimated<br />
percentage<br />
of gross<br />
proceeds<br />
raised from<br />
the issue of<br />
New Shares<br />
(1) Relates to the opening of our new stores in Singapore.<br />
16<br />
Amount<br />
utilised<br />
($ m)<br />
Percentage<br />
of gross<br />
proceeds<br />
raised from<br />
the issue of<br />
New Shares<br />
30.0 39.3% 26.3 34.4%<br />
20.0 26.2% 4.9 (1) 6.4%<br />
22.2 29.0% - -<br />
4.2 5.5% 4.0 5.2%<br />
100.0% 35.2 46.0%<br />
(2) Includes net proceeds from the exercise of the Over-allotment Option of $13.5m.
SHENG SIONG GROUP LTD<br />
Third Quarter <strong>Financial</strong> Statement<br />
NEGATIVE ASSURANCE CONFIRMATION ON INTERIM FINANCIAL RESULTS<br />
PURSUANT TO RULE 705(4) OF THE LISTING MANAUAL<br />
The Board of Directors has confirmed that, to the best of their knowledge, nothing has come to their<br />
attention which may render these interim financial results to be false or misleading in any material<br />
aspect.<br />
BY ORDER OF THE BOARD<br />
LIM HOCK CHEE<br />
CEO<br />
24 October <strong>2012</strong><br />
___________________________________________________________________________<br />
The initial public offering of <strong>Sheng</strong> <strong>Siong</strong> Group Ltd. was sponsored by Oversea-Chinese Banking<br />
Corporation Limited (“OCBC").<br />
OCBC assumes no responsibility for the contents of this announcement.<br />
___________________________________________________________________________<br />
17