Summary - Rensselaer Polytechnic Institute
Summary - Rensselaer Polytechnic Institute
Summary - Rensselaer Polytechnic Institute

You also want an ePaper? Increase the reach of your titles
YUMPU automatically turns print PDFs into web optimized ePapers that Google loves.
UMAP<br />
The<br />
Journal<br />
Publisher<br />
COMAP, Inc. Vol. 26, No. 3<br />
Executive Publisher<br />
Solomon A. Garfunkel<br />
ILAP Editor<br />
Chris Arney<br />
Associate Director,<br />
Mathematics Division<br />
Program Manager,<br />
Cooperative Systems<br />
Army Research Office<br />
P.O. Box 12211<br />
Research Triangle Park,<br />
NC 27709-2211<br />
David.Arney1@arl.army.mil<br />
On Jargon Editor<br />
Yves Nievergelt<br />
Department of Mathematics<br />
Eastern Washington University<br />
Cheney, WA 99004<br />
ynievergelt@ewu.edu<br />
Reviews Editor<br />
James M. Cargal<br />
Mathematics Dept.<br />
Troy University—<br />
Montgomery Campus<br />
231 Montgomery St.<br />
Montgomery, AL 36104<br />
jmcargal@sprintmail.com<br />
Chief Operating Officer<br />
Laurie W. Aragón<br />
Production Manager<br />
George W. Ward<br />
Director of Educ. Technology<br />
Roland Cheyney<br />
Production Editor<br />
Pauline Wright<br />
Copy Editor<br />
Timothy McLean<br />
Distribution<br />
Kevin Darcy<br />
John Tomicek<br />
Graphic Designer<br />
Daiva Kiliulis<br />
Editor<br />
Paul J. Campbell<br />
Campus Box 194<br />
Beloit College<br />
700 College St.<br />
Beloit, WI 53511–5595<br />
campbell@beloit.edu<br />
Associate Editors<br />
Don Adolphson<br />
Chris Arney<br />
Aaron Archer<br />
Ron Barnes<br />
Arthur Benjamin<br />
Robert Bosch<br />
James M. Cargal<br />
Murray K. Clayton<br />
Lisette De Pillis<br />
James P. Fink<br />
Solomon A. Garfunkel<br />
William B. Gearhart<br />
William C. Giauque<br />
Richard Haberman<br />
Jon Jacobsen<br />
Walter Meyer<br />
Yves Nievergelt<br />
Michael O’Leary<br />
Catherine A. Roberts<br />
John S. Robertson<br />
Philip D. Straffin<br />
J.T. Sutcliffe<br />
Brigham Young University<br />
Army Research Office<br />
AT&T Shannon Research Laboratory<br />
University of Houston—Downtown<br />
Harvey Mudd College<br />
Oberlin College<br />
Troy University— Montgomery Campus<br />
University of Wisconsin—Madison<br />
Harvey Mudd College<br />
Gettysburg College<br />
COMAP, Inc.<br />
California State University, Fullerton<br />
Brigham Young University<br />
Southern Methodist University<br />
Harvey Mudd College<br />
Adelphi University<br />
Eastern Washington University<br />
Towson University<br />
College of the Holy Cross<br />
Georgia Military College<br />
Beloit College<br />
St. Mark’s School, Dallas
Subscription Rates for 2005 Calendar Year: Volume 26<br />
Membership Plus<br />
Individuals subscribe to The UMAP Journal through COMAP’s Membership Plus. This subscription<br />
also includes a CD-ROM of our annual collection UMAP Modules: Tools for Teaching, our<br />
organizational newsletter Consortium, on-line membership that allows members to download and<br />
reproduce COMAP materials, and a 10% discount on all COMAP purchases.<br />
(Domestic) #2520 $ 99<br />
(Outside U.S.) #2521 $111<br />
Institutional Plus Membership<br />
Institutions can subscribe to the Journal through either Institutional Plus Membership, Regular<br />
Institutional Membership, or a Library Subscription. Institutional Plus Members receive two print<br />
copies of each of the quarterly issues of The UMAP Journal, our annual collection UMAP Modules:<br />
Tools for Teaching, our organizational newsletter Consortium, on-line membership that allows<br />
members to download and reproduce COMAP materials, and a 10% discount on all COMAP purchases.<br />
(Domestic) #2570 $456<br />
(Outside U.S.) #2571 $479<br />
Institutional Membership<br />
Regular Institutional members receive print copies of The UMAP Journal, our annual collection<br />
UMAP Modules: Tools for Teaching, our organizational newsletter Consortium, and a 10% discount on<br />
all COMAP purchases.<br />
(Domestic) #2540 $198<br />
(Outside U.S.) #2541 $220<br />
Web Membership<br />
Web membership does not provide print materials. Web members can download and reproduce<br />
COMAP materials, and receive a 10% discount on all COMAP purchases.<br />
(Domestic) #2510 $41<br />
(Outside U.S.) #2510 $41<br />
To order, send a check or money order to COMAP, or call toll-free<br />
1-800-77-COMAP (1-800-772-6627).<br />
The UMAP Journal is published quarterly by the Consortium for Mathematics and Its Applications<br />
(COMAP), Inc., Suite 210, 57 Bedford Street, Lexington, MA, 02420, in cooperation with the<br />
American Mathematical Association of Two-Year Colleges (AMATYC), the Mathematical<br />
Association of America (MAA), the National Council of Teachers of Mathematics (NCTM), the<br />
American Statistical Association (ASA), the Society for Industrial and Applied Mathematics (SIAM),<br />
and The <strong>Institute</strong> for Operations Research and the Management Sciences (INFORMS). The Journal<br />
acquaints readers with a wide variety of professional applications of the mathematical sciences and<br />
provides a forum for the discussion of new directions in mathematical education (ISSN 0197-3622).<br />
Periodical rate postage paid at Boston, MA and at additional mailing offices.<br />
Send address changes to: info@comap.com<br />
COMAP, Inc. 57 Bedford Street, Suite 210, Lexington, MA 02420<br />
© Copyright 2005 by COMAP, Inc. All rights reserved.
Vol. 26, No. 3 2005<br />
Table of Contents<br />
Editorial<br />
Back to the Future<br />
Solomon A. Garfunkel........................................................................................185<br />
About This Issue (and Others to Come)......................................................187<br />
Special Section on the MCM<br />
Results of the 2005 Mathematical Contest in Modeling<br />
Frank Giordano ................................................................................................189<br />
Abstracts of the Outstanding Papers and the Fusaro Papers ......................217<br />
From Lake Murray to a Dam Slurry<br />
Clay Hambrick, Katie Lewis, and Lori Thomas............................................229<br />
Through the Breach: Modeling Flooding from a Dam Failure in<br />
South Carolina<br />
Jennifer Kohlenberg, Michael Barnett, and Scott Wood ..............................245<br />
Analysis of Dam Failure in the Saluda River Valley<br />
Ryan Bressler, Christina Polwarth, and Braxton Osting ..............................263<br />
Judge’s Commentary: The Outstanding Flood Planning Papers<br />
Daniel Zwillinger ..............................................................................................279<br />
The Booth Tolls for Thee<br />
Adam Chandler, Matthew Mian, and Pradeep Baliga ................................283<br />
A Single-Car Interaction Model of Traffic for a Highway Toll Plaza<br />
Ivan Corwin, Sheel Ganatra, Nikita Rozenblyum ........................................299<br />
Lane Changes and Close Following: Troublesome Tollbooth Traffic<br />
Andrew Spann, Daniel Kane, and Dan Gulotta ............................................317<br />
A Quasi-Sequential Cellular-Automaton Approach to<br />
Traffic Modeling<br />
John Evans and Meral Reyhan ........................................................................331<br />
The Multiple Single Server Queueing System<br />
Azra Panjwani, Yang Liu, and HuanHuan Qi................................................345<br />
Two Tools for Tollbooth Optimization<br />
Ephrat Bitton, Anand Kulkarni, and Mark Shlimovich ................................355<br />
For Whom the Booth Tolls<br />
Brian Camley, Bradley Klingenberg, and Pascal Getreuer ..........................373<br />
Judge’s Commentary: The Outstanding Tollbooths Papers<br />
Kelly Black............................................................................................................391
Publisher’s Editorial<br />
Back to the Future<br />
Solomon A. Garfunkel<br />
Executive Director<br />
COMAP, Inc.<br />
57 Bedford St., Suite 210<br />
Lexington, MA 02420<br />
s.garfunkel@mail.comap.com<br />
Publisher’s Editorial 185<br />
First, a mea culpa. I recently attended a showing of the movie “Good Night<br />
and Good Luck” and was taken by the courage of Edward R. Murrow, Fred<br />
Friendly, et al. at CBS during the McCarthy era. And I felt embarrassed. For<br />
a number of years, I have watched several of my colleagues in mathematics<br />
and mathematics education work hard to destroy much of the progress that<br />
we have made—and I have been silent. The pressure to stay quiet is strong.<br />
COMAP lives in part on our ability to secure grants from the National Science<br />
Foundation. NSF doesn’t enjoy controversy. Moreover, any number of the<br />
people that I see as destructive sit on proposal review panels from time to time.<br />
And they are very political. Single-issue politics is always quite ugly. I suspect<br />
that most if not all of this group would consider themselves to be liberals; but<br />
they have no trouble working with this most conservative of administrations<br />
as long as their views of mathematics education prevail—even if that means<br />
the end of science education at NSF.<br />
In the early 1970s, when I first became seriously involved in mathematics<br />
education and the world of proposals, grants, etc., there was a constant<br />
complaint from program officers at NSF: Mathematicians simply did not write<br />
proposals, and when called upon to review proposals, they invariably savaged<br />
their mathematical colleagues. Hence mathematics education grants were well<br />
below the numbers that the importance of the subject justified. NSF program<br />
officers came to mathematics conferences and all but begged us to ask them for<br />
money. They also pleaded with us to speak with one voice, that is, to iron out<br />
our differences, figure out for ourselves what the priorities should be, and get<br />
to work together on attacking the important problems rather than each other.<br />
And believe it or not, by the end of the 1980s, mostly because of the courage<br />
of the NCTM leadership and the good offices of MSEB, we got our collective act<br />
together. We all quoted the Standards and A Nation at Risk, and Everybody Counts,<br />
The UMAP Journal 26 (3) (2005) 185–186. c○Copyright 2005 by COMAP, Inc. All rights reserved.<br />
Permission to make digital or hard copies of part or all of this work for personal or classroom use<br />
is granted without fee provided that copies are not made or distributed for profit or commercial<br />
advantage and that copies bear this notice. Abstracting with credit is permitted, but copyrights<br />
for components of this work owned by others than COMAP must be honored. To copy otherwise,<br />
to republish, to post on servers, or to redistribute to lists requires prior permission from COMAP.
186 The UMAP Journal 26.3 (2005)<br />
and we wrote proposals to make the vision of those documents come to pass.<br />
We began to receive funding at a level that made real change possible—and we<br />
are reaping the benefits today with increased NAEP and SAT scores.<br />
So what did we decide to do? Shoot ourselves in whatever foot we could<br />
find! We began the math wars; we went back to savaging our colleagues; we<br />
made NSF look bad in the eyes of Congress; we gave succor and ammunition<br />
to our enemies; and we lost our intellectual honesty in the name of winning<br />
political favor. The result is an NSF science education budget that is greatly<br />
reduced and skewed against mathematics. Funding has moved dramatically<br />
from curriculum- and staff-development to “research” in mathematics education.<br />
People and organizations directly responsible for the demonstrated<br />
successes of the past two decades are being told that there is no room at the<br />
inn. In the name of practicality, we reward mediocrity.<br />
There are consequences of these actions. Just as we learned that natural<br />
disasters require competent people and institutions (and not simply political<br />
hacks at the helm), there will be real and serious consequences for mathematics<br />
and mathematics education because of the present funding environment. Of<br />
course, these consequences are several years away and so safe from existing<br />
politicians’ blame or attention. Nevertheless, we are headed for disaster unless<br />
we have the courage to stand up and fight—today. This is precisely equivalent<br />
to the global warming debate. We are poisoning our profession just as we<br />
poison our atmosphere. And we are running out of time, because systems take<br />
as long to fix as they do to break.<br />
I call on the staff of NSF to take credit for their own successes and tell the<br />
community about what they know works—even if the current administration<br />
wants to tell a different story. I call on the private foundations to step into the<br />
coming void and fill in until the current federal policies turn around. And I<br />
call on members of our community who understand what’s at stake to stand<br />
up and be counted.<br />
About the Author<br />
Sol Garfunkel received his Ph.D. in mathematical logic from the University<br />
of Wisconsin in 1967. He was at Cornell University and at the University of<br />
Connecticut at Storrs for 11 years and has dedicated the last 25 years to research<br />
and development efforts in mathematics education. He has been the Executive<br />
Director of COMAP since its inception in 1980.<br />
He has directed a wide variety of projects, including UMAP (Undergraduate<br />
Mathematics and Its Applications Project), which led to the founding of this<br />
Journal, and HiMAP (High School Mathematics and Its Applications Project),<br />
both funded by the NSF. For Annenberg/CPB, he directed three telecourse<br />
projects: For All Practical Purposes (in which he also appeared as the on-camera<br />
host), Against All Odds: Inside Statistics (still showing on late-night TV in New<br />
York!), and In Simplest Terms: College Algebra. Heiscurrently co-director of the<br />
Applications Reform in Secondary Education (ARISE) project, a comprehensive<br />
curriculum development project for secondary school mathematics.
About This Issue 187<br />
Important Note from the Editor<br />
About This Issue<br />
(and Others to Come)<br />
Paul J. Campbell<br />
Editor<br />
This issue of The UMAP Journal represents a departure from past practice<br />
and a further step toward electronic publishing.<br />
For its first five years, the Journal published 512 pp/yr with a supplementary<br />
volume of UMAP Modules: Tools for Teaching (at extra cost to subscribers) that<br />
ran between 1044 and 1258 pp. Those were typescript pages that held only half<br />
the content of a page of today’s Journal.<br />
In 1984, the Mathematical Contest in Modeling (MCM) was founded, the<br />
Journal began to be typeset, and the annual UMAP Modules: Tools for Teaching<br />
supplement was bundled into the COMAP membership option for receiving<br />
the Journal. That supplemental volume, which libraries shelve as a separate<br />
serial, collected together UMAP Modules—and later also ILAP Modules—from<br />
the year’s issues of the Journal, together with additional Modules (particularly<br />
longer ones) for which there was no room in the Journal.<br />
We aimed for four 92-page issues per year and devoted one issue to the<br />
MCM. The size of the MCM issue has varied with the number of Outstanding<br />
teams, the length of their papers (sometimes the size of a small telephone book),<br />
and my ability to edit the papers down to a modeling core. The last year that<br />
we had only 368 pp in the Journal was 1992; the MCM issue in fact became a<br />
double issue (and more). In 2000, we had 530 pp, and the combined total for<br />
the Journal and the Tools volume has varied over the past 10 years between 642<br />
and 715 pp. This year, the MCM yielded a record 10 Outstanding teams.<br />
Meanwhile, costs for publishing on paper have risen faster than the Journal’s<br />
income.<br />
Hence, spurred by the desire to control costs, but also by the intention to<br />
make the contents of the Journal and the Tools volume more usable by members,<br />
we have settled on the following plan:<br />
COMAP members will receive four 92-page issues of the Journal,<br />
plus a CD-ROM bundled into the MCM issue.<br />
The UMAP Journal 26 (3) (2005) 187–188. c○Copyright 2005 by COMAP, Inc. All rights reserved.<br />
Permission to make digital or hard copies of part or all of this work for personal or classroom use<br />
is granted without fee provided that copies are not made or distributed for profit or commercial<br />
advantage and that copies bear this notice. Abstracting with credit is permitted, but copyrights<br />
for components of this work owned by others than COMAP must be honored. To copy otherwise,<br />
to republish, to post on servers, or to redistribute to lists requires prior permission from COMAP.
188 The UMAP Journal 26.3 (2005)<br />
Here are the particulars:<br />
• As with other COMAP electronic products, the files on the CD-ROM will be<br />
Adobe Acrobat PDF files. In particular, color images that are rendered only<br />
in black and white in the printed copy will appear in the PDF files in color.<br />
• The ICM and MCM issues, like the other two issues, will be limited to 92<br />
print pages each.<br />
• If an issue runs longer than 92 pp, some articles will not appear in print but<br />
only on the CD-ROM. However, all articles on the CD-ROM will appear in<br />
the printed table of contents and are regarded as published in the Journal.<br />
Pagination will run continuously, including in sequence articles that do not<br />
appear in printed form. So, if you notice that, say, page 350 in the printed<br />
copy is followed by page 403, your copy is not necessarily defective! The articles<br />
corresponding to the intervening pages should be on the CD-ROM.<br />
• The CD-ROM will contain an entire year of Journal issues.<br />
• The Tools volume will no longer appear as a printed volume but only in<br />
electronic form on the CD-ROM.<br />
• We remind readers of the COMAP’s policy concerning usage of material<br />
appearing in the Journal, which applies to all material on the CD-ROM. The<br />
policy appears as a footnote on the first page of each article:<br />
Permission to make digital or hard copies of part or all of this work<br />
for personal or classroom use is granted without fee provided that<br />
copies are not made or distributed for profit or commercial advantage<br />
and that copies bear this notice. Abstracting with credit is permitted,<br />
but copyrights for components of this work owned by others<br />
than COMAP must be honored. To copy otherwise, to republish, to<br />
post on servers, or to redistribute to lists requires prior permission<br />
from COMAP.<br />
We hope that you will find this arrangement, if not entirely satisfying, at<br />
least satisfactory. It will mean that we will not have to procrusteanize the<br />
content of the Journal to fit a fixed number of allocated pages. For example,<br />
we might otherwise need to select only two or three of the MCM Outstanding<br />
papers to publish (a hard task indeed!). Instead, we can continue to bring you<br />
the full content as in the past.
Modeling Forum<br />
Results of the 2005 MCM 189<br />
Results of the 2005<br />
Mathematical Contest in Modeling<br />
Frank Giordano, MCM Director<br />
Naval Postgraduate School<br />
1 University Circle<br />
Monterey, CA 93943-5000<br />
frgiorda@nps.navy.mil<br />
Introduction<br />
A total of 664 teams of undergraduates, from 259 institutions and 306 departments<br />
in 10 countries, spent the second weekend in February working on<br />
applied mathematics problems in the 21st Mathematical Contest in Modeling<br />
(MCM).<br />
The 2005 MCM began at 8:00 p.m. EST on Thursday, February 3 and ended<br />
at 8:00 p.m. EST on Monday, February 7. During that time, teams of up to<br />
three undergraduates were to research and submit an optimal solution for one<br />
of two open-ended modeling problems. Students registered, obtained contest<br />
materials, downloaded the problems at the appropriate time, and entered completion<br />
data through COMAP’S MCM Website. After a weekend of hard work,<br />
solution papers were sent to COMAP on Monday. The top papers appear in<br />
this issue of The UMAP Journal.<br />
Results and winning papers from the first 20 contests were published in special<br />
issues of Mathematical Modeling (1985–1987) and The UMAP Journal (1985–<br />
2004). The 1994 volume of Tools for Teaching, commemorating the tenth anniversary<br />
of the contest, contains all of the 20 problems used in the first 10 years of the<br />
contest and a winning paper for each year. Limited quantities of that volume<br />
and of the special MCM issues of the Journal for the last few years are available<br />
from COMAP. That volume is available on COMAP’s special Modeling Resource<br />
CD-ROM (http://www.comap.com/product/?idx=613). In addition,<br />
COMAP will shortly release a new volume, The MCM at 21, which will contain<br />
The UMAP Journal 26 (3) (2005) 189–216. c○Copyright 2005 by COMAP, Inc. All rights reserved.<br />
Permission to make digital or hard copies of part or all of this work for personal or classroom use<br />
is granted without fee provided that copies are not made or distributed for profit or commercial<br />
advantage and that copies bear this notice. Abstracting with credit is permitted, but copyrights<br />
for components of this work owned by others than COMAP must be honored. To copy otherwise,<br />
to republish, to post on servers, or to redistribute to lists requires prior permission from COMAP.
190 The UMAP Journal 26.3 (2005)<br />
all of the 20 problems from the second 10 years of the contest and a winning<br />
paper for each year.<br />
This year’s Problem A asked teams to develop a model showing the consequences<br />
of a massive dam failure. Problem B asked teams to propose a model<br />
to help determine the optimal number of tollbooths in a barrier-toll plaza. The<br />
10 Outstanding solution papers are published in this issue of The UMAP Journal,<br />
along with commentary from problem authors, contest judges, and outside<br />
experts.<br />
In addition to the MCM, COMAP also sponsors the Interdisciplinary Contest<br />
in Modeling (ICM) and the High School Mathematical Contest in Modeling<br />
(HiMCM). The ICM, which runs concurrently with MCM, offers a modeling<br />
problem involving concepts in operations research, information science, and<br />
interdisciplinary issues in security and safety. Results of this year’s ICM are<br />
on the COMAP Website at http://www.comap.com/undergraduate/contests;<br />
results and Outstanding papers appeared in Vol. 26 (2005), No. 2. The HiMCM<br />
offers high school students a modeling opportunity similar to the MCM. Further<br />
details about the HiMCM are at http://www.comap.com/highschool/<br />
contests .<br />
Problem A: Flood Planning<br />
Lake Murray in central South Carolina is formed by a large earthen dam,<br />
which was completed in 1930 for power production. Model the flooding downstream<br />
in the event there is a catastrophic earthquake that breaches the dam.<br />
Two particular questions:<br />
1. Rawls Creek is a year-round stream that flows into the Saluda River a short<br />
distance downriver from the dam. How much flooding will occur in Rawls<br />
Creek from a dam failure, and how far back will it extend?<br />
2. Could the flood be so massive downstream that water would reach up to<br />
the S.C. State Capitol Building, which is on a hill overlooking the Congaree<br />
River?<br />
Problem B: Tollbooths<br />
Heavily-traveled toll roads such as the Garden State Parkway in New Jersey,<br />
Interstate 95, and so forth, are multilane divided highways that are interrupted<br />
at intervals by toll plazas. Because collecting tolls is usually unpopular, it is<br />
desirable to minimize motorist annoyance by limiting the amount of traffic<br />
disruption caused by the toll plazas. Commonly, a much larger number of<br />
tollbooths is provided than the number of travel lanes entering the toll plaza.<br />
Upon entering the toll plaza, the flow of vehicles fans out to the larger number<br />
of tollbooths, and when leaving the toll plaza, the flow of vehicles is required
Results of the 2005 MCM 191<br />
to squeeze back down to a number of travel lanes equal to the number of travel<br />
lanes before the toll plaza. Consequently, when traffic is heavy, congestion<br />
increases upon departure from the toll plaza. When traffic is very heavy, congestion<br />
also builds at the entry to the toll plaza because of the time required for<br />
each vehicle to pay the toll.<br />
Make a model to help you determine the optimal number of tollbooths to<br />
deploy in a barrier-toll plaza. Explicitly consider the scenario where there is<br />
exactly one tollbooth per incoming travel lane. Under what conditions is this<br />
more or less effective than the current practice? Note that the definition of<br />
“optimal” is up to you to determine.<br />
The Results<br />
The solution papers were coded at COMAP headquarters so that names<br />
and affiliations of the authors would be unknown to the judges. Each paper<br />
was then read preliminarily by two “triage” judges at either Appalachian State<br />
University (Flood Planning Problem) or at the National Security Agency (Tollbooths<br />
Problem). At the triage stage, the summary and overall organization<br />
are the basis for judging a paper. If the judges’ scores diverged for a paper, the<br />
judges conferred; if they still did not agree on a score, a third judge evaluated<br />
the paper.<br />
This year, again an additional Regional Judging site was created at the U.S.<br />
Military Academy to support the growing number of contest submissions.<br />
Final judging took place at Harvey Mudd College, Claremont, California.<br />
The judges classified the papers as follows:<br />
Honorable Successful<br />
Outstanding Meritorious Mention Participation Total<br />
Flood Planning Problem 3 25 50 94 172<br />
Tollbooths Problem 7 60 145 280 492<br />
10 85 195 374 664<br />
The 10 papers that the judges designated as Outstanding appear in this<br />
special issue of The UMAP Journal, together with commentaries. We list those<br />
teams and the Meritorious teams (and advisors) below; the list of all participating<br />
schools, advisors, and results is in the Appendix.
192 The UMAP Journal 26.3 (2005)<br />
Outstanding Teams<br />
Institution and Advisor Team Members<br />
“From Lake Murray to a Dam Slurry”<br />
Harvey Mudd College<br />
Claremont, CA<br />
Jon Jacobsen<br />
Flood Planning Papers<br />
“Through the Breach: Modeling Flooding<br />
from a Dam Failure in South<br />
Carolina”<br />
University of Saskatchewan<br />
Saskatoon, SK, Canada<br />
James Brooke<br />
“Analysis of Dam Failure in the Saluda<br />
River Valley”<br />
University of Washington<br />
Seattle, WA<br />
Rekha Thomas<br />
“The Booth Tolls for Thee”<br />
Duke University<br />
Durham, NC<br />
William G. Mitchener<br />
Tollbooths Papers<br />
“A Single-Car Interaction Model of Traffic<br />
for a Highway Toll Plaza”<br />
Harvard University<br />
Cambridge, MA<br />
Clifford H. Taubes<br />
Clay Hambrick<br />
Katie Lewis<br />
Lori Thomas<br />
Jennifer Kohlenberg<br />
Michael Barnett<br />
Scott Wood<br />
Ryan Bressler<br />
Christina Polwarth<br />
Braxton Osting<br />
Adam Chandler<br />
Matthew Mian<br />
Pradeep Baliga<br />
Sheel Ganatra<br />
Ivan Corwin<br />
Nikita Rozenblyum
“Lane Changes and Close Following:<br />
Troublesome Tollbooth Traffic”<br />
Massachusetts <strong>Institute</strong> of Technology<br />
Cambridge, MA<br />
Martin Bazant<br />
“A Quasi-Sequential Cellular Automaton<br />
Approach to Traffic Modeling”<br />
<strong>Rensselaer</strong> <strong>Polytechnic</strong> <strong>Institute</strong><br />
Troy,NY<br />
Peter Kramer<br />
“Two Tools for Tollbooth Optimization”<br />
University of California, Berkeley<br />
Berkeley, CA<br />
L. Craig Evans<br />
“The Multiple Single-Server Queueing<br />
System”<br />
University of California, Berkeley<br />
Berkeley, CA<br />
Jim Pitman<br />
“For Whom the Booth Tolls”<br />
University of Colorado<br />
Boulder, CO<br />
Anne Dougherty<br />
Meritorious Teams<br />
Results of the 2005 MCM 193<br />
Andrew Spann<br />
Daniel Kane<br />
Dan Gulotta<br />
John Evans<br />
Meral Reyhan<br />
Ephrat Bitton<br />
Anand Kulkarni<br />
Mark Shlimovich<br />
Azra Panjwani<br />
Yang Liu<br />
Huan Qi<br />
Brian Camley<br />
Bradley Klingenberg<br />
Pascal Getreuer<br />
Flood Planning Papers (25 teams)<br />
Albion College, Albion, MI (Darren Mason)<br />
Bucknell University, Lewisburg, PA (Karl Voss)<br />
Carroll College, Helena, MT (Sam Alvey)<br />
China University of Mining and Technology, Xuzhou, Jiangsu, China (Zhang Xingyong)<br />
College of Science, Southeast University, Nanjing, Jiangsu, China (Jia Xingang)<br />
Duke University, Durham, NC (Owen Astrachan)<br />
Fudan University, Shanghai, Shanghai, China (Cai Zhijie )<br />
Harvey Mudd College, Claremont, CA (Jon Jacobsen)<br />
James Madison University, Harrisonburg, VA (James Sochacki)<br />
Lewis and Clark College, Portland, OR (Robert Owens)<br />
McGill University, Montreal, Quebec, Canada (Nilima Nigam)<br />
Midlands Technical College, West Columbia, SC (John Long)
194 The UMAP Journal 26.3 (2005)<br />
Nanjing University, Nanjing, Jiangsu, China (Bo Wen)<br />
National University of Defense Technology, Changsha, Hunan, China (Yi Wu)<br />
NC School of Science & Mathematics, Durham, NC (Daniel Teague)<br />
United States Military Academy, West Point, NY (John Jackson)<br />
University of Delaware, Newark, DE (Louis Rossi)<br />
University of Electronic Science and Technology of China, Chengdu, Sichuan, China<br />
(Gao Qing)<br />
University of Washington, Seattle, WA (James Morrow)<br />
Western Washington University, Bellingham, WA (Saim Ural)<br />
Wuhan University, Wuhan, Hubei, China (Deng Aijiao )<br />
Wuhan University, Wuhan, Hubei, China (Hu Xinqi)<br />
Youngstown State University, Youngstown, OH (Angela Spalsbury)<br />
Zhejiang Gongshang University, Hangzhou, Zhejiang, China (Ding Zhengzhong)<br />
Zhejiang University City College, Hangzhou, Zhejiang, China (Huang Huang)<br />
Tollbooths Papers (60 teams)<br />
Albertson College, Caldwell, ID (Michael Hitchman)<br />
Asbury College, Wilmore, KY (David Coulliette)<br />
Asbury College, Wilmore, KY (Kenneth Rietz)<br />
Beijing Normal University, School of Mathematical Sciences, Beijing, China<br />
(Huang Haiyang)<br />
Bethel University, St. Paul, MN (William Kinney)<br />
California <strong>Polytechnic</strong> State University, San Luis Obispo, CA (Jonathan Shapiro)<br />
Central Washington University, Ellensburg, WA (Stuart Boersma)<br />
Chongqing University, Chongqing, China (Li Fu)<br />
Chongqing University, Chongqing, China (He Renbin)<br />
College of Mount St. Joseph, Cincinnati, OH (Scott Sportsman)<br />
Cornell University, Ithaca, NY (Alexander Vladimirsky)<br />
Davidson College, Davidson, NC (Malcolm Campbell)<br />
Davidson College, Davidson, NC (Mark Foley)<br />
Duke University, Durham, NC (Owen Astrachan)<br />
Duke University, Durham, NC (William Mitchener)<br />
Eastern Oregon University, La Grande, OR (Anthony Tovar)<br />
Harbin <strong>Institute</strong> of Technology Science Faculty, Harbin, Heilongjian, China<br />
(Shang Shouting)<br />
Harvey Mudd College, Claremont, CA (Ran Libeskind-Hadas) (two teams) Hastings<br />
College, Hastings, NE (Dave Cooke)<br />
Jiangsu University, Zhenjiang, Jiangsu, China (Gang Xu)<br />
Kansas State University, Manhattan, KS (David Auckly)<br />
Lafayette College, Easton, PA (Ethan Berkove)<br />
Luther College, Decorah, IA (Reginald Laursen) (two teams)<br />
Nanchang University, Nanchang, Jiangxi, China (Liao Chuangrong)<br />
Northern Kentucky University, Highland Heights, KY (Gail Mackin)<br />
Northwest University, Xián, Shaanxi, China (Wang Liantang)<br />
School of Economics & Management, Tsinghua University, Beijing, China (Xie Qun)<br />
School of Financial Mathematics, Peking University, Beijing, China (Lan Wu)<br />
School of Mathematical Sciences, Peking University, Beijing (Liu Xufeng )<br />
School of Science, Beijing University of Posts and Telecommunications, Beijing, China<br />
(Sun Hongxiang)<br />
Shanghai Jiao Tong University, Shanghai, China (Song Baorui)
Results of the 2005 MCM 195<br />
Shanghai Jiao Tong University, Shanghai, China (Huang Jianguo)<br />
South China University of Technology, Guangzhou, Guangdong, China (Liu Shen Quan)<br />
South-China Normal University, Guangzhou, Guangdong, China (Wang Henggeng)<br />
Southeast University, Nanjing, Jiangsu, China (Dan He)<br />
Southeast University, Nanjing, Jiangsu, China (Wang Liyan)<br />
Truman State University, Kirksville, MO (Steve Smith)<br />
Tsinghua University, Beijing, China (Hu Zhiming)<br />
Tsinghua University, Beijing, China (Lu Mei)<br />
University College Cork, Cork, Ireland (Donal Hurley)<br />
University of California, Berkeley, Berkeley, CA (Lawrence Evans)<br />
University of Colorado at Boulder, Boulder, CO (Michael Ritzwoller)<br />
University of Delaware, Newark, DE (Louis Rossi)<br />
University of Pittsburgh, Pittsburgh, PA (Christopher Earls)<br />
University of Pittsburgh, Pittsburgh, PA (Jonathan Rubin)<br />
University of Puget Sound, Tacoma, WA (DeWayne Derryberry)<br />
University of Richmond, Richmond, VA (Kathy Hoke) (two teams)<br />
University of Saskatchewan, Saskatoon, SK, Canada (James Brooke)<br />
University of Western Ontario, London, ON, Canada (Allan MacIsaac)<br />
Wake Forest University, Winston-Salem, NC (Miaohua Jiang) (two teams)<br />
Wesleyan College, Macon, GA (Joseph Iskra)<br />
Western Washington University, Bellingham, WA (Saim Ural)<br />
Worcester <strong>Polytechnic</strong> <strong>Institute</strong>, Worcester, MA (Suzanne Weekes)<br />
Wuhan University, Wuhan, Hubei, China (Chen Wenyi)<br />
Wuhan University of Technology, Wuhan, Hubei, China (Huang Wei)<br />
Zhejiang University, Hangzhou, Zhejiang, China (Yong He)<br />
Awards and Contributions<br />
Each participating MCM advisor and team member received a certificate<br />
signed by the Contest Director and the appropriate Head Judge.<br />
INFORMS, the <strong>Institute</strong> for Operations Research and the Management Sciences,<br />
recognized the teams from the University of Washington (Flood Planning<br />
Problem) and University of California, Berkeley (Advisor: Jim Pitman) (Tollbooths<br />
Problem) as INFORMS Outstanding teams and provided the following<br />
recognition:<br />
• a letter of congratulations from the current president of INFORMS to each<br />
team member and to the faculty advisor;<br />
• a check in the amount of $300 to each team member;<br />
• abronze plaque for display at the team’s institution, commemorating their<br />
achievement;<br />
• individual certificates for team members and faculty advisor as a personal<br />
commemoration of this achievement;
196 The UMAP Journal 26.3 (2005)<br />
• a one-year student membership in INFORMS for each team member, which<br />
includes their choice of a professional journal plus the OR/MS Today periodical<br />
and the INFORMS society newsletter;<br />
• a one-year subscription access to the COMAP modeling materials Website<br />
for the faculty advisor.<br />
The Society for Industrial and Applied Mathematics (SIAM) designated one<br />
Outstanding team from each problem as a SIAM Winner. The teams were from<br />
Harvey Mudd College (Flood Planning Problem) and <strong>Rensselaer</strong> <strong>Polytechnic</strong><br />
<strong>Institute</strong> (Tollbooths Problem). Each of the team members was awarded a $300<br />
cash prize and the teams received partial expenses to present their results in a<br />
special Minisymposium at the SIAM Annual Meeting in New Orleans in July.<br />
Their schools were given a framed hand-lettered certificate in gold leaf.<br />
The Mathematical Association of America (MAA) designated one Outstanding<br />
team from each problem as an MAA Winner. The teams were from the<br />
University of Saskatchewan (Flood Planning Problem) and Duke University<br />
(Tollbooths Problem). With partial travel support from the MAA, both teams<br />
presented their solutions at a special session of the MAA Mathfest in Albuquerque,<br />
NM in August. Each team member was presented a certificate by<br />
Richard S. Neal, Co-Chair of the MAA Committee on Undergraduate Student<br />
Activities and Chapters.<br />
Ben Fusaro Award<br />
Two Meritorious papers were selected for the Ben Fusaro Award, named for<br />
the Founding Director of the MCM and awarded for the second time this year.<br />
It recognizes an especially creative approach; details concerning the award,<br />
its judging, and Ben Fusaro are in The UMAP Journal 25 (3) (2004): 195–196.<br />
The Ben Fusaro Award teams were from McGill University (Flood Planning<br />
Problem) and University of California, Berkeley (Advisor: Lawrence Evans)<br />
(Tollbooths Problem). Each team received a plaque from COMAP.<br />
Judging<br />
Director<br />
Frank R. Giordano, Naval Postgraduate School, Monterey, CA<br />
Associate Directors<br />
Robert L. Borrelli, Mathematics Dept., Harvey Mudd College, Claremont, CA<br />
Patrick J. Driscoll, Dept. of Systems Engineering, U.S. Military Academy,<br />
West Point, NY<br />
Contest Coordinator<br />
Kevin Darcy, COMAP Inc., Lexington, MA
Flood Planning Problem<br />
Results of the 2005 MCM 197<br />
Head Judge<br />
Marvin S. Keener, Executive Vice-President, Oklahoma State University,<br />
Stillwater, OK (MAA)<br />
Associate Judges<br />
Peter Anspach, National Security Agency, Ft. Meade, MD (Triage)<br />
Courtney Coleman, Mathematics Dept., Harvey Mudd College,<br />
Claremont, CA (SIAM)<br />
Ben Fusaro, Mathematics Dept., Florida State University, Tallahassee, FL<br />
Jerry Griggs, Mathematics Dept., University of South Carolina, Columbia, SC<br />
John Kobza, Mathematics Dept., Texas Tech University, Lubbock, TX<br />
(INFORMS)<br />
Michael Moody, Olin College of Engineering, Needham, MA<br />
Kathleen M. Shannon, Dept. of Mathematics and Computer Science,<br />
Salisbury University, Salisbury, MD (MAA)<br />
Daniel Zwillinger, Newton, MA (SIAM)<br />
Tollbooths Problem<br />
Head Judge<br />
Maynard Thompson, Mathematics Dept., University of Indiana,<br />
Bloomington, IN<br />
Associate Judges<br />
William C. Bauldry, Chair, Dept. of Mathematical Sciences,<br />
Appalachian State University, Boone, NC (Triage)<br />
Kelly Black, Mathematics Dept., University of New Hampshire,<br />
Durham, NH (SIAM)<br />
Karen D. Bolinger, Mathematics Dept., Clarion University of Pennsylvania,<br />
Clarion, PA (SIAM)<br />
J. Douglas Faires, Youngstown State University, Youngstown, OH (SIAM)<br />
William P. Fox, Mathematics Dept., Francis Marion University, Florence, SC<br />
Mario Juncosa, RAND Corporation, Santa Monica, CA (retired)<br />
Don Miller, Mathematics Dept., St. Mary’s College, Notre Dame, IN<br />
John L. Scharf, Mathematics Dept., Carroll College, Helena, MT<br />
Dan Solow, Mathematics Dept., Case Western Reserve University,<br />
Cleveland, OH (INFORMS)<br />
Michael Tortorella, Dept. of Industrial and Systems Engineering,<br />
Rutgers University, Piscataway, NJ<br />
Marie Vanisko, Dept. of Mathematics, California State University,<br />
Stanislaus, CA (MAA)<br />
Richard Douglas West, Francis Marion University, Florence, SC
198 The UMAP Journal 26.3 (2005)<br />
Regional Judging Session<br />
Head Judge<br />
Patrick J. Driscoll, Dept. of Systems Engineering<br />
Associate Judges<br />
Darrall Henderson, Dept. of Mathematical Sciences<br />
Steven Henderson, Dept. of Systems Engineering<br />
Steven Horton, Dept. of Mathematical Sciences<br />
Michael Jaye, Dept. of Mathematical Sciences<br />
—all of the U.S. Military Academy, West Point, NY<br />
Triage Sessions:<br />
Flood Planning Problem<br />
Head Triage Judge<br />
Peter Anspach, National Security Agency (NSA), Ft. Meade, MD<br />
Associate Judges<br />
Dean McCullough, High Performance Technologies, Inc.<br />
Robert L. Ward (retired)<br />
Blair Kelly,<br />
Craig Orr,<br />
Brian Pilz,<br />
Eric Schram,<br />
and other members of NSA.<br />
Tollbooths Problem<br />
Head Triage Judge<br />
William C. Bauldry, Chair<br />
Associate Judges<br />
Terry Anderson,<br />
Mark Ginn,<br />
Jeff Hirst,<br />
Rick Klima,<br />
Katie Mawhinney,<br />
and<br />
Vickie Williams<br />
—all from Dept. of Math’l Sciences, Appalachian State University, Boone, NC
Results of the 2005 MCM 199<br />
Fusaro Award Committee<br />
Flood Planning Problem:<br />
Peter Anspach, National Security Agency, Ft. Meade, MD<br />
Michael Moody, Olin College of Engineering, Needham, MA<br />
Tollbooths Problem:<br />
William C. Bauldry, Chair, Dept. of Mathematical Sciences,<br />
Appalachian State University, Boone, NC<br />
Kathleen M. Shannon, Dept. of Mathematics and Computer Science,<br />
Salisbury University, Salisbury, MD<br />
Sources of the Problems<br />
The Flood Planning Problem was contributed by Jerry Griggs (Mathematics<br />
Dept., University of South Carolina, Columbia, SC).<br />
The Tollbooths Problem was contributed by Michael Tortorella (Dept. of<br />
Industrial and Systems Engineering, Rutgers University, Piscataway, NJ).<br />
Acknowledgments<br />
Major funding for the MCM is provided by the National Security Agency<br />
and by COMAP. We thank Dr. Gene Berg of NSA for his coordinating efforts.<br />
Additional support is provided by the <strong>Institute</strong> for Operations Research and<br />
the Management Sciences (INFORMS), the Society for Industrial and Applied<br />
Mathematics (SIAM), and the Mathematical Association of America (MAA).<br />
We are indebted to these organizations for providing judges and prizes.<br />
This year we have two new sponsors, whom we thank for their involvement<br />
and support:<br />
• IBM Business Consulting Services, Center for Business Optimization; and<br />
• Two Sigma Investments. (This group of experienced, analytical, and technical<br />
financial professionals based in New York builds and operates sophisticated<br />
quantitative trading strategies for domestic and international markets.<br />
The firm is successfully managing several billion dollars using highly automated<br />
trading technologies. For more information about Two Sigma, please<br />
visit \http://www.twosigma.com.)<br />
We thank the MCM judges and MCM Board members for their valuable<br />
and unflagging efforts. Harvey Mudd College, its Mathematics Dept. staff,<br />
and Prof. Borrelli were gracious hosts to the judges.
200 The UMAP Journal 26.3 (2005)<br />
Cautions<br />
To the reader of research journals:<br />
Usually a published paper has been presented to an audience, shown to<br />
colleagues, rewritten, checked by referees, revised, and edited by a journal<br />
editor. Each of the student papers here is the result of undergraduates working<br />
on a problem over a weekend; allowing substantial revision by the authors<br />
could give a false impression of accomplishment. So these papers are essentially<br />
au naturel. Editing (and sometimes substantial cutting) has taken place: Minor<br />
errors have been corrected, wording has been altered for clarity or economy,<br />
and style has been adjusted to that of The UMAP Journal. Please peruse these<br />
student efforts in that context.<br />
To the potential MCM Advisor:<br />
It might be overpowering to encounter such output from a weekend of<br />
work by a small team of undergraduates, but these solution papers are highly<br />
atypical. A team that prepares and participates will have an enriching learning<br />
experience, independent of what any other team does.<br />
COMAP’s Mathematical Contest in Modeling and Interdisciplinary Contest<br />
in Modeling are the only international modeling contests in which students<br />
work in teams. Centering its educational philosophy on mathematical modeling,<br />
COMAP uses mathematical tools to explore real-world problems. It serves<br />
the educational community as well as the world of work by preparing students<br />
to become better-informed and better-prepared citizens.
Appendix: Successful Participants<br />
KEY:<br />
P = Successful Participation<br />
H = Honorable Mention<br />
M=Meritorious<br />
O=Outstanding (published in this special issue)<br />
Results of the 2005 MCM 201<br />
INSTITUTION CITY ADVISOR A B<br />
CALIFORNIA<br />
Cal Poly Pomona Pomona Hubertus von Bremen P<br />
Ioana Mihaila P<br />
Peter Siegel P<br />
California Baptist U. Riverside Catherine Kong P<br />
Calif. Poly. State U. San Luis Obispo Jonathan Shapiro M,P<br />
Calif. State Poly. U. Pomona Kurt Vandervoort P<br />
Calif. State U. Seaside Hongde Hu P<br />
Jeffrey Groah P<br />
Hartnell College Salinas Kelly Locke P<br />
Harvey Mudd College Claremont Jon Jacobsen O,M<br />
(CS) Ran Libeskind-Hadas M,M<br />
Pomona College Claremont Ami Radunskaya P<br />
Univ. of California Berkeley L. Craig Evans O,M<br />
(Stat) Jim Pitman O<br />
COLORADO<br />
Colorado College Colorado Springs David Brown P<br />
Colorado State Univ. Pueblo Bruce Lundberg P<br />
Regis University Denver David Bahr H,P<br />
USAF Academy USAF Timothy Cooley P H<br />
James Rolf P<br />
Univ. of Colorado Boulder Anne Dougherty O<br />
Bengt Fornberg H<br />
Michael Ritzwoller M<br />
Denver Lynn Bennethum H<br />
Michael Jacobson H<br />
U. of Northern Colo. Greeley Nathaniel Miller P<br />
CONNECTICUT<br />
Southern Conn. State U. New Haven Ross Gingrich H<br />
Western Conn. State U. Danbury Josephine Hamer P<br />
DELAWARE<br />
Univ. of Delaware Newark Louis Rossi M M
202 The UMAP Journal 26.3 (2005)<br />
INSTITUTION CITY ADVISOR A B<br />
FLORIDA<br />
Embry-Riddle University Daytona Beach Greg Spradlin H<br />
Jacksonville University Jacksonville Robert Hollister H<br />
GEORGIA<br />
Georgia Southern Univ. Statesboro Laurene Fausett H P<br />
State Univ. of West Georgia Carrollton Scott Gordon H<br />
Wesleyan College Macon Charles Benesh P<br />
Joseph Iskra M,H<br />
IDAHO<br />
Albertson College Caldwell Michael Hitchman P M<br />
Idaho State University Pocatello Robert Van Kirk P<br />
ILLINOIS<br />
Greenville College Greenville George Peters P<br />
Illinois <strong>Institute</strong> of Tech. Chicago Michael Pelsmajer P<br />
Monmouth College Monmouth Howard Dwyer H<br />
Christopher Fasano H<br />
Northern Illinois Univ. DeKalb Chris Hurlburt H,H<br />
Wheaton College Wheaton Paul Isihara P<br />
INDIANA<br />
Earlham College Richmond Mic Jackson P P<br />
(CS) Charlie Peck P<br />
Franklin College Franklin John Boardman P<br />
Rose-Hulman Inst. of Tech. Terre Haute David Rader H,H<br />
Saint Mary’s College Notre Dame Joanne Snow H,P<br />
IOWA<br />
Grinnell College Grinnell Charles Cunningham P<br />
Karen Shuman P,P<br />
Luther College Decorah Steve Hubbard P<br />
Reginald Laursen M,M<br />
Mt. Mercy College Cedar Rapids K.R. Knopp P<br />
Simpson College Indianola James Bohy H<br />
Jeff Parmelee P<br />
Murphy Waggoner H,P<br />
Wartburg College Waverly Brian Birgen P<br />
KANSAS<br />
Emporia State University Emporia Brian Hollenbeck P<br />
Kansas State University Manhattan David Auckly M,P
Results of the 2005 MCM 203<br />
INSTITUTION CITY ADVISOR A B<br />
KENTUCKY<br />
Asbury College Wilmore David Coulliette M<br />
Kenneth Rietz M<br />
Brescia University Owensboro Chris Tiahrt P<br />
Morehead State University Morehead Michael Dobranski P<br />
Northern Kentucky University Highland Heights Gail Mackin P M<br />
Thomas More College Crestview Hills Robert Riehemann P<br />
MAINE<br />
Colby College Waterville Jan Holly P<br />
MARYLAND<br />
Hood College Frederick Betty Mayfield H<br />
Johns Hopkins University Baltimore Greg Eyink H<br />
Fred Torcaso H,P<br />
Loyola College Baltimore Jiyuan Tao P<br />
Mount St. Mary’s University Emmitsburg Fred Portier P P<br />
Salisbury University Salisbury Michael Bardzell P<br />
Villa Julie College Stevenson Eileen McGraw P<br />
Washington College Chestertown Eugene Hamilton P<br />
MASSACHUSETTS<br />
College of the Holy Cross Worcester Gareth Roberts P<br />
Harvard University Cambridge Clifford Taubes O<br />
MIT Cambridge Martin Bazant O<br />
Olin College of Engineering Needham Burt Tilley H<br />
Salem State College Salem Kenny Ching P<br />
Simon’s Rock College Great Barrington Allen Altman P,P<br />
Michael Bergman P P<br />
Smith College Northampton Ruth Haas H<br />
University of Massachusetts Lowell James Graham-Eagle P<br />
Western New England College Springfield Lorna Hanes P<br />
Worcester <strong>Polytechnic</strong> <strong>Institute</strong> Worcester Suzanne Weekes M,P<br />
MICHIGAN<br />
Albion College Albion Darren Mason M P<br />
Ferris State University Big Rapids Holly Price H<br />
Lawrence Technological University Southfield Ruth Favro H P<br />
Valentina Tobos H<br />
Siena Heights University Adrian Pamela Warton P,P<br />
Tim Husband H<br />
MINNESOTA<br />
Bethel University St. Paul William Kinney M,P<br />
Minnesota State University Moorhead Ellen Hill P<br />
Saint John’s University Collegeville Robert Hesse H
204 The UMAP Journal 26.3 (2005)<br />
INSTITUTION CITY ADVISOR A B<br />
MISSOURI<br />
Drury University Springfield Bruce Callen P<br />
Bob Robertson H P<br />
Northwest Missouri State University Maryville Russell Euler H<br />
Saint Louis University St. Louis James Dowdy H<br />
Southeast Missouri State University Cape Girardeau Robert Sheets P<br />
Truman State University Kirksville Steve Smith M<br />
MONTANA<br />
Carroll College Helena Sam Alvey M P<br />
Kelly Cline H,P<br />
NEBRASKA<br />
Hastings College Hastings Dave Cooke M<br />
NEW JERSEY<br />
New Jersey <strong>Institute</strong> of Technology Newark Roy Goodman P<br />
Rowan University Glassboro Hieu Nguyen H,H<br />
NEW MEXICO<br />
New Mexico Tech Socorro Brian Borchers P<br />
NEW YORK<br />
Clarkson University Potsdam Kathleen Fowler H H<br />
William Hesse P<br />
Colgate University Hamilton Warren Weckesser H<br />
Concordia College Bronxville John Loase H,P<br />
Cornell University Ithaca Alexander Vladimirsky P M<br />
Hobart and William Smith Colleges Geneva Scotty Orr P<br />
Ithaca College Ithaca John Maceli H<br />
Nazareth College Rochester Daniel Birmajer H<br />
<strong>Rensselaer</strong> <strong>Polytechnic</strong> <strong>Institute</strong> Troy Peter Kramer O,P<br />
Roberts Wesleyan College Rochester Gary Raduns P<br />
United States Military Academy West Point J. Billie H<br />
John Jackson M<br />
Sakura Therrien P<br />
Westchester Community College Valhalla Marvin Littman P<br />
NORTH CAROLINA<br />
Appalachian State University Boone Holly Hirst P<br />
Davidson College Davidson Malcolm Campbell M<br />
Tim Chartier H,H<br />
Mark Foley M<br />
Duke University Durham William Mitchener O,M<br />
(CS) Owen Astrachan M M
Results of the 2005 MCM 205<br />
INSTITUTION CITY ADVISOR A B<br />
Meredith College Raleigh Cammey Cole P<br />
NC School of Science & Math. Durham Daniel Teague M P<br />
Wake Forest University Winston-Salem Miaohua Jiang M,M<br />
OHIO<br />
Bowling Green State Univ. Bowling Green Juan Bes P<br />
College of Mount St. Joseph Cincinnati Scott Sportsman M<br />
Malone College Canton David Hahn P<br />
Miami University Oxford Doug Ward P<br />
University of Dayton Dayton Youssef Raffoul H<br />
Youngstown State University Youngstown Angela Spalsbury M H<br />
(CS) Michael Crescimanno P<br />
OKLAHOMA<br />
Oklahoma State University Stillwater Lisa Mantini H<br />
OREGON<br />
Eastern Oregon University La Grande David Allen P<br />
Anthony Tovar M<br />
Lewis and Clark College Portland Robert Owens M P<br />
Linfield College McMinnville Jennifer Nordstrom P,P<br />
Pacific University Forest Grove Christine Guenther P<br />
Southern Oregon University Ashland Kemble Yates H<br />
Western Oregon University Monmouth Maria Fung P<br />
PENNSYLVANIA<br />
Bloomsburg University Bloomsburg Kevin Ferland H P<br />
Bucknell University Lewisburg Karl Voss M<br />
Clarion Univ. of Pennsylvania Clarion Dana Madison H<br />
Drexel University Philadelphia Hugo Woerdeman P<br />
Gannon University Erie Michael Caulfield H,P<br />
Gettysburg College Gettysburg Bogdan Doytchinov P<br />
Juniata College Huntingdon John Bukowski H<br />
Lafayette College Easton Ethan Berkove M,P<br />
Slippery Rock University Slippery Rock Richard Marchand P<br />
University of Pittsburgh Pittsburgh Jonathan Rubin H M<br />
(Eng) Christopher Earls M<br />
Westminster College New Wilmington Barbara Faires H<br />
SOUTH CAROLINA<br />
Benedict College Columbia Balaji Iyangar P<br />
Francis Marion University Florence Thomas Fitzkee P<br />
Midlands Technical College West Columbia John Long M,H
206 The UMAP Journal 26.3 (2005)<br />
INSTITUTION CITY ADVISOR A B<br />
SOUTH DAKOTA<br />
Mount Marty College Yankton Bonita Gacnik P<br />
Stephanie Gruver P P<br />
James Miner P<br />
SD School of Mines and Technology Rapid City Robert Kowalski P<br />
Kyle Riley H<br />
TENNESSEE<br />
Austin Peay State University Clarksville Nell Rayburn P<br />
TEXAS<br />
Angelo State University San Angelo Karl Havlak P<br />
Austin College Sherman John Jaroma P<br />
Trinity University San Antonio Richard Cooper P<br />
Allen Holder P<br />
VIRGINIA<br />
Eastern Mennonite University Harrisonburg Charles Cooley P<br />
Leah Boyer H,H<br />
James Madison University Harrisonburg Hasan Hamdan H<br />
Caroline Smith P<br />
James Sochacki M<br />
Maggie Walker Governor’s School Richmond John Barnes P,P<br />
Harold Houghton P,P<br />
Roanoke College Salem Jeffrey Spielman P<br />
University of Richmond Richmond Kathy Hoke M,M<br />
Virginia Western Community College Roanoke Steve Hammer P<br />
Ruth Sherman P<br />
WASHINGTON<br />
Central Washington University Ellensburg Stuart Boersma M<br />
Heritage University Toppenish Richard Swearingen P H<br />
Pacific Lutheran University Tacoma Daniel Heath P,P<br />
University of Puget Sound Tacoma DeWayne Derryberry M<br />
University of Washington Seattle James Morrow M H<br />
Rekha Thomas O H<br />
Western Washington University Bellingham Saim Ural M M<br />
Tjalling Ypma P,P<br />
WISCONSIN<br />
Northland College Ashland William Long P,P
Results of the 2005 MCM 207<br />
INSTITUTION CITY ADVISOR A B<br />
CANADA<br />
Dalhousie University Halifax Dorothea Pronk P,P<br />
McGill University Montreal Antony Humphries H<br />
Nilima Nigam M<br />
University of Saskatchewan Saskatoon James Brooke O M<br />
University of Western Ontario London Allan MacIsaac M<br />
York University Toronto Hongmei Zhu P<br />
Huaiping Zhu H P<br />
CHINA<br />
Anhui<br />
Anhui University Hefei Wang Xuejun H<br />
Zhu Xiaobao P<br />
Zhang Quanbing P<br />
Wu Yunqi P<br />
Anhui Univ. of Technology and Science Wuhu Wang Chuanyu P<br />
Hefei University of Technology Hefei Gu Junli H<br />
Zheng Qi P<br />
Du Xueqiao P<br />
Huang Youdu P<br />
Univ. of Science and Technology of China Hefei Liu Yanjun P<br />
Huang Zhangjin P<br />
Yang Zhouwang P<br />
(CS) Sun Guangzhong P<br />
Beijing<br />
BeiHang University Beijing Wu Sanxing H<br />
Beijing <strong>Institute</strong> of Science and Technology Beijing Sun Huafei H<br />
Beijing <strong>Institute</strong> of Technology Beijing Wang Hongzhou H P<br />
Yan Guifeng H P<br />
Beijing Jiaotong University Beijing Wu Faen P<br />
Wang Xiujuan P,P<br />
(Eng) Deng Xiaoqin P<br />
(Info) Wang Bingtuan P,P<br />
(Sci) Feng Guochen P<br />
Liu Minghui H P<br />
Wang Xiaoxia H<br />
Beijing Language and Culture University (CS) Beijing Liu Guilong P P<br />
Beijing Materials <strong>Institute</strong> Beijing Li Zhenping P P<br />
Cheng Xiaohong P,P
208 The UMAP Journal 26.3 (2005)<br />
INSTITUTION CITY ADVISOR A B<br />
Beijing Normal University Beijing Cui Hengjian P H<br />
Shen Fuxing H<br />
He Qing P,P<br />
Peng Fanglin P<br />
Wang Jiayin H<br />
Huang Haiyang M<br />
Liu Laifu P<br />
Beijing University of Chemical Technology Beijing Liu Damin P<br />
Jiang Guangfeng H<br />
Yuan Wenyan P<br />
Jiang Xinhua P<br />
Beijing University of Posts and Telecomm. Beijing Ding Jinkou H<br />
Zhang Wenbo P<br />
Wu Yunfeng H<br />
(Sci) Sun Hongxiang M<br />
He Zuguo H H<br />
(Applied Sci) Xue Yi P<br />
Beijing University of Technology Beijing Chang Jingang P<br />
Guo Sili P<br />
Yang Shilin P P<br />
Central University of Finance and Economics Beijing Ge Binhua H H<br />
Huang Huiqing H,P<br />
China Agricultural University Beijing Zou Hui H,P<br />
Peking University Beijing Wang Ming P<br />
Deng Minghua H,P<br />
(CS) Tang Huazhong P<br />
(Econ) Lan Wu M<br />
Liu Xufeng M,P<br />
Renmin University of China (Statistics) Beijing Jin Yang P<br />
Tsinghua University Beijing Hu Zhiming M,H<br />
Lu Mei M,H<br />
(Econ) Xie Qun M<br />
Chongqing<br />
Chongqing University Chongqing Li Chuandong P<br />
Liu Qiongfang P<br />
He Renbin M<br />
Duan Zhengmin H<br />
Wang Zongli P<br />
(Chem) Li Zhiliang H<br />
(CS) Fu Li M<br />
Fujian<br />
Xiamen University (Info) Xiamen Zheng Xiaolian H
Results of the 2005 MCM 209<br />
INSTITUTION CITY ADVISOR A B<br />
Guangdong<br />
Jinan University Guangzhou Hu Daiqiang H<br />
Fan Suohai P<br />
(CS) Luo Shizhuang H<br />
(Electronics) Ye Shiqi P<br />
Shandong University Jinan Ma Jianhua P<br />
South-China Normal University Guangzhou Wang Henggeng M<br />
(CS) Li Hunan P P<br />
(Info) Yu Jianhua H<br />
(Phys) Liu Xiuxiang H,P<br />
South China University of Technology Guangzhou Liang Man Fa P<br />
Liu Shen Quan M<br />
Qin Yong An P<br />
Liu Xiao Lan H<br />
Sun Yat-Sen University Guangzhou Feng Guo H<br />
Jiang Xiao Long H<br />
Chen Ze Peng P<br />
Yuan Zhou H<br />
Hebei<br />
Hebei <strong>Polytechnic</strong> University Tangshan Wan Xinghuo H<br />
Xiao Jixian P<br />
Tan Yili H<br />
North China Electric Power University Baoding Gu Gendai H<br />
Liu Jinggang H<br />
Shi Huifeng H<br />
Zhang Po P<br />
Shijiazhuang University of Economics Shijiazhuang Peng Jianping P<br />
Kang Na P<br />
Heilongjiang<br />
Jia Mu-Si University Jia Mu-si Fan Wei H<br />
Zhang Hong P P<br />
Harbin Engineering University Harbin Yu Fei P<br />
Zhang XiaoWei P<br />
Luo Yue Sheng P<br />
Harbin <strong>Institute</strong> of Technology Harbin Shang Shouting H M<br />
Zhang Chiping P,P<br />
Jiao Guanghong P,P<br />
Liu Kean P H<br />
Wang Xilian H P<br />
(Econ) Wei Shang H<br />
(Sci) Hong Ge P,P
210 The UMAP Journal 26.3 (2005)<br />
INSTITUTION CITY ADVISOR A B<br />
Harbin Medical University Harbin Wang QiangHu P,P<br />
Harbin University of Science and Technology Harbin Li Dongmei H<br />
Chen Dongyan H<br />
Tian Guangyue H<br />
Wang Shuzhong H<br />
Northeast Agricultural University Harbin Li Fangge P<br />
Hubei<br />
China University of Geosciences Wuhan Luo Wenqiang P<br />
(CS) Cai Zhihua P<br />
Huazhong University of Science & Technology Wuhan Yuan Linjie P<br />
Wang Yongji P<br />
Wuhan University Wuhan Deng Aijiao M H<br />
Zhong Liuyi H<br />
Chen Wenyi M,H<br />
Hu Xinqi M<br />
Yi Xuming P<br />
(Eng) Luo Zhuangchu P<br />
Wuhan University of Technology Wuhan Chen Ye H<br />
Chu Jie P<br />
He Lang H<br />
Huang Wei M<br />
Li Guang H,P<br />
Hunan<br />
Central South University Changsha He Wei H<br />
Yi Kunnan P<br />
Zhang Hongyan P<br />
(Bio) Zhang Dianzhong P<br />
Hunan University Changsha Li Xiaopei P<br />
(Applied Math.) Ma Bolin P<br />
(Info) Ma Chuanxiu P<br />
(Stat) Luo Han P<br />
National University of Defense Technology Changsha Duan Xiaojun P<br />
Mao Ziyang P<br />
(Math. & System Science) Cheng Lizhi P<br />
Wu Yi M<br />
Inner Mongolia<br />
Inner Mongolia University Hohhot Wang Mei P<br />
Ma Zhuang P
Results of the 2005 MCM 211<br />
INSTITUTION CITY ADVISOR A B<br />
Jiangsu<br />
China Univ. of Mining and Technology Xuzhou Wu Zongxiang H<br />
Zhang Xingyong M<br />
Zhu Kaiyong H,P<br />
HoHai University Suzhou Rong Shen P<br />
Jiangsu University Zhenjiang Xu Gang M,H<br />
Li Yimin H,P<br />
Nanjing University Nanjing Wu Zhaoyang P<br />
Chunying Duan P<br />
YaoTianxing H,H<br />
(Phys) Wen Bo M<br />
Nanjing Univ. of Finance and Economics Nanjing Wang Geng P<br />
Nanjing Univ. of Posts and Telecomm. Nanjing He Ming H,H<br />
Nanjing University of Sci. & Tech. Nanjing Xu Chungen H<br />
Liu Liwei P<br />
Chen Peixin H<br />
Zhang Zhengjun P<br />
Southeast University Nanjing He Dan M<br />
Wang Liyan M<br />
Zhang Zhiqiang P P<br />
(Sci) Jia Xingang M,P<br />
Sun Zhizhong P,P<br />
Xuzhou <strong>Institute</strong> of Technology Xuzhou Jiang Yingzi H H<br />
Jiangxi<br />
East China Inst. of Tech. (Foreign Lang.) Fuzhou Cai Ying P<br />
Jiangxi Normal University Nanchang Wu Gengxiu H<br />
Xiongjun P<br />
Nanchang University Nanchang Chen Tao H<br />
Chen Yuju P<br />
Liao Chuangrong M<br />
Ma Xinsheng Ma P<br />
Jilin<br />
Jilin University Changchun Zou Yongkui H,P<br />
(Bio) Zhou Lai H<br />
(Eng) Fang Peichen H,H<br />
Pei Yongchen P,P<br />
Northeast Normal University Changchun Li Zuofeng P P
212 The UMAP Journal 26.3 (2005)<br />
INSTITUTION CITY ADVISOR A B<br />
Liaoning<br />
Dalian Maritime University Dalian Zhang Yunjie P P<br />
(CS) Yang Shuqin P,P<br />
Dalian Nationalities University Dalian Guo Qiang P H<br />
(CS) Li Xiaoniu H,H<br />
Dalian University Dalian Tan Xinxin H,P<br />
(Info) Gang Jiatai P<br />
Dalian University of Technology Dalian Yu Hongquan H,P<br />
Liu Jianguo P<br />
Zhao Lizhong H,H<br />
Wang Yi H<br />
Li Lianfu P<br />
Gao Xubin P,P<br />
(Inst. of Univ. Students’ Innovation) Zhou Qi H,H<br />
Pan Qiuhui H<br />
Liaoning High Police Academic School Dalian Shen Cong P,P<br />
Northeastern University Shenyang Sun Ping H,P<br />
(Info) Hao Peifeng H,P<br />
He Xuehong H,H<br />
(Eng) Cui Jianjiang P H<br />
(CS) Liu Huilin P H<br />
Shenyang <strong>Institute</strong> of Aero. Engineering Shenyang Shan, Feng P,P<br />
Zhu Limei H,H<br />
Shaanxi<br />
Northwestern <strong>Polytechnic</strong>al University Xi’an Zhao Xuanmin H<br />
Sun Hao P<br />
Liu Xiaodong P<br />
(Chem) Peng Guohua P<br />
Zhang Shenggui P<br />
(Phys) Shi Yimin H<br />
Xiao Huayong H<br />
Northwest University Xi’an Dou Jihong P<br />
He Ruichan P<br />
Wang Liantang M<br />
Xi’an Communication <strong>Institute</strong> (Info) Xi’an Wang Hong P<br />
Kang Jinlong P<br />
Song Xiaofeng P<br />
(Sci) Xi’an Li Guo P<br />
Yang Dongsheng P<br />
Zhang Jianhang P<br />
Jiang Yan P
Results of the 2005 MCM 213<br />
INSTITUTION CITY ADVISOR A B<br />
Xi’an Jiaotong University Xi’an He Xiaoliang H,H<br />
Dai Yonghong H<br />
(Applied Math.) Zhou Yicang P<br />
Xidian University Xi’an Liu Hongwei P<br />
Bo Liefeng P<br />
Ye Feng P<br />
Tang Houjian P<br />
Shandong<br />
Shandong University Jinan Liu Baodong P<br />
Huang Shuxiang P<br />
Huang Shuxiang P,P<br />
Ma Jianhua P,P<br />
Huang Shuxiang P<br />
(CS) Liu Dong P<br />
Shanghai<br />
Donghua University Shanghai You Surong P<br />
Chen Chao P<br />
He Guoxin P<br />
Wang ZhiJie P<br />
East China University of Sci. and Technology Shanghai Liu Zhaohui P<br />
Qin Yan H<br />
Su Chunjie P<br />
Sun Jun P<br />
Wang Haitao P<br />
(Bio) Chen Haoming P<br />
Fudan University Shanghai Cao Yuan P<br />
Cai Zhijie M<br />
Jiading No. 1 Middle School Shanghai Xie Xilin and<br />
Fang Yunping P,P<br />
Shanghai Foreign Language School Shanghai Pan Liqun H,H<br />
Sun Yu H,P<br />
Shanghai Jiao Tong University Shanghai Song Baorui M<br />
Huang Jianguo M,P<br />
(Minhang Branch) Shanghai Zhou Gang P P<br />
Zhou Guobiao P,P<br />
Shanghai Normal University Shanghai Liu Rongguan P<br />
Guo Shenghuan P<br />
Shi Yongbing<br />
Zhang Jizhou and<br />
H<br />
Zhu Detong P
214 The UMAP Journal 26.3 (2005)<br />
INSTITUTION CITY ADVISOR A B<br />
Shanghai University of Finance and Economics Shanghai Dong Dong-cheng P<br />
Yu Juntai H<br />
Yin Chenyuan H<br />
Li Tao H<br />
Shanghai Xiangming High School Shanghai Feng Qiang P,P<br />
Shanghai Youth Centre of Sci. and Tech. Educ. Shanghai Chen Gan P<br />
Shanghai Yucai High School Shanghai Li Zhengtai P<br />
Tongji University Shanghai Zhang Hualong P<br />
Chen Xiongda H<br />
Gui Zipeng P<br />
Sichuan<br />
Chengdu University of Technology Chengdu Yuan Yong P<br />
WeiYouhua P<br />
Sichuan University Chengdu Niu Hai P<br />
Zhou Jie H<br />
Univ. of Electronic Sci. and Tech. of China Chengdu Gao Qing M H<br />
Qin Siyi H<br />
Xu Quanzi H<br />
Southwest Jiaotong University E’mei Zhao Lianwen P P<br />
Tianjin<br />
Nankai University Tianjin Wang Yi P<br />
Zhang Chunsheng P<br />
Chen Dianfa P<br />
Zhou Xingwei H<br />
Wang Zhaojun P<br />
Tianjin University Tianjin Liang Fengzhen H<br />
Xu Genqi P,P<br />
Lan Guoliang H<br />
Rong Ximin H<br />
Zhejiang<br />
Zhejiang Gongshang University Hangzhou Ding Zhengzhong M P<br />
Hua Jiukun H,P<br />
Zhejiang Sci-Tech Univ. (Academy of Science) Hangzhou Hu Jueliang H<br />
Luo Hua H<br />
Zhejiang University Hangzhou Yang Qifan H<br />
He Yong M,H<br />
Tan Zhiyi P<br />
(City College) Huang Waibin M<br />
Wang Gui P<br />
Kang Xusheng P<br />
Zhao Yanan P,P
Results of the 2005 MCM 215<br />
INSTITUTION CITY ADVISOR A B<br />
(Chu Kechen Honors College) Wu Jian H<br />
Chen Lingxi H,P<br />
Zhou Yongming H<br />
(Ningbo <strong>Institute</strong> of Technology) Ningbo Sun Haina P<br />
Tu Lihui P P<br />
Li Zhening P<br />
Zhejiang Univ. of Finance and Economics Hangzhou Wang Fulai P<br />
Luo Ji P<br />
Zhejiang University of Technology Hangzhou Zhou Minghua P<br />
Wu Xuejun P<br />
(Jianxing College) Wang Shiming P,P<br />
FINLAND<br />
Helsinki Mathematical High School Helsinki Terhi Olkkonen P P<br />
Päivölä College Tarttila Merikki Lappi P,P<br />
GERMANY<br />
International University Bremen Bremen Peter Oswald H<br />
Universität Karlsruhe Karlsruhe Lars Behnke P<br />
HONG KONG<br />
City University of Hong Kong Hong Kong Ho To Ming P<br />
Hong Kong Baptist University Kowloon C.S. Tong P<br />
Wai Chee Shiu P<br />
KOREA<br />
Korea Adv. Inst. of Sci. and Tech. (KAIST) Daejeon Chang-Ock Lee H,H<br />
INDONESIA<br />
<strong>Institute</strong> of Technology Bandung Bandung Kuntjoro Sidarto H<br />
Rieske Hadianti P<br />
IRELAND<br />
Trinity College Dublin Dublin Conor Houghton P<br />
University College Cork Cork Andrew Usher H<br />
Donal Hurley M<br />
James Grannell H<br />
SOUTH AFRICA<br />
University of Stellenbosch Stellenbosch Jan van Vuuren H,P
216 The UMAP Journal 26.3 (2005)<br />
Abbreviations for Organizational Unit Types (in parentheses in the listings)<br />
(none) Mathematics M; Pure M; Applied M; Computing M; M and Computer Science;<br />
M and Computational Science; M and Information Science;<br />
M and Statistics; M, Computer Science, and Statistics;<br />
M, Computer Science, and Physics; Mathematical Sciences;<br />
Applied Mathematical and Computational Sciences; Natural Science and M;<br />
M and Systems Science; Applied M and Physics<br />
Bio Biology B; B Science and Biotechnology; Biomathematics; Life Sciences<br />
Chm Chemistry C; Applied C; C and Physics; C, Chemical Engineering, and Applied C<br />
CS Computer C Science; C and Computing Science; C Science and Technology;<br />
C Science and (Software) Engineering; Software; Software Engineering;<br />
Artificial Intelligence; Automation; Computing Machinery;<br />
Science and Technology of Computers<br />
Econ Economics E; E Mathematics; Financial Mathematics;<br />
Financial Mathematics and Statistics; Management;<br />
Business Management; Management Science and Engineering<br />
Eng Engineering Civil E; Electrical Eng; Electronic E; Electrical and Computer E;<br />
Electrical E and Information Science; Electrical E and Systems E;<br />
Communications E; Civil, Environmental, and Chemical E;<br />
Propulsion E; Machinery and E; Control Science and E; Mechanisms;<br />
Operations Research and Industrial E; Automatic Control<br />
Info Information I Science; I and Computation(al) Science; I and Calculation Science;<br />
I Science and Computation; I and Computer Science;<br />
I and Computing Science; I Engineering; Computer and I Technology;<br />
Computer and I Engineering; I and Optoelectronic Science and Engineering<br />
Phys Physics P; Applied P; Mathematical P; Modern P; P and Engineering P;<br />
P and Geology; Mechanics; Electronics<br />
Sci Science S; Natural S; Applied S; Integrated S<br />
Stat Statistics S; S and Finance; Mathematical S; Probablity and S<br />
EDITOR’S NOTE: For team advisors from China, I have endeavored to list family<br />
name first. For their advice in that connection, I thank Wang Meng and Jiang<br />
Liming of Fudan University, exchange students at Beloit College.
From Lake Murray to a Dam Slurry 217<br />
From Lake Murray to a Dam Slurry<br />
Clay Hambrick<br />
Katie Lewis<br />
Lori Thomas<br />
Harvey Mudd College<br />
Claremont, CA<br />
Advisor: Jon Jacobsen<br />
<strong>Summary</strong><br />
We predict the extent of flooding in the Saluda river if a large earthquake<br />
causes the Lake Murray dam to break. In particular, we predict how high the<br />
water would be when it reached Columbia and how far the flooding would<br />
spread up tributaries of the Saluda like Rawls Creek. We base our model on<br />
the Saint-Venant equations for open-channel water flow. We use a discrete<br />
version of them to predict the water level along the length of the river. Our<br />
model takes into account the width of the floodplain, the slope of the river, the<br />
size of the break in the dam, and other factors. We estimate parameters for<br />
Lake Murray, its dam, and the Saluda River and calculate the flood results.<br />
The South Carolina State Capitol is safe under even the most extreme circumstances,<br />
since it sits on a hill well above the highest possible water level.<br />
However, flood waters could still reach 17 m at Columbia and even higher<br />
upstream. Buildings in Columbia close to the water would be inundated, but<br />
there should be enough warning time for residents to escape. Both our model<br />
and local evacuation plans suggest that low-lying areas for miles around would<br />
be covered with water.<br />
The text of this paper appears on pp. 229–244.<br />
The UMAP Journal 26 (3) (2005) 217. c○Copyright 2005 by COMAP, Inc. All rights reserved.<br />
Permission to make digital or hard copies of part or all of this work for personal or classroom use<br />
is granted without fee provided that copies are not made or distributed for profit or commercial<br />
advantage and that copies bear this notice. Abstracting with credit is permitted, but copyrights<br />
for components of this work owned by others than COMAP must be honored. To copy otherwise,<br />
to republish, to post on servers, or to redistribute to lists requires prior permission from COMAP.
218 The UMAP Journal 26.3 (2005)<br />
Through the Breach:<br />
Modeling Flooding from a<br />
Dam Failure in South Carolina<br />
Jennifer Kohlenberg<br />
Michael Barnett<br />
Scott Wood<br />
University of Saskatchewan<br />
Saskatoon, SK, Canada<br />
Advisor: James Brooke<br />
<strong>Summary</strong><br />
The Saluda Dam, separating Lake Murray from the Saluda River in South<br />
Carolina, could breach in the event of an earthquake.<br />
We develop a model to analyze the flow from four possible types of dam<br />
breaches and the propagation of the floodwaters:<br />
• instant total failure, where a large portion of the dam erodes instantly;<br />
• delayed total failure, where a large portion of the dam slowly erodes;<br />
• piping, where a small hole forms and eventually opens into a full breach;<br />
and<br />
• overtopping, where the dam erodes to form a trapezoidal breach.<br />
We develop two models for the spread of the downstream floodwaters.<br />
Both use a discrete-grid approach, modelling the region as a set of cells, each<br />
with an elevation and a volume of water. The Force Model uses cell velocities,<br />
gravity, and the pressure of neighbouring cells to model water flow. The Downhill<br />
Model assumes that flow rates are proportional to the height differences<br />
between the water in adjacent cells.<br />
The Downhill Model is efficient, intuitive, flexible, and could be applied to<br />
any region with known elevation data. Its two parameters smooth and regulate<br />
water flow, but the model’s predictions depend little on their values.<br />
For a Saluda Dam breach, the total extent of the flooding is 106.5 km 2 ;it<br />
does not reach the State Capitol. The flooding in Rawls Creek extends 4.4 km<br />
upstream and covers an area of 1.6–2.4 km 2 .<br />
The text of this paper appears on pp. 245–261.<br />
The UMAP Journal 26 (3) (2005) 218. c○Copyright 2005 by COMAP, Inc. All rights reserved.<br />
Permission to make digital or hard copies of part or all of this work for personal or classroom use<br />
is granted without fee provided that copies are not made or distributed for profit or commercial<br />
advantage and that copies bear this notice. Abstracting with credit is permitted, but copyrights<br />
for components of this work owned by others than COMAP must be honored. To copy otherwise,<br />
to republish, to post on servers, or to redistribute to lists requires prior permission from COMAP.
Analysis of Dam Failure 219<br />
Analysis of Dam Failure in the<br />
Saluda River Valley<br />
Ryan Bressler<br />
Christina Polwarth<br />
Braxton Osting<br />
University of Washington<br />
Seattle, WA<br />
Advisor: Rekha Thomas<br />
<strong>Summary</strong><br />
We identify and model two possible failure modes for the Saluda Dam:<br />
gradual failure due to an enlarging breach, and sudden catastrophic failure<br />
due to liquefaction of the dam.<br />
For the first case, we describe the breach using a linear sediment-transport<br />
model to determine the flow from the dam. We construct a high-resolution<br />
digital model of the downstream river valley and apply the continuity equations<br />
and a modified Manning equation to model the flow downstream.<br />
For the case of dam annihilation, we use a model based on the Saint-Venant<br />
equations for one-dimensional flood propagation in open-channel flow. Assuming<br />
shallow water conditions along the Saluda River, we approximate the<br />
depth and speed of a dam break wave, using a sinusoidal perturbation of the<br />
dynamic wave model.<br />
We calibrate the models with flow data from two river observation stations.<br />
We conclude that the flood levels would not reach the Capitol Building but<br />
would intrude deeply into Rawls Creek.<br />
The text of this paper appears on pp. 263–278.<br />
The UMAP Journal 26 (3) (2005) 219. c○Copyright 2005 by COMAP, Inc. All rights reserved.<br />
Permission to make digital or hard copies of part or all of this work for personal or classroom use<br />
is granted without fee provided that copies are not made or distributed for profit or commercial<br />
advantage and that copies bear this notice. Abstracting with credit is permitted, but copyrights<br />
for components of this work owned by others than COMAP must be honored. To copy otherwise,<br />
to republish, to post on servers, or to redistribute to lists requires prior permission from COMAP.
220 The UMAP Journal 26.3 (2005)<br />
Catastrophic Consequences of<br />
Earthquake Destruction of the<br />
Saluda Dam<br />
Miika Klemetti<br />
Colin McNally<br />
Chris Payette<br />
McGill University<br />
Montréal, Québec, Canada<br />
Advisor: Nilima Nigam<br />
<strong>Summary</strong><br />
We model the flow of water in the Saluda river valley to determine the extent<br />
of flooding resulting from a failure of the Saluda Dam due to an earthquake.<br />
The model is divided into two parts: the flow of water in the river, and the<br />
evolution of the dam breach. We consider two questions in detail: How far<br />
up Rawls Creek, 3.3 km from the dam, will the flooding extend? And will the<br />
State Capitol in Columbia, 14 km downriver from the dam, get wet?<br />
We assume that the dam fails as a result of overtopping after the dam slumps<br />
due to soil liquefaction. We model the shape of the breach as an enlarging trapezoid.<br />
This model provides the essential time-varying boundary conditions for<br />
the flow in the river and results in the dam collapsing in 3 to 4 min.<br />
The model for the water flow is based on dividing the river into sections of<br />
varying sizes. Tunable parameters for each section allow shaping of the valley<br />
along the river. The geometry of each cross section is modeled as a piecewiselinear<br />
function with three parameters (two for the slopes, one for the length).<br />
In addition, the length of each section of the river can be adjusted to obtain<br />
greater resolution for regions of interest. We model the flow of the water<br />
by the transfer of momentum and volume between the sections of the river.<br />
The equations governing these exchanges comprise a low-order finite-volume<br />
advection scheme. For our geometry, the flow is sub-critical and momentumdominated,<br />
allowing the above simplified physics model for the flow.<br />
The UMAP Journal 26 (3) (2005) 220–221. c○Copyright 2005 by COMAP, Inc. All rights reserved.<br />
Permission to make digital or hard copies of part or all of this work for personal or classroom use<br />
is granted without fee provided that copies are not made or distributed for profit or commercial<br />
advantage and that copies bear this notice. Abstracting with credit is permitted, but copyrights<br />
for components of this work owned by others than COMAP must be honored. To copy otherwise,<br />
to republish, to post on servers, or to redistribute to lists requires prior permission from COMAP.
Catastrophic Consequences 221<br />
We check convergence and stability of the results by varying the time resolution.<br />
The simulations of the model indicate major flooding in Rawls Creek up to<br />
2.4 km from the Saluda River, but flooding will not extend to the State Capitol.<br />
[EDITOR’S NOTE: This Meritorious paper won the Ben Fusaro Award for the<br />
Flood Planning Problem. Only this abstract of the paper appears in this issue<br />
of the Journal.]
222 The UMAP Journal 26.3 (2005)<br />
The Booth Tolls for Thee<br />
Adam Chandler<br />
Matthew Mian<br />
Pradeep Baliga<br />
Duke University<br />
Durham, NC<br />
Advisor: William G. Mitchener<br />
<strong>Summary</strong><br />
We determine the optimal number of tollbooths for a given number of incoming<br />
highway lanes. We interpret optimality as minimizing “total cost to<br />
the system,” the time that the public wastes while waiting to be processed plus<br />
the operating cost of the tollbooths.<br />
We develop a microscopic simulation of line-formation in front of the tollbooths.<br />
We fit a Fourier series to hourly demand data from a major New Jersey<br />
parkway. Using threshold analysis, we set upper bounds on the number of<br />
tollbooths. This simulation does not take bottlenecking into account, but it<br />
does inform a more general macroscopic framework for toll plaza design.<br />
Finally, we formulate a model for traffic flow through a plaza using cellular<br />
automata. Our results are summarized in the formula for the optimal number<br />
B of tollbooths for L lanes: B = ⌊1.65L +0.9⌋.<br />
The text of this paper appears on pp. 283–297.<br />
The UMAP Journal 26 (3) (2005) 222. c○Copyright 2005 by COMAP, Inc. All rights reserved.<br />
Permission to make digital or hard copies of part or all of this work for personal or classroom use<br />
is granted without fee provided that copies are not made or distributed for profit or commercial<br />
advantage and that copies bear this notice. Abstracting with credit is permitted, but copyrights<br />
for components of this work owned by others than COMAP must be honored. To copy otherwise,<br />
to republish, to post on servers, or to redistribute to lists requires prior permission from COMAP.
224 The UMAP Journal 26.3 (2005)<br />
Lane Changes and Close Following:<br />
Troublesome Tollbooth Traffic<br />
Andrew Spann<br />
Daniel Kane<br />
Dan Gulotta<br />
Massachusetts <strong>Institute</strong> of Technology<br />
Cambridge, MA<br />
Advisor: Martin Zdenek Bazant<br />
<strong>Summary</strong><br />
We develop a cellular-automaton model to address the slow speeds and<br />
emphasis on lane-changing in tollbooth plazas. We make assumptions about<br />
car-following, based on distance and relative speeds, and arrive at the criterion<br />
that cars maximize their speeds subject to<br />
<br />
Vcar<br />
gap ><br />
2<br />
+ 1<br />
2 (Vcar − Vfrontcar)(Vcar + Vfrontcar +1).<br />
We invent lane-change rules for cars to determine if they can turn safely and<br />
if changing lanes would allow higher speed. Cars modify these preferences<br />
based on whether changing lanes would bring them closer to a desired type<br />
of tollbooth. Overall, our assumptions encourage people to be a bit more<br />
aggressive than in traditional models when merging or driving at low speeds.<br />
We simulate a 70-min period at a tollbooth plaza, with intervals of light and<br />
heavy traffic. We look at statistics from this simulation and comment on the<br />
behavior of individual cars.<br />
In addition to determining the number of tollbooths needed, we discuss how<br />
tollbooth plazas can be improved with road barriers to direct lane expansion<br />
or by assigning the correct number of booths to electronic toll collection. We<br />
set up a generalized lane-expansion structure to test configurations.<br />
Booths should be ordered to encourage safe behavior, such as putting faster<br />
electronic booths together. Rigid barriers affect wait time adversely.<br />
Under typical traffic loads, there should be at least twice as many booths as<br />
highway lanes.<br />
The text of this paper appears on pp. 317–330.<br />
The UMAP Journal 26 (3) (2005) 224. c○Copyright 2005 by COMAP, Inc. All rights reserved.<br />
Permission to make digital or hard copies of part or all of this work for personal or classroom use<br />
is granted without fee provided that copies are not made or distributed for profit or commercial<br />
advantage and that copies bear this notice. Abstracting with credit is permitted, but copyrights<br />
for components of this work owned by others than COMAP must be honored. To copy otherwise,<br />
to republish, to post on servers, or to redistribute to lists requires prior permission from COMAP.
A Quasi-Sequential Cellular Automaton Approach 225<br />
A Quasi-Sequential<br />
Cellular-Automaton Approach<br />
to Traffic Modeling<br />
John Evans<br />
Meral Reyhan<br />
<strong>Rensselaer</strong> <strong>Polytechnic</strong> <strong>Institute</strong><br />
Troy,NY<br />
Advisor: Peter Kramer<br />
<strong>Summary</strong><br />
The most popular discrete models to simulate traffic flow are cellular automata,<br />
discrete dynamical systems whose behavior is completely specified in<br />
terms of its local region. Space is represented as a grid, with each cell containing<br />
some data, and these cells act in accordance to some set of rules at each<br />
temporal step. Of particular interest to this problem are sequential cellular<br />
automata (SCA), where the cells are updated in a sequential manner at each<br />
temporal step.<br />
We develop a discrete model with a grid to represent the area around a toll<br />
plaza and cells to hold cars. The cars are modeled as 5-dimensional vectors,<br />
with each dimension representing a different characteristic (e.g., speed). By<br />
discretizing the grid into different regimes (transition from highway, tollbooth,<br />
etc.), we develop rules for cars to follow in their movement. Finally, we model<br />
incoming traffic flow using a negative exponential distribution.<br />
We plot the average time for a car to move through the grid vs. incoming<br />
traffic flow rate for three different cases: 4 incoming lanes and tollbooths, 4<br />
incoming lanes and 4, 5, and 6 tollbooths. In each plots, we noted at certain<br />
values for the flow rate, there is a boundary layer in our solution. As we increase<br />
the ratio of tollbooths to incoming lanes, this boundary layer shifts to the right.<br />
Hence, the optimum solution is to pick the minimum number of tollbooths for<br />
which the maximum flow rate expected is located to the left of the boundary<br />
layer.<br />
The text of this paper appears on pp. 331–344.<br />
The UMAP Journal 26 (3) (2005) 225. c○Copyright 2005 by COMAP, Inc. All rights reserved.<br />
Permission to make digital or hard copies of part or all of this work for personal or classroom use<br />
is granted without fee provided that copies are not made or distributed for profit or commercial<br />
advantage and that copies bear this notice. Abstracting with credit is permitted, but copyrights<br />
for components of this work owned by others than COMAP must be honored. To copy otherwise,<br />
to republish, to post on servers, or to redistribute to lists requires prior permission from COMAP.
226 The UMAP Journal 26.3 (2005)<br />
The Multiple Single Server<br />
Queueing System<br />
Azra Panjwani<br />
Yang Liu<br />
HuanHuan Qi<br />
University of California, Berkeley<br />
Berkeley, CA<br />
Advisor: Jim Pitman<br />
<strong>Summary</strong><br />
Our model determines the optimal number of tollbooths at a toll plaza in<br />
terms of that minimizing the time that a car spends in the plaza.<br />
We treat the toll collection process as a network of two exponential queueing<br />
systems, the Toll Collection system and the Lane Merge System. The random,<br />
memoryless nature of successive car interarrival and service times allows us to<br />
conclude that the two are exponentially distributed.<br />
We use properties of single server and multiple server queuing systems to<br />
develop our Multiple Single Server Queuing System. We simulate our network<br />
in Matlab, analyzing the model’s performance in light, medium, and heavy<br />
traffic for tollways with 3 to 6 lanes. The optimal number of tollbooths is<br />
roughly double the number of lanes.<br />
We also evaluate a single tollbooth vs. multiple tollbooths per lane. The<br />
optimal number of booths improves the processing time by 22% in light traffic<br />
and 61% in medium traffic. In heavy traffic, one tollbooth per lane results in<br />
infinite queues.<br />
Our model produces consistent results for all traffic situations, and its flexibility<br />
allows us to apply it to a wide range of toll-plaza systems. However,<br />
the minimum time predicted is an average value, hence it does not reflect the<br />
maximum time that an individual may spend in the network.<br />
The text of this paper appears on pp. 345–354.<br />
The UMAP Journal 26 (3) (2005) 226. c○Copyright 2005 by COMAP, Inc. All rights reserved.<br />
Permission to make digital or hard copies of part or all of this work for personal or classroom use<br />
is granted without fee provided that copies are not made or distributed for profit or commercial<br />
advantage and that copies bear this notice. Abstracting with credit is permitted, but copyrights<br />
for components of this work owned by others than COMAP must be honored. To copy otherwise,<br />
to republish, to post on servers, or to redistribute to lists requires prior permission from COMAP.
TwoTools for Tollbooth<br />
Optimization<br />
Ephrat Bitton<br />
Anand Kulkarni<br />
Mark Shlimovich<br />
University of California, Berkeley<br />
Berkeley, CA<br />
Advisor: L. Craig Evans<br />
<strong>Summary</strong><br />
TwoTools for Tollbooth Optimization 227<br />
We determine the optimal number of lanes in a toll plaza to maximize the<br />
transit rate of vehicles through the system. We use two different approaches,<br />
one macroscopic and one discrete, to model traffic through the toll plaza.<br />
In our first approach, we derive results about flows through a sequence of<br />
bottlenecks and demonstrate that maximum flow occurs when the flow rate<br />
through all bottlenecks is equal. We apply these results to the toll-plaza system<br />
to determine the optimal number of toll lanes. At high densities, the optimal<br />
number of tollbooths exhibits a linear relationship with the number of toll lanes.<br />
We then construct a discrete traffic simulation based on stochastic cellular<br />
automata, a microscopic approach to traffic modeling, which we use to validate<br />
the optimality of our model. Furthermore, we demonstrate that the simulation<br />
generates flow rates very close to those of toll plazas on the Garden State Parkway<br />
in New Jersey, which further confirms the accuracy of our predictions.<br />
Having the number of toll lanes equal the number of highway lanes is<br />
optimal only when a highway has consistently low density and is suboptimal<br />
otherwise. For medium- to high-density traffic, the optimal number of toll lanes<br />
is three to four times the number of highway lanes. Both models demonstrate<br />
that if a tollway has lanes in excess of the optimal, flow will not increase or<br />
abate.<br />
Finally, we examine how well our models can be generalized and comment<br />
on their applicability to the real world.<br />
[EDITOR’S NOTE: This Outstanding paper won the Ben Fusaro Award for the<br />
Tollbooths Problem. The text of the paper appears on pp. 355–371.]<br />
The UMAP Journal 26 (3) (2005) 227. c○Copyright 2005 by COMAP, Inc. All rights reserved.<br />
Permission to make digital or hard copies of part or all of this work for personal or classroom use<br />
is granted without fee provided that copies are not made or distributed for profit or commercial<br />
advantage and that copies bear this notice. Abstracting with credit is permitted, but copyrights<br />
for components of this work owned by others than COMAP must be honored. To copy otherwise,<br />
to republish, to post on servers, or to redistribute to lists requires prior permission from COMAP.
228 The UMAP Journal 26.3 (2005)<br />
For Whom the Booth Tolls<br />
Brian Camley<br />
Bradley Klingenberg<br />
Pascal Getreuer<br />
University of Colorado<br />
Boulder, CO<br />
Advisor: Anne Dougherty<br />
<strong>Summary</strong><br />
We model traffic near a toll plaza with a combination of queueing theory<br />
and cellular automata in order to determine the optimum number of tollbooths.<br />
We assume that cars arrive at the toll plaza in a Poisson process, and that the<br />
probability of leaving the tollbooth is memoryless. This allows us to completely<br />
and analytically describe the accumulation of cars waiting for open tollbooths<br />
as an M|M|n queue. We then use a modified Nagel-Schreckenberg (NS) cellular<br />
automata scheme to model both the cars waiting for tollbooths and the cars<br />
merging onto the highway. The models offer results that are strikingly consistent,<br />
which serves to validate the conclusions drawn from the simulation.<br />
We use our NS model to measure the average wait time at the toll plaza.<br />
From this we demonstrate a general method for choosing the number of tollbooths<br />
to minimize the wait time. For a 2-lane highway, the optimal number of<br />
booths is 4; for a 3-lane highway, it is 6. For larger numbers of lanes, the result<br />
depends on the arrival rate of the traffic.<br />
The consistency of our model with a variety of theory and experiment suggests<br />
that it is accurate and robust. There is a high degree of agreement between<br />
the queueing theory results and the corresponding NS results. Special cases of<br />
our NS results are confirmed by empirical data from the literature. In addition,<br />
changing the distribution of the tollbooth wait time and changing the probability<br />
of random braking does not significantly alter the recommendations. This<br />
presents a compelling validation of our models and general approach.<br />
The text of this paper appears on pp. 373–390.<br />
The UMAP Journal 26 (3) (2005) 228. c○Copyright 2005 by COMAP, Inc. All rights reserved.<br />
Permission to make digital or hard copies of part or all of this work for personal or classroom use<br />
is granted without fee provided that copies are not made or distributed for profit or commercial<br />
advantage and that copies bear this notice. Abstracting with credit is permitted, but copyrights<br />
for components of this work owned by others than COMAP must be honored. To copy otherwise,<br />
to republish, to post on servers, or to redistribute to lists requires prior permission from COMAP.
From Lake Murray to a Dam Slurry 229<br />
From Lake Murray to a Dam Slurry<br />
Clay Hambrick<br />
Katie Lewis<br />
Lori Thomas<br />
Harvey Mudd College<br />
Claremont, CA<br />
Advisor: Jon Jacobsen<br />
<strong>Summary</strong><br />
We predict the extent of flooding in the Saluda river if a large earthquake<br />
causes the Lake Murray dam to break. In particular, we predict how high the<br />
water would be when it reached Columbia and how far the flooding would<br />
spread up tributaries of the Saluda like Rawls Creek. We base our model on<br />
the Saint-Venant equations for open-channel water flow. We use a discrete<br />
version of them to predict the water level along the length of the river. Our<br />
model takes into account the width of the floodplain, the slope of the river, the<br />
size of the break in the dam, and other factors. We estimate parameters for<br />
Lake Murray, its dam, and the Saluda River and calculate the flood results.<br />
The South Carolina State Capitol is safe under even the most extreme circumstances,<br />
since it sits on a hill well above the highest possible water level.<br />
However, flood waters could still reach 17 m at Columbia and even higher<br />
upstream. Buildings in Columbia close to the water would be inundated, but<br />
there should be enough warning time for residents to escape. Both our model<br />
and local evacuation plans suggest that low-lying areas for miles around would<br />
be covered with water.<br />
Introduction<br />
In central South Carolina, a lake is held back by a 75-year-old earthen dam.<br />
What would happen if an earthquake breached the dam? The concern is based<br />
on an earthquake in 1886 at Charleston that scientists believe measured 7.3 on<br />
the Richter Scale [Federal Energy Regulatory Commission 2002]. The location<br />
of fault lines almost directly under Lake Murray [SCIway 2000; South Carolina<br />
The UMAP Journal 26 (3) (2005) 229–244. c○Copyright 2005 by COMAP, Inc. All rights reserved.<br />
Permission to make digital or hard copies of part or all of this work for personal or classroom use<br />
is granted without fee provided that copies are not made or distributed for profit or commercial<br />
advantage and that copies bear this notice. Abstracting with credit is permitted, but copyrights<br />
for components of this work owned by others than COMAP must be honored. To copy otherwise,<br />
to republish, to post on servers, or to redistribute to lists requires prior permission from COMAP.
230 The UMAP Journal 26.3 (2005)<br />
Geological Survey 1997; 1998] and the frequency of small earthquakes in the<br />
area led authorities to consider the consequences of such a disaster.<br />
Our task is to predict how water levels would change along the Saluda<br />
River, from Lake Murray Dam to Columbia, if an earthquake on the same scale<br />
as the 1886 breaches the dam. In particular, how far would the tributary Rawls<br />
Creek flow back and how high would the water rise near the State Capitol in<br />
Columbia, South Carolina.<br />
Figure 1. Topographical map of the Saluda River from the base of Lake Murray to the Congaree<br />
River [Topozone 2004].<br />
We lay out our assumptions and set up a submodel of Lake Murray and the<br />
Lake Murray dam to simulate the overflow when the dam breaks.<br />
We then build a model based on the Saint-Venant equations [Moussa and<br />
Bocquillon 2000], using conservation of water and momentum to capture the<br />
nature of a flood where the main water channel overflows into the surrounding<br />
area. We convert the model to a system of difference equations and feed the<br />
dam outflow into the beginning of the river.<br />
To increase accuracy, we measure along the river the ratio of the floodplain<br />
to the river width and use these values to modify the equations. We then use<br />
data from Lake Murray and the Saluda river to model several scenarios.<br />
Finally, we discuss the implications of our model, analyze its strengths and<br />
weaknesses, and discuss how the model could be extended.<br />
Background of Earthquake Effects<br />
• Effect on the dam<br />
– How the dam is compromised (size and shape of the initial breach)<br />
– Interaction between the lake water and the initial breach<br />
– Breach size and shape over time
From Lake Murray to a Dam Slurry 231<br />
Figure 2. Schematic of the earth dam and the new planned dam at Lake Murray [Lake Murray<br />
2005].<br />
• Effect on the water<br />
– Earthquake’s effect on the lake in so far as it affects the dam<br />
• Effect on the surrounding countryside<br />
– Whether earthquake alteration of the landscape opens or closes available<br />
floodplains<br />
– Whether earthquake damage could divert the Saluda river<br />
– Whether earthquake damage would make the Saluda’s path choppier<br />
and slow down the water<br />
The situation looks something like this: A large earthquake compromises<br />
the Lake Murray dam. Earthen dams do not usually fail completely or instantaneously<br />
[U.S. Army Corps of Engineers 1997]. Instead, the dam begins to leak.<br />
Over time, the water causes further erosion, allowing more and more water to<br />
flow out of the lake, until the lake and dam reach a new equilibrium. Depending<br />
on the initial breach and the dam construction, the final equilibrium may<br />
take anywhere from a few minutes to a few hours [U.S. Army Corps of Engineers<br />
1997] to reach. The fully formed breach usually has a width somewhere<br />
between half the height of the dam and three times the height of the dam [U.S.<br />
Army Corps of Engineers 1997; 1980]. At half a mile wide (1,609 m) and 208 ft<br />
(63 m) tall [SouthCarolinaLakes.net], the Lake Murray Dam is about 25 times
232 The UMAP Journal 26.3 (2005)<br />
as wide as it is tall, which suggests a breach width much smaller than the dam<br />
width.<br />
Below the dam, the increasing flow of water puts stress on the countryside,<br />
with flooding and hillside carving. Water back-flows up smaller creeks such<br />
as Rawls Creek and pools in the flatter sections. Far downstream, either the<br />
water pools enough to stay within normal channels, or excess water creates its<br />
own channel, or excess water continues flowing from river to river to the sea.<br />
Assumptions<br />
Earthquake<br />
• Aftershocks disregarded: Earthquakes generally consist of a main shock and<br />
smaller aftershocks. Although an aftershock is itself a significant event and<br />
might cause a spike in dam destruction, for simplicity we neglect aftershocks.<br />
• Dam breach only: The earthquake could affect the dam, the water involved,<br />
and the landscape. The earthquake’s effect on the water matters only if<br />
the water damages the terrain or escapes from the lake or riverbed. Thus,<br />
by assuming that the earthquake affects only the dam, we bundle any effect<br />
of the earthquake on the water into the water’s effect on other things.<br />
The earthquake could significantly affect the terrain, but such changes are<br />
unpredictable and we assume no significant terrain changes take place.<br />
Weather and Terrain<br />
• No effect from wind: The effects of wind here are minuscule in comparison<br />
with other forces.<br />
• Low land near river would flood: We assume that the river would overflow its<br />
banks and fill the surrounding floodplain.<br />
Lake Murray and Dam<br />
• Lake has a simple shape: We assume that the lake has perfectly vertical sides<br />
and a flat bottom.<br />
• Dam breach is rectangular: We can thus model a variety of dam breaches, since<br />
we can vary the height and width independently.<br />
• Washed-out dam materials are negligible compared to water flooding: Since we<br />
already assume that the breach does not erode, there is no new source of<br />
earth after that initial point. This assumption should work well when the<br />
breach is small but less so when the breach is large.
Saluda River<br />
From Lake Murray to a Dam Slurry 233<br />
• River channel has constant width: The Saluda river widens slightly after 11.4 km<br />
[Topozone 2004]; but to model it simply, we assume that it has a constant<br />
width.<br />
• River has steady elevation loss: Due to limits of our topographical data, we<br />
assume that the height of the river drops off steadily.<br />
• River has constant initial depth: Because we assume that the river drops off<br />
steadily, there are no pockets where water could pool. Since the river starts<br />
in equilibrium, we assume that the depth is uniform from start to finish.<br />
• River is straight: The curvature of a river contributes somewhat to slow the<br />
flow of water, and some models include a curvature parameter; but given<br />
how straight the Saluda is [Topozone 2004], it is reasonable to approximate<br />
it as a linear river.<br />
Dam Model<br />
We use a submodel to simulate what happens on the lake and at the dam after<br />
an earthquake causes a breach. The submodel provides information about the<br />
volume and speed of water leaving the dam at any given time. This information<br />
depends on the volume of water in the lake, the surface area of the lake, and<br />
the size of the breach in the dam.<br />
We model the breach as a rectangular opening in the dam. We assume that<br />
water would flow out of the bottom of this breach and that its energy would be<br />
conserved. The potential energy is converted into kinetic energy, and so from<br />
the equation<br />
we get<br />
where<br />
s is the speed of the water,<br />
m is the mass of the water,<br />
g is acceleration due to gravity, and<br />
1<br />
2 ms2 = mgh<br />
s = 2gh,<br />
h is the height of the water—the difference in height between the lake and the<br />
bottom of the breach.
234 The UMAP Journal 26.3 (2005)<br />
We assume that all water leaves at the maximum speed, a slight overestimate.<br />
We can write this equation in terms of our model as<br />
swater leaving = 2g(hlake − hdam).<br />
The volume of water leaving in each time step is the area of the breach times<br />
the velocity of the water times the size of the time step:<br />
vwater leaving = wbreach(hlake − hdam)swater leavingttime step,<br />
where v is volume, w is width, h is height, s is speed, and t is time.<br />
We assume in effect that the lake is a large straight-sided holding tank, so<br />
its area doesn’t change when the water height does. This means that the height<br />
of the lake is simply the volume divided by area, or<br />
hlake = vlake<br />
alake<br />
where h is the height, v the volume, and a is the area. This assumption can be<br />
changed to make the area of the lake a function of the amount of water in it; for<br />
example, we could model the lake as a shallow cone.<br />
We also assume that the breach in the dam stays the same size throughout<br />
the simulation, though it would be simple to make the width and depth of the<br />
breach increase as a function of the amount and speed of the water flowing<br />
through. Doing so would mimic erosion caused by the force of the water<br />
traveling through the gap.<br />
Saint-Venant Model<br />
Our primary model is based on the Saint-Venant system of (partial differential)<br />
equations. This choice was inspired by Moussa and Bocquillon [2000],<br />
who describes how to use them (slightly modified) to model floods. These<br />
equations govern open-channel fluid flow that is nonuniform and nonconstant,<br />
and they take into account variations in velocity, the topography of the river<br />
and surroundings, and friction with the ground. This makes the Saint-Venant<br />
system much preferable to simpler models, especially since friction is a dominant<br />
force in flood behavior (the floodwaters cover uneven ground with many<br />
obstacles—trees, houses, etc.).<br />
The (modified) Saint-Venant system consists of a water conservation equation,<br />
η ∂y<br />
∂t<br />
and a linear momentum equation,<br />
where<br />
∂V<br />
∂t<br />
+ V ∂V<br />
∂x<br />
+ y ∂V<br />
∂x<br />
+ g<br />
+ V ∂y<br />
∂x =0,<br />
<br />
∂y<br />
∂x + Sf<br />
<br />
− S =0,
y is the height of the water;<br />
x is the distance along the river;<br />
t is time;<br />
V is the speed of the water,<br />
S is the river slope;<br />
From Lake Murray to a Dam Slurry 235<br />
η , the new parameter introduced by Moussa and Bocquillon [2000], is the<br />
relative floodplain width (see below); and<br />
Sf is the so-called energy-line slope.<br />
The energy-line slope represents how much friction the flowing water must<br />
overcome; it is calculated from the velocity and flow radius of the water via the<br />
Manning formula [Moussa and Bocquillon 2000],<br />
Sf = n 2 kV 2 R −4/3 ,<br />
where R, the hydraulic or flow radius, is given by R = W1y/(W1 +2y), where<br />
W1 is the width of the channel. There are two constants: n is the dimensionless<br />
“roughness parameter” characterizing the land that the water flows over, while<br />
k is a constant equal to 1 s 2 /m 2/3 .<br />
But what does the introduction of the parameter η do? The model assumes<br />
that outside the river channel there is a floodplain that has a very high fluid<br />
resistance (e.g., trees, houses). This means that the downstream flow of water<br />
in this area is negligible. However, the floodplain serves as a sink for water,<br />
so ∂y/∂t is modified by the factor η, the ratio of of the floodplain width to the<br />
channel width. This way, when the water rises, the actual height change in the<br />
channel is attenuated by η, since some water is absorbed by the floodplain. We<br />
make η a function of the distance along the river by measuring the width of the<br />
floodplain at various points.<br />
To model numerically, we turn this PDE system into a difference-equation<br />
system. As is common with numerical PDEs, and in particular fluid dynamics<br />
problems, special care must be taken to ensure the stability of the algorithm [Trefethen<br />
1996]. We use the Lax-Wendroff difference formula,<br />
u n+1<br />
j<br />
= un j + 1<br />
2 λ(un j+1 − u n j−1) − 1<br />
2 λ2 (u n j+1 − 2uj + n + u n j−1).<br />
Here the upper indices represent time and the lower, space; λ is the ratio of the<br />
time to the space step size. (Our model converts distance and time to model<br />
units, so the step size in each is 1.) The second term acts to damp out spikes,<br />
since it looks at how much each point differs from the points on either side of<br />
it, and compensates.<br />
We find that the model is highly sensitive to the roughness parameter n<br />
(note that this is the effective roughness in the channel only). When n is large<br />
(even at 0.03, the standard value for large rivers), there is high resistance to
236 The UMAP Journal 26.3 (2005)<br />
the water flow, and the floodwater tends to pile up. This leads to excessive<br />
steepness in the water-depth profile and tends to make the model break down.<br />
Fortunately, we can assume a smaller value for n, since we are considering only<br />
the water in the channel area, which is bounded on the sides not by rocks and<br />
grass (as a river is normally), but by other floodwater (covering the floodplain),<br />
which is moving a bit slower (in fact, we assume that it is stationary) but should<br />
be smoother than stationary rocks. Therefore, we take n =0.01.<br />
Further, the model is increasingly unstable at higher rates of lake outflow.<br />
This is presumably because the Saint-Venant equations are essentially perturbations<br />
about steady flow, so they tend to break down in massive flooding. We<br />
resort to periodic averaging of neighboring water depths (every 20 time steps,<br />
for the most part). This does not seem to affect the results much.<br />
Rawls Creek Back-Flooding<br />
Our initial idea for computing the back-flooding at Rawls Creek was to<br />
use the same Saint-Venant modeling technique as for Saluda, adjusted for the<br />
different parameters of Rawls, and using the water depths calculated at the<br />
creek’s mouth for the “dam”. However, it is unclear what the initial speeds<br />
should be, since the back-flow water moves more or less perpendicularly to the<br />
main flood. Moreover, the model displays severe instability with the relevant<br />
data. Hence, we take the water height at the mouth and use the topographical<br />
map Topozone [2004] to find the matching place upstream. Though highly<br />
simplistic, this method is consistent with a modified Saint-Venant system, since<br />
it assumes that there is no flow outside the main channel and that the floodplain<br />
area is filled instantaneously along with the channel. The Rawls Creek valley<br />
is simply a wider section of floodplain (and we include it in calculating the<br />
floodplain widths).<br />
Parameters<br />
Lake Murray Dam<br />
We use the following parameter values:<br />
• g =9.8 m/s 2 , the gravitational constant<br />
• h0lake =60m [SouthCarolinaLakes.net]. This is the initial height of water in<br />
the lake.<br />
• v0lake =3× 10⁹ m 3 [Publications 2004]. This is the initial volume of water in<br />
the lake.<br />
• a0lake , the area of the lake assuming that the sides are exactly vertical.
Saluda River<br />
From Lake Murray to a Dam Slurry 237<br />
• lengthriver = 16200 m, the length of the Saluda River as measured on the<br />
topographic map in Figure 1.<br />
• hBedUpstream =0m, the height of the stream bed just after the dam, compared<br />
to the base of the dam.<br />
• hBedDownstream = −10 m, the height of the stream bed as it joins the Congaree<br />
River outside Columbia. We obtain this value by comparing the height<br />
above sea level of the beginning and at the end of the Saluda river on the<br />
topographic map in Figure 1.<br />
• h0water =1.2m [South Carolina Department of Natural Resources], the initial<br />
water depth along the river, assumed uniform.<br />
Floodplain<br />
Water flowing out from the dam would not stay entirely within the Saluda<br />
River bed. To model accurately the ratio of the river channel to the floodplain<br />
surrounding it, we examine topographical maps. The river has an elevation of<br />
approximately 170 ft (52 m). The area near the river rises gradually to approximately<br />
200 ft (61 m), before nearby hills start. We assume that this area between<br />
the river and the hills is the approximate floodplain. We measure the width of<br />
this plain every 600 m. We assume that the width varies linearly between these<br />
measurements and interpolate plain widths for distances downstream that we<br />
didn’t measure directly. This assumption allows us a much more accurate<br />
model than if we simply assume that the floodplain has constant width.<br />
Results<br />
The Lake Murray Dam is roughly 800 m long (in the highest region) by<br />
60 m high [Topozone 2004], so any breach up to this size is at least theoretically<br />
possible.<br />
No Breach<br />
Breach width: 0 m, breach height: 0 m<br />
Tested with no breach, the model performs as expected, with the water<br />
level staying very nearly constant, since replacement water from the ordinary<br />
hydroelectric pipes is included in the model.
238 The UMAP Journal 26.3 (2005)<br />
Figure 4. Ratio of the width of the river channel and the flood plain as a function of distance along<br />
the river. The two spikes are tributaries; the left one is Rawls Creek. The widening at the end is<br />
the mouth of the Saluda where it enters the Congaree.<br />
Realistic Breach<br />
Breach width 800 m, breach height 10 m<br />
The most common earthquake failure mode for an earthen dam is for the underwater<br />
side to simply landslide down, producing a wide but shallow breach.<br />
In this scenario, flooding crests in the Rawls after 1.1 h at a height of 7.1 m.<br />
This means that the creek backfloods for some 2.4 km along its course, as measured<br />
on the topographical map Topozone [2004]. Crest at Columbia (where<br />
the Saluda flows into the Congaree) is reached after 7.5 h at a height of 4.15 m.<br />
Since the Capitol sits some 50 m above the river, it is in no danger.<br />
Alternative Breach<br />
Breach width 133 m, breach height 60 m<br />
To explore the effect of breach shape as well as size, we run a scenario with<br />
abreach of the same cross-section as the previous case but with the opposite<br />
rectangular shape. Since the breach is deeper, the speed of the escaping water<br />
is higher than before and more water escapes also, since the lake can drain to<br />
a lower level.<br />
The water crests at the Rawls after 1.4 h at 9.11 m. The backflooding extends<br />
for 3.0 km. Crest at Columbia occurs after 7.0 h at 6.23 m.
From Lake Murray to a Dam Slurry 239<br />
Figure 5. Contour map of the water level along the river from the start of the simulation to the<br />
end. The x-axis is distance (m) along the river and the y-axis is time (s) into the simulation. The<br />
color bar gives the scale for the height (100s of m) of the water.<br />
Figure 6. Water level where Rawls Creek joins the Saluda River, from the start of the simulation to<br />
the end. The x-axis is time (s) into the simulation and the y-axis is the height (m) of the water.
240 The UMAP Journal 26.3 (2005)<br />
Figure 7. Water level where the Saluda River meets the Congaree River in Columbia, from the start<br />
of the simulation to the end. The x-axis is time (s) into the simulation (in seconds) and the y-axis<br />
is the height (m) of the water.<br />
Maximum Breach<br />
Breach width: 800 m, breach height: 60 m<br />
What if the entire dam simply vanishes? Both the model and our assumptions<br />
are overextended by this scenario. Despite more frequent smoothing<br />
(every 5 time steps), the numbers consistently exploded after 3 h of simulated<br />
time. Fortunately, this was long enough for cresting at the Rawls and for a<br />
pretty good guess at the Columbia crest. Unfortunately, the water rises so high<br />
in the early sections of the river that our values for η are no longer valid—the<br />
flood simply expands outside the normal floodplain. This means that the water<br />
would not actually be as high as the model indicates.<br />
The Rawls crest occurs after 0.4 h 34.35 m. This height of water causes<br />
backflooding as much as 5 km upstream (a strong indication that our η values<br />
are indeed too low for this level of flooding). The Columbia crest appears after<br />
4to5hand is no more than 17 m. The Capitol is still safe, by a large margin.<br />
Interpretation<br />
While the Capitol is safe in all scenarios, massive flooding nonetheless occurs<br />
in low-lying areas and in the homes and businesses along the Columbia.<br />
Happily, based on the flood scenarios above, if a warning system is in place,<br />
there should be enough time to escape before the flood water arrives.
Analysis of Model<br />
Strengths and Weaknesses<br />
From Lake Murray to a Dam Slurry 241<br />
Our model is built on trade-offs. One weakness is the transformation of<br />
PDEs into difference equations; the latter are prone to instability in extreme<br />
scenarios.<br />
Our assumptions represent other trade-offs. The floodplain, though a vast<br />
improvement over an extremely simple model where all water stays in the<br />
channel, requires us to assume that the water instantaneously drains from the<br />
river and immediately stops moving. Extending the system to be be fully<br />
three-dimensional, with water flowing both downstream and outward from<br />
the riverbed, would represent a great improvement (and indeed, is performed<br />
admirably by various commercial software packages).<br />
On the other hand, we implement equations designed specifically to model<br />
situations like the one on the Saluda River and use data specific to Lake Murray<br />
and the Saluda River.<br />
Comparison to Other Predictions<br />
The company that owns the dam provides an evacuation map that shows<br />
where the water is expected to go during a flood. This map seems to agree<br />
roughly with our worst-case model predictions.<br />
Future Work<br />
• We could model an expanding trapezoidal breach, representing erosion of<br />
the original breach, using values from the literature [U.S. Army Corps of<br />
Engineers 1980] to select appropriate slope and time intervals.<br />
• We could acquire data on the normal width of the Saluda River at intervals<br />
along its course between Lake Murray and the Congaree, rather than<br />
assuming a constant stream width.<br />
• We could collect data on the elevation of the stream at regular intervals.<br />
For instance, the river might have a waterfall, which could affect the flood<br />
pattern.<br />
• We could consider information on the distribution of the lake’s water. In<br />
real life, the lake has large areas that are shallow, with a smaller deep region.<br />
• We could move from the straight-stream assumption to a two-dimensional<br />
analysis; some momentum is lost in bends in the river.
242 The UMAP Journal 26.3 (2005)<br />
• Our assumptions (the earthquake affects just the dam, aftershocks can be<br />
disregarded, wind has no effect, and washed-out dam materials can be disregarded)<br />
are sturdy enough that an upgrade of the water-flow modeling<br />
technique used (Saint-Venant) should be attempted before correcting these<br />
assumptions.<br />
Conclusion<br />
Dam-breach flooding is a rare but very serious problem, especially when<br />
the dam sits less than 20 km above a major city. We create a hydrodynamical<br />
model that gives the downstream results of both likely and possible earthquakedriven<br />
dam breach scenarios. Since the city of Columbia sits mainly on a hill,<br />
the predicted flood levels of 4 m to 17 m would flood only the few blocks closest<br />
to the river. However, upstream areas such as Rawls Creek would experience<br />
levels 7 m to 34 m higher. The water could arrive at Rawls in as little as half<br />
an hour, and flood 2.5–5 km upstream; so an early-warning system for dam<br />
breaches along the Saluda is a vital protective measure.<br />
Our model produces results that make intuitive sense when we vary the<br />
parameters: The flooding increases with a larger breach, and a deeper breach<br />
floods more than a shallower one of the same area. The water height falls off<br />
downstream, as some of the water is held in the floodplain, and this attenuation<br />
varies with the width of the floodplain.<br />
References<br />
Castro, Gonzalo. 1999. Seismic stability and deformations of embankment<br />
dams. 2nd US-Japan Workshop on Dam Earthquake Engineering http://www.<br />
geiconsultants.com/images/library/sub31.pdf .<br />
Dutch, Steven. 2003. Faults and earthquakes. ttp://www.uwgb.edu/dutchs/<br />
EarthSC202Notes/quakes.htm .<br />
Federal Energy Regulatory Commission. 2002. News release: Commission<br />
moves to protect public near south carolina dam. http://www.ferc.gov/<br />
press-room/pr-archives/2002/2002-2/4-9-saludazz.pdf .<br />
Jones, Lucile M. 1995. Foreshocks, mainshocks, and aftershocks. Southern<br />
California Earthquake Center. http://www.data.scec.org/eqcountry/<br />
aftershock.html .<br />
Lake Murray. 2005. The lake murray home page. http://www.lakemurray.<br />
com/ . Accessed 12 Feb 2005.<br />
Moussa, Roger, and Claude Bocquillon. 2000. Approximation zones of the<br />
saint-venant equations for flood routing with overbank flow. Hydrology and<br />
Earth System Sciences 4 (2): 251–261.
From Lake Murray to a Dam Slurry 243<br />
Publications, Gardener. 2004. Lakeside living. http://www.gardenerguides.<br />
com/ColumbiaPage-Neighborhoods-LakeM.htm .<br />
Scana. 2005. Emergency information: Lake murray evacuation map.<br />
http://www.scana.com/SCEG/For+Living/Lake+Murray/emergency_<br />
information.htm .<br />
SCIway. 2000. South carolina county maps. http://www.sciway.net/maps/<br />
cnty/ .<br />
of Natural Resources, South Carolina Department. Lake and stream data. http:<br />
//www.dnr.state.sc.us/pls/hydro/river.home .<br />
South Carolina Geological Survey. 1997. Simplified map showing faults<br />
and related geologic structures. http://www.dnr.state.sc.us/geology/<br />
earthqua2.htm .<br />
. 1998. Structural features of South Carolina. http://water.dnr.<br />
state.sc.us/geology/structur.htm .<br />
SouthCarolinaLakes.net. Lake murray. http://www.southcarolinalakes.<br />
net/murray.htm .<br />
Topozone. 2004. http://www.topozone.com/map.asp?lat=34.042\&lon=<br />
-81.2\&s=50\&size=l\&symshow%=n\&datum=nad83\&layer=DRG25 .<br />
Trefethen, Lloyd N. 1996. Finite Difference and Spectral Methods for Ordinary<br />
and Partial Differential Equations. Unpublished textbook available at http:<br />
//web.comlab.ox.ac.uk/oucl/work/nick.trefethen/pdetext.html .<br />
U.S. Army Corps of Engineers. 1997. Engineer Manual 1110-2-1420. Emgineering<br />
and Design—Hydrologic Engineering Requirements for Reservoirs. http://www.<br />
usace.army.mil/inet/usace-docs/eng-manuals/em1110-2-1420/ .<br />
, Hydrologic Engineering Center. 1980. Flood Emergency Plans: Guidelines<br />
for Corps Dams. RD-13, HEC. http://www.hec.usace.army.mil/<br />
publications/pub_download.html .
244 The UMAP Journal 26.3 (2005)<br />
Lori Thomas, Clay Hambrick, Katie Lewis, and Jon Jacobsen (advisor).
Through the Breach:<br />
Modeling Flooding from a<br />
Dam Failure in South Carolina<br />
Jennifer Kohlenberg<br />
Michael Barnett<br />
Scott Wood<br />
University of Saskatchewan<br />
Saskatoon, SK, Canada<br />
Advisor: James Brooke<br />
<strong>Summary</strong><br />
Through the Breach 245<br />
The Saluda Dam, separating Lake Murray from the Saluda River in South<br />
Carolina, could breach in the event of an earthquake.<br />
We develop a model to analyze the flow from four possible types of dam<br />
breaches and the propagation of the floodwaters:<br />
• instant total failure, where a large portion of the dam erodes instantly;<br />
• delayed total failure, where a large portion of the dam slowly erodes;<br />
• piping, where a small hole forms and eventually opens into a full breach;<br />
and<br />
• overtopping, where the dam erodes to form a trapezoidal breach.<br />
We develop two models for the spread of the downstream floodwaters.<br />
Both use a discrete-grid approach, modelling the region as a set of cells, each<br />
with an elevation and a volume of water. The Force Model uses cell velocities,<br />
gravity, and the pressure of neighbouring cells to model water flow. The Downhill<br />
Model assumes that flow rates are proportional to the height differences<br />
between the water in adjacent cells.<br />
The Downhill Model is efficient, intuitive, flexible, and could be applied to<br />
any region with known elevation data. Its two parameters smooth and regulate<br />
water flow, but the model’s predictions depend little on their values.<br />
The UMAP Journal 26 (3) (2005) 245–261. c○Copyright 2005 by COMAP, Inc. All rights reserved.<br />
Permission to make digital or hard copies of part or all of this work for personal or classroom use<br />
is granted without fee provided that copies are not made or distributed for profit or commercial<br />
advantage and that copies bear this notice. Abstracting with credit is permitted, but copyrights<br />
for components of this work owned by others than COMAP must be honored. To copy otherwise,<br />
to republish, to post on servers, or to redistribute to lists requires prior permission from COMAP.
246 The UMAP Journal 26.3 (2005)<br />
For a Saluda Dam breach, the total extent of the flooding is 106.5 km 2 ;it<br />
does not reach the State Capitol. The flooding in Rawls Creek extends 4.4 km<br />
upstream and covers an area of 1.6–2.4 km 2 .<br />
Variables and Assumptions<br />
Table 1 shows the variables used in the design and simulation of the flooding<br />
model, and Table 2 lists the parameters in the simulation program.<br />
Table 1.<br />
Variables used in the model.<br />
Variable Definition<br />
Voume flow rates from the dam<br />
QTF1<br />
For instant total failure<br />
QTF2<br />
For delayed total failure<br />
QPIPE<br />
For piping failure<br />
QOT<br />
For overtopping failure m<br />
Qpeak Times when water ceases to flow through the dam<br />
Maximum flow rate<br />
tTF1<br />
For instant total failure<br />
tTF2<br />
For delayed total failure<br />
tPIPE<br />
For piping failure<br />
tOT<br />
For overtopping failure<br />
∆V Total volume of water displaced from Lake<br />
Murray by flooding<br />
VolLM<br />
Normal volume of Lake Murray<br />
AreaLM<br />
Normal area of Lake Murray<br />
dbreach Depth of the breach from the top of the dam<br />
tbreach Time from when the breach begins to form<br />
until its final formation<br />
m Slope of the sides of the cone approximating<br />
Lake Murray<br />
General Assumptions<br />
• Normal water level is present in the lake prior to a dam breach.<br />
• No seasonal variation of flows occurs in waterways.<br />
• Volume of water in Lake Murray can be accurately approximated by a right<br />
circular cone (Figure 1).<br />
Dam Assumptions<br />
• Saluda Dam fails in one of four ways:<br />
– instant total failure,<br />
– delayed total failure,
Parameter Typical value Meaning<br />
Table 2.<br />
Parameters used in the simulation program.<br />
Through the Breach 247<br />
BREACH_TYPE varies one of INSTANT_TOTAL_FAILURE, DELAYED_TOTAL_FAILURE,<br />
PIPING, orOVERTOPPING<br />
∆T 10.0 Length of one time step (s)<br />
MIN_DEPTH 0.0001 Depth below which a cell is considered empty (m)<br />
TFINAL 100000 Time for the breach to empty completely the affected portion<br />
of the reservoir (s)<br />
Tb 3600 Time until breach reaches maximum size (s)<br />
Q peak 25000 Maximum flow rate of the breach (m 3 /s)<br />
d breach 30 Maximum depth of breach below initital reservoir level (m)<br />
VolumeLM 2.714 × 10 9 Initial volume of Lake Murray (m 3 )<br />
AreaLM 202 × 10 6 Initial area of Lake Murray (m 2 )<br />
k 0.504 Spreading factor (regulates amount of water exchanged<br />
between two cells)<br />
MAX_LOSS_FRAC 0.25 Maximum fraction of a cell’s water that it can donate in a<br />
single time step<br />
Figure 1. Reservoir approximation using a right circular cone.
248 The UMAP Journal 26.3 (2005)<br />
– piping, or<br />
– overtopping.<br />
• Composition of the earthen dam is uniform throughout.<br />
• Width of the base of the breach is between the height of the dam and three<br />
times the height of the dam [U.S. Army Corps of Engineers 1997].<br />
• No human attempt is made to prevent dam breaching.<br />
Downstream Assumptions<br />
• Resistance to water flow due to structures such as bridges and buildings is<br />
negligible.<br />
• Water does not alter the terrain significantly as it flows over the floodplain.<br />
• Water does not make alluvial deposits as it flows over the floodplain.<br />
• A negligible amount of water is present in the valley before flooding.<br />
• Negligible water inflow occurs from sources other than the dam breach.<br />
• No human attempt will be made to prevent flooding.<br />
Accepted Facts<br />
• Area of Lake Murray: 200 km 2<br />
• Volume of Lake Murray: 2.710 × 10 6 m 3<br />
• Height of dam: 63.4 m (crest at 370 ft above sea level)<br />
• Length of dam: 2.4 km<br />
• Elevation of surface of Lake Murray: 106.5—110 m above sea level<br />
Model Design<br />
Dam Breach<br />
Each type of dam breach is described by flow rate as a function of time, with<br />
corresponding parameters.<br />
Instant Total Failure<br />
A model of flow rate for instant total failure is right triangular [U.S. Army<br />
Corps of Engineers 1997] (Figure 2). The parameters are breach depth and peak<br />
volume outflow, with values<br />
dbreach =20m, Qpeak = 30,000 m3 /s.
Delayed Total Failure<br />
Figure 2. Flow rate for an instant total failure.<br />
Through the Breach 249<br />
An isosceles triangle model makes sense for delayed failure because it takes<br />
half of the total volume of water removed from the lake to erode the dam and<br />
the flow rate does not peak until the erosion is complete [U.S. Army Corps of<br />
Engineers 1997] (Figure 3). Also, for an earthen dam, the erosion time may be<br />
longer than for other types of dams, such as concrete.<br />
This model has the same parameters and same values:<br />
dbreach =20m, Qpeak = 30,000 m3 /s.<br />
Figure 3. Flow rate for a delayed total failure.
250 The UMAP Journal 26.3 (2005)<br />
Piping Failure<br />
For a piping failure, the breach begins in the middle of the dam face and<br />
grows until the material above the pipe collapses [Sedimentation and River<br />
Hydraulics Group 2004]. As the breach grows, the flow rate increases exponentially;<br />
the peak flow rate occurs when the material above the pipe collapses.<br />
From that point, the flow through the breach is similar to a total failure. We<br />
select an exponential decay so as to observe a different effect from the linear<br />
decay of the total failure models (Figure 4).<br />
We choose the growth rate so that the peak flow rate occurs at the breach<br />
time, and the decay rate so that the flow rate is less than 1% of the peak flow<br />
rate at the final time. The parameters are the breach depth, the peak volume<br />
outflow of the dam, and the breach time, with values<br />
dbreach =20m, Qpeak = 30,000 m3 /s, tbreach = 50,000 s.<br />
Figure 4. Flow rate for a piping failure.<br />
To demonstrate better the change in flow rate with time when the breach<br />
begins to form, we plot over a shorter range of time in Figure 5.<br />
Overtopping Failure<br />
For an overtopping failure, the water begins flowing over the top of the<br />
breach, eroding the dam from above. We found little information about overtopping<br />
failures. From the piping failure, we estimate that the flow rate increases<br />
according to a parabolic shape until dam erosion is complete (Figure 6).<br />
After this point, which corresponds to the breach time, the flow rate behaves<br />
as in a total failure.<br />
The parameters are again breach depth, peak volume outflow of the dam,<br />
and breach time, with values<br />
dbreach =20m, Qpeak = 30,000 m3 /s, tbreach = 30,000 s.
Downstream Flow<br />
Figure 5. Flow rate for beginning of a piping failure.<br />
Figure 6. Flow rate for an overtopping failure.<br />
Through the Breach 251<br />
We model the behaviour of the water in the region downstream of the breach<br />
using a discrete approach. The Force Model uses a physical analogy based on<br />
the Bernoulli equation for fluid flow; the Downhill Model uses a simpler, more<br />
intuitive mechanism for water flow. The Force Model produces unphysical<br />
results; therefore, we use Downhill Model in analysis of the flooding.<br />
For both models, the region surrounding the Saluda Dam is divided into<br />
a grid of square cells. Each cell covers a surface area of 210 m by 210 m and<br />
has an associated elevation above sea level and a volume of water (based on<br />
the mean depth of water in the cell). The elevation data are adapted from the<br />
U.S. Geological Survey’s National Elevation Data [2004] by (to reduce processing<br />
time) averaging together groups of 7 × 7 cells. Each model simulates the
252 The UMAP Journal 26.3 (2005)<br />
propagation of water among cells; the models differ in how neighbouring cells<br />
determine how much water to exchange per unit time.<br />
Force Model<br />
Design<br />
This model performs a force analysis on the water contained in the model<br />
cells. Each cell has an associated elevation above sea level, mean depth of water<br />
contained in the cell, and mean velocity (x- and y-components) of water within<br />
the cell. The force acting on a particular cell is assumed to be due to two effects<br />
only: the pressure force exerted by the four cells in direct contact with it, and<br />
the gravitational force that accelerates the water to places of lower elevation<br />
(that is, downhill).<br />
The main principles of the model are:<br />
• Volume flow between cells is proportional to the difference in pressure between<br />
the four adjacent cells with a common face.<br />
• Pressure difference in cells is proportional to the difference in mean depth<br />
of each cube.<br />
As demonstrated in the Figures 7 and 8, the mean pressure exerted by a cell<br />
is assumed to be the pressure at half the depth of the cell, or P = 1<br />
2 ρgd.<br />
Figure 7. Pressure forces acting on cell matrix.
Figure 8. Gravitational forces acting on cell matrix.<br />
Through the Breach 253<br />
We assume that the area over which the pressure acts is the mean depth of<br />
the two adjacent cells, so that the depth of water varies linearly between them,<br />
with the depth at the boundary the average depth of the two. The force exerted<br />
by a neighbouring cell is the mean pressure times the area between the two<br />
cells. To find acceleration, we divide the force by the mass of water in the cell,<br />
taken to be the volume of the cell times the water density:<br />
ax = g(d2 0x − d2 2x )<br />
.<br />
4wd1<br />
We calculate the acceleration due to gravity by estimating the gradient of<br />
the ground of the current cell and its four immediate neighbours. We determine<br />
the horizontal component of the acceleration geometrically (Figure 9) tobe<br />
ag = 2∆hwg<br />
4w2 .<br />
+∆h2 The model iterates through a large number of time steps, typically each of<br />
1sduration. At the beginning of each time step, water is injected into the cells<br />
containing the dam breach; the amount is determined by the breach models<br />
described above. For each time step, the acceleration (x- and y-components) is<br />
calculated for each cell in the region, and the velocity of water in the region is<br />
updated according to<br />
vnew = vold + a∆t.
254 The UMAP Journal 26.3 (2005)<br />
Figure 9. Determination of tangential component of gravity.<br />
The direction of the velocity determines in which direction each cell donates:<br />
For vx > 0, the cell donates to the right; for vx < 0, the cell donates to the left.<br />
The amount of water donated is proportional to the speed in that direction, so<br />
that the change in water depth of the current cell is<br />
ddonated = davg∆t<br />
2w .<br />
The water depth of the neighbouring cell receiving the donation is also<br />
updated, so that the total amount of water in the model is conserved (except<br />
for donations off the edges of the map and the water injected at the breach cell).<br />
For very large velocities, a cell can donate more water than it has. Specifically,<br />
if the speed times the time step size is larger than the cell width, the<br />
donation would be greater than the cell’s current volume. If this occurs, the cell
Through the Breach 255<br />
is assumed to donate all its water, and the donations in the x- and y-directions<br />
are scaled to account for this.<br />
Justification<br />
This model is intuitively appealing: It models the behaviour of the water<br />
using a simple but meaningful physical analogy. The force analysis used is<br />
equivalent to taking the gradient of the Bernoulli equation and modeling the<br />
fluid discretely.<br />
The model computes and saves velocity information, allowing modeling of<br />
the manner in which regions are flooded. For example, the model could predict<br />
the speed of the water as it struck a particular building in Columbia, such as<br />
the State Capitol.<br />
Reasons for Rejecting the Model<br />
The results from the model are unrealistic. Since cells with large volumes<br />
of water have small accelerations, these cells tend to empty very slowly, even<br />
if adjacent to completely empty cells; for the same reason, small cells tend to<br />
empty too quickly. The result is a checkerboard pattern: Large cells grow larger<br />
and their small neighbours grow smaller. This error relates to our assumption<br />
that all water within a cell has the same velocity: A single cell cannot spread<br />
out in all directions. For a simpler terrain (such as a simple downhill channel),<br />
this would not be a problem; however, this terrain is highly complicated and<br />
requires the water to propagate in several directions.<br />
Another problem with this model is its complexity. The model juggles a<br />
large number of parameters for each cell, making tuning and troubleshooting<br />
difficult.<br />
Downhill Model<br />
Design<br />
The Downhill Model assumes that the flow rate between two cells is proportional<br />
to the height difference between the centers of mass of those cells<br />
multiplied by the effective area between them. The model allows water to be<br />
donated in multiple directions by a single cell, if it is higher than several of its<br />
neighbours. As in the Force Model, the program iterates through time steps,<br />
adding water each step to the cells containing the dam breach.<br />
For each time step, each cell (except those on the bottom and right boundaries<br />
of the map, which are handled later) exchanges water with the two cells<br />
immediately below and to the right. This ensures that each cell exchanges water<br />
with its four neighbours exactly once per time step. To exchange with a<br />
neighbour, a cell changes its height according to the formula<br />
ddonated = kdavg(h0 − h2).<br />
The value of k is based on the assumption that the water speed at the breach<br />
during the peak flow rate is 30 m/s. We later describe the model’s response to<br />
a change in k.
256 The UMAP Journal 26.3 (2005)<br />
The neighbouring cell then changes its height by the negative of this value.<br />
To ensure consistency, the changes in height are not applied until the end of<br />
the time step, after all cell height changes have been calculated. If a cell had<br />
donated more than MAX LOSS FRAC of the water that it originally contained,<br />
then its donations are scaled down so that it donates exactly this amount. The<br />
factor MAX LOSS FRAC is used to prevent sloshing: Large cells tend to empty<br />
completely into empty neighbours, which then donate back on the next turn,<br />
so that half of the cells are empty at any one time.<br />
For cells along the boundary, donations on their side(s) against the edges<br />
of the map are assumed to be equal to their donations on the opposite sides.<br />
Since these cells are far away from the breach or areas of interest, their precise<br />
behaviour is less important. Our approach ensures that water reaching the<br />
edges of the map leaves smoothly, without piling up unphysically.<br />
Justification<br />
This model affords rapid computation and uses a simple principle that is<br />
easy to troubleshoot. Although the equation governing the water exchange<br />
between cells lacks a direct physical analogy, it produces results consistent<br />
with physical expectations. Water travels most quickly downhill or across the<br />
nearly flat floodplain, and creeps uphill only as water levels rise.<br />
Testing and Results<br />
Testing<br />
To test our models, we use National Elevation Data from the U.S. Geological<br />
Survey [USGS 2004]. The data are a set of elevation values (in meters above<br />
sea level) arranged into rows and columns. Each element represents a square<br />
with sides 30 m in length. To reduce computation, we averaged groups of 7 × 7<br />
cells together, so that the cells that we used were squares 210 m on a side.<br />
We tested both the Force Model and the Downhill Model by placing the<br />
breach cell just in front of the dam face and modeling the spread of water for<br />
several choices of breach type (instant total failure, delayed total failure, piping,<br />
overtopping) and time period (360, 1800, 6240 s). We tested the k dependence<br />
and MAX LOSS FRAC dependence by using the instant total failure breach model.<br />
To prevent errors from very small volumes in cells, we treated a cell as empty<br />
if its mean depth was less than 0.0001 m. This cutoff was especially important<br />
in the Force Model, where such small cells acquire enormous velocities (><br />
10 6 m/s) when placed next to a cell with a significant amount of water.<br />
We tested the Downhill Model for robustness by running the instant total<br />
failure model for 50,000 time steps. The model behaves poorly beyond 40,000<br />
time steps, when the flow rate out of the map becomes much greater than the<br />
flow rate of the dam breach (which has slowed by this point). We also tested<br />
the model for very large flow rates. For rates that increased the height of the<br />
breach cell by more than 10 m per time interval (more than 30 times as large<br />
as any flow rate in the simulation), the simulation lasts only 1000 time steps<br />
before becoming unstable.
Results<br />
Flooding Extent<br />
Through the Breach 257<br />
The extent of the flooding is largely independent of the type of breach (Figure 10);<br />
the difference between breach types is in how quickly flooding spreads. For instant total<br />
failure breach, the flooding has a maximum extent of 106.5 km 2 . The flooding<br />
is greatest in the Saluda and Congaree valleys, which are quite flat and broad.<br />
The flooding in the city of Columbia itself, which is elevated from these valleys,<br />
is very minimal. We did not model the effects of the flooding farther down the<br />
Congaree, but we expect those to be comparable to the flooding within the<br />
region simulated.<br />
Rawls Creek<br />
Figure 10. Comparison of dam breach scenarios: flooding area after 24 h.<br />
The flooding in Rawls creek is extensive in area but not in upstream extent.<br />
Although it is difficult to establish where the flooding of the Saluda river ends<br />
and the flooding of Rawls Creek begins, the area around Rawls Creek that<br />
becomes flooded we estimate as between 1.6 and 2.4 km 2 . The farthest flooded<br />
point is 4.4 km upstream.
258 The UMAP Journal 26.3 (2005)<br />
State Capitol<br />
Flooding does not reach the State Capitol, even for the most extreme case,<br />
instant total failure<br />
Error Analysis, Sensitivity, and Robustness<br />
The model depends on the factor k to scale the amount of water donated. Its<br />
value is based on the assumption that the water speed at the breach during the<br />
peak flow rate is 30 m/s. However, the value of k does not affect the simulation<br />
greatly; the total flooded area after 1800 time steps varies by just 17% when k<br />
is varied by a factor of 100.<br />
The MAX LOSS FRAC is used to prevent each cell from donating too much<br />
water. However, the extent of the flooding is not strongly dependent on its<br />
value, which we took as 0.25 to produce reasonably smooth water distributions.<br />
Strengths and Weaknesses<br />
Strengths<br />
The model is independent of the site simulated: Given elevation data for a<br />
region and an equation governing the flow rate of water from a dam breach, it<br />
calculates the behaviour of flooding.<br />
The Downhill Model is intuitive. It relies on a simple exchange rule between<br />
cells, making it easy to tune and troubleshoot. Tuning may be needed to account<br />
for problems associated with more extreme flooding cases, a need to extract<br />
additional results from the model, or other unforeseen demands.<br />
The algorithm is efficient; the computation of a single time step is linear in<br />
the number of cells in the region. This efficiency makes it possible to model<br />
many variations on breach types and flow rates in a short period of time.<br />
The model produces three data sets of grids: 0/1 values describing which<br />
cells are flooded; the water depth in each cell to determine the severity of the<br />
flooding in a region; and the water depth plus elevation for each cell. From<br />
plots of these data sets, the extent and severity of the flooding are easy to see.<br />
Weaknesses<br />
The primary weakness of this model is the tendency of water in the deeper<br />
regions of the flooded area to slosh. It should be possible to eliminate this,<br />
perhaps by introducing a depth dependence into MAX LOSS FRAC.<br />
Another weakness that could be corrected with more analysis is the time<br />
scale. Since the k-dependence—the only place where the duration of the time<br />
step is used explicitly—is weak, the model’s time scale is not easily changeable.<br />
The time scale could be calibrated by running simulations of an analytical<br />
system, such as the propagation of water down a channel, and determining the<br />
speed of the water and hence the time scale. Since the time scale was not needed<br />
to analyze the extent of the flooding, we did not perform this calibration.
References<br />
Through the Breach 259<br />
Chauhan, Sanjay S., et al. 2004. Do current breach parameter estimation techniques<br />
provide reasonable estimates for use in breach modeling? Utah State<br />
University and RAC Engineers & Economists. www.engineering.usu.<br />
edu/uwrl/www/faculty/DSB/breachparameters.pdf . Accessed 3 February<br />
2005.<br />
Cheremisinoff, Nicholas P. 1981. Fluid Flow: Pumps, Pipes, and Channels. England:<br />
Buttersworth.<br />
Federal Energy Regulatory Commission (FERC). 2002. Saluda Dam remediation:<br />
Updated frequently-asked questions and answers. www.ferc.<br />
gov/industries/hydropower/safety/saluda/saluda_qa.pdf . Accessed<br />
4 February 2005.<br />
Fread, D.L. 1998. Dam-Breach Modeling and Flood Routing: A Perspective on<br />
Present Capabilities and Future Directions. Silver Spring, MD: National Weather<br />
Service, Office of Hydrology.<br />
Mayer, L. 1987. Catastrophic Flooding. Boston, MA: Allen & Unwin.<br />
Munson, Bruce R., et al. 2002. Fundamentals of Fluid Mechanics. 4th ed. New<br />
York: John Wiley & Sons.<br />
Sedimentation and River Hydraulics Group. 2004. Comparison between the<br />
methods used in MIKE11, FLDWAV 1.0, and HEC-RAS 3.1.1 to compute<br />
flows through a dam breach. U.S. Department of the Interior.<br />
Smith, Alan A. Hydraulic theory: Kinematic flood routing. Alan A. Smith Inc.<br />
http://www.alanasmith.com/theory-Kinematic-Flood-Routing.htm .<br />
Accessed 3 February 2005.<br />
U.S. Army Corps of Engineers. 1997. Engineering and design—Hydrologic engineering<br />
requirements for reservoirs. Department of the Army Publication<br />
EM 1110-2-1420, Ch. 16.<br />
U.S. Geological Survey (USGS). 2004. Seamless Data Distribution System, National<br />
Center for Earth Resources Observation and Science. seamless.<br />
usgs.gov . Accessed 4 February 2005.<br />
Wahl, Tony L. 1997. Predicting embankment dam breach parameters—A needs<br />
assessment. Denver, CO: U.S. Bureau of Reclamation. http://www.usbr.<br />
gov/pmts/hydraulics_lab/twahl/publications.html .<br />
Accessed 3 February 2005.<br />
Williams, Garnett P. 1978. Hydraulic geometry of river cross sections—Theory<br />
of minimum variance. Geological Survey Professional Paper. Washington,<br />
DC: U.S. Government Printing Office.
260 The UMAP Journal 26.3 (2005)<br />
Appendix: Dam Breach Model Equations<br />
For an instant total failure:<br />
⎧<br />
⎨<br />
−<br />
QTF1(t) =<br />
⎩<br />
Qpeak(t − tTF1)<br />
, t < tTF1;<br />
tTF1<br />
0 tTF1
Through the Breach 261<br />
Michael G. Barnett, Dr. James Brooke (advisor), Scott J. Wood, and Jennifer Dale Kohlenberg.
262 The UMAP Journal 26.3 (2005)
Analysis of Dam Failure 263<br />
Analysis of Dam Failure in the<br />
Saluda River Valley<br />
Ryan Bressler<br />
Christina Polwarth<br />
Braxton Osting<br />
University of Washington<br />
Seattle, WA<br />
Advisor: Rekha Thomas<br />
<strong>Summary</strong><br />
We identify and model two possible failure modes for the Saluda Dam:<br />
gradual failure due to an enlarging breach, and sudden catastrophic failure<br />
due to liquefaction of the dam.<br />
For the first case, we describe the breach using a linear sediment-transport<br />
model to determine the flow from the dam. We construct a high-resolution<br />
digital model of the downstream river valley and apply the continuity equations<br />
and a modified Manning equation to model the flow downstream.<br />
For the case of dam annihilation, we use a model based on the Saint-Venant<br />
equations for one-dimensional flood propagation in open-channel flow. Assuming<br />
shallow water conditions along the Saluda River, we approximate the<br />
depth and speed of a dam break wave, using a sinusoidal perturbation of the<br />
dynamic wave model.<br />
We calibrate the models with flow data from two river observation stations.<br />
We conclude that the flood levels would not reach the Capitol Building but<br />
would intrude deeply into Rawls Creek.<br />
Introduction<br />
The Saluda Dam, located 20 km above Columbia, South Carolina, impounds<br />
the almost 3-billion-cubic-meter Lake Murray [South Carolina Electric & Gas<br />
Company 1995]. It is a large earthen dam of a type that has failed in earthquakes<br />
before [Workshop 1986]. In such a failure, the water in Lake Murray would<br />
The UMAP Journal 26 (3) (2005) 263–278. c○Copyright 2005 by COMAP, Inc. All rights reserved.<br />
Permission to make digital or hard copies of part or all of this work for personal or classroom use<br />
is granted without fee provided that copies are not made or distributed for profit or commercial<br />
advantage and that copies bear this notice. Abstracting with credit is permitted, but copyrights<br />
for components of this work owned by others than COMAP must be honored. To copy otherwise,<br />
to republish, to post on servers, or to redistribute to lists requires prior permission from COMAP.
264 The UMAP Journal 26.3 (2005)<br />
rush down the Saluda River Valley towards Columbia, its 100,000 residents,<br />
and the State Capitol.<br />
We present a comprehensive mathematical description of the resulting flood,<br />
including its intrusion into Columbia and the tributaries of the Saluda. See Figure<br />
1 for an overview of the local topography.<br />
Figure 1. An overview of Lake Murray and the Saluda River Valley generated from the NCRS<br />
topographical data [National Geophysical Data Center 2005]. (a) Lake Murray. (b) Saluda River.<br />
(c) Rawls Creek. (d) State Capitol Building.<br />
A brief survey of earthquake-related earthen dam incidents [Workshop<br />
1986] reveals that failure can follow two distinct courses:<br />
• A crack or breach forms in the dam, causing gradual failure due to erosion.<br />
• The dam is completely annihilated, resulting in the formation of a surge.<br />
To describe both of these situations accurately, we apply two different models.<br />
Gradual Failure The relatively gradual rate at which water is introduced into<br />
the downstream valley suggests that the dispersion of the flood may be modeled<br />
using classical open-channel hydraulics. We divide the downstream<br />
river course into basins or reaches and then use the Manning formula and<br />
the continuity equation to describe the movement of water between them.
Analysis of Dam Failure 265<br />
We determine the flow into the first basin using a model for the destruction<br />
of the dam due to breach erosion.<br />
We create a three-dimensional topographical model of each basin using<br />
3’ resolution data from the NGDC Coastal Relief Model [National Geophysical<br />
Data Center 2005]. (Figure 1 was generated using these models.) This<br />
lets us estimate the relationship between the volume in each basin and the<br />
cross-sectional area of its outflow channel. The Manning formula and the<br />
continuity equation yield a system of coupled first-order differential equations.<br />
We integrate this system numerically and calibrate it using data for<br />
normal flow in the Saluda River from river observation stations just below<br />
the Saluda Dam and just above Columbia City [USGS 2005].<br />
Rapid Failure The flood wave is described as a sinusoidal perturbation to the<br />
steady-state solution of the Saint-Venant equation. We apply the dynamic<br />
wave model of Ponce et al. [1997] to determine the surge’s propagation.<br />
We represent the Saluda River Valley as a prismatic channel of rectangular<br />
cross section. We use a small surge recorded by the USGS river observation<br />
station in the Saluda Valley [USGS 2005] to calibrate the frictional constant<br />
governing the rate of attenuation of the flood waves.<br />
Finally, we address the results of the two models and their consequences<br />
for Rawls Creek, the Capitol, and the residents of Columbia.<br />
Gradual Failure<br />
Our model for downstream flooding depends on the conservation of matter<br />
as described by the continuity equation, which states that for any given reach<br />
of the river, the change in volume equals the difference between flow in and<br />
flow out:<br />
dV<br />
dt = Qin − Qout, (1)<br />
where V is the volume of the reach, t is time, and Qin and Qout are the flows.<br />
We divide the Saluda River Valley into four reaches. Since the amount of<br />
water involved in a dam failure flood would be significantly greater than that<br />
contributed by any other source, we simplify our model by assuming that all<br />
flow into and out of a reach would occur along the Saluda. For each reach, we<br />
set Qin of each reach equal to Qout of the reach above it, ignoring all tributaries.<br />
Eq. (1) becomes:<br />
dVn<br />
dt = Qn−1 − Qn, n =1,...4, (2)<br />
where Vn is the volume in the nth reach (numbered downstream from the dam)<br />
and Qn is the flow out of the nth reach; Q0 is the flow into the reach 1 through<br />
the breach in the dam.
266 The UMAP Journal 26.3 (2005)<br />
To evaluate (2),wemust estimate several parameters and relations:<br />
• the flow out of the reservoir (into the first reach) resulting from a dam breach,<br />
• the flow through each reach, and<br />
• the topographical profiles of the reaches.<br />
Flow Through the Breach<br />
Dam-breach erosion is an interaction between the flooding water and the<br />
material of the dam. Once a breach has formed, the discharging water further<br />
erodes the breach. Enlargement of the breach increases the rate of discharge,<br />
which in turn increases the rate of erosion. This interaction continues until the<br />
reservoir water is depleted or until the dam resists further erosion.<br />
We assume that the pre-breach flow into and out of the reservoir can be<br />
ignored, since they are of opposite sign and of negligible magnitude compared<br />
to the flooding waters. The breach outflow discharge Q0 equals the product<br />
of the rate at which the water is lowering and the surface area at that height,<br />
As(H). Also, the breach outflow discharge is related to the mean water velocity<br />
u and the breach cross-sectional area Ab by the continuity equation:<br />
As(H) dH<br />
dt = −Q0 = −uAb. (3)<br />
Experimental observations show that the flow of water through a breach<br />
can be simulated by the hydraulics of broad-crested weir flow [Chow 1959;<br />
Pugh et al. 1984]:<br />
u = α(H − Z) β , (4)<br />
where Z is the breach bottom height measured from the bottom of the lake. For<br />
critical flow conditions, α =[(2/3) 3 g] 1/2 =1.7 m/s and β =1/2 [Singh 1996].<br />
We further assume that the surface area of the reservoir, As,isindependent<br />
of the height (i.e., the reservoir is rectangular). Combining (3) and (4) yields<br />
dH<br />
As<br />
dt = −uAb = −α(H − Z) 1<br />
2 Ab. (5)<br />
We describe erosion in the breach using the simplest method that has been<br />
used to model dam breaks accurately in the past [Singh 1996] and assume that<br />
dZ<br />
dt = −γuφ = −γα φ (H − Z) φβ , (6)<br />
where γ and φ are determined from experimental analysis of the dam material<br />
and u is given by (4). Because we do not have access to the dam, we assume<br />
that φ =1(linear erosion) and approximate γ as 0.01. This value of γ has given<br />
good results for linear erosion in the past [Singh 1996]. Eqs. (5)–6) are coupled
Analysis of Dam Failure 267<br />
first-order differential equations governing the elevation of the water surface<br />
and the elevation of the breach bottom as functions of time. To evaluate them,<br />
we must determine the shape of the breach.<br />
Breaches in dams are typically modeled as triangles, trapezoids, or rectangles;<br />
but rectangles are used most often, since the resulting ODEs (5)–(6) are<br />
solved relatively easily [Singh 1996]. For simplicity, we model the breach as a<br />
rectangle with constant width b such that it erodes only in the vertical direction.<br />
Thus, the area of the breach is given by<br />
Ab = b(H − Z). (7)<br />
Substituting (7) into (5) and rewriting (6) with φ =1and β =1/2 gives<br />
dH<br />
dt<br />
αb<br />
= − (H − Z)<br />
As<br />
3<br />
2 ,<br />
dZ<br />
dt<br />
= −γα(H − Z) 1<br />
2 . (8)<br />
Equations (8) admit the solution<br />
<br />
−(Z0 − Z)<br />
H(Z) =Z + q + C exp<br />
, (9)<br />
q<br />
2<br />
t(Z) =<br />
√ <br />
H(Z)−Z<br />
q arctanh q<br />
− D,<br />
γα<br />
where q = Asγ/b and C = H0 − Z0 − q, H0 and Z0 are the initial values of H<br />
and Z at t = t0, and D is a constant of integration determined from the initial<br />
conditions. The quantity Z(t) is defined implicitly by (9), and H(t) can then be<br />
recovered from (9). Then the flow through the breach, Q0 can be determined<br />
from (3) and (5):<br />
1/2 −(Z0 − Z)<br />
Q0 = −α q + C exp<br />
Ab. (10)<br />
q<br />
When Z(t) =0at some time ˜t, the dam must stop eroding and from (8) we<br />
obtain<br />
resulting in<br />
H(t) =<br />
1<br />
√H0<br />
dH<br />
dt<br />
αb<br />
= − H<br />
As<br />
3/2 , (11)<br />
+ αb<br />
−2 (t − t0)<br />
2As<br />
for t ≥ ˜t. (12)<br />
Figure 2 graphs Q and Z vs. time. The discontinuity of the derivative at<br />
time ˜t ≈ 2 histhe transition between these two solutions.
268 The UMAP Journal 26.3 (2005)<br />
Figure 2. Flow through dam and height of breach bottom as breach enlarges.<br />
Flow Between Reaches and the Manning Equation<br />
We select reaches so that the river valley at their junctions is relatively prismatic<br />
and narrow. Assuming that the flow in a flood would be regulated by<br />
the rate at which water can flow through these narrows, we model the river as<br />
a series of pools, one flowing into the next.<br />
Traditionally, flow in a floodplain is analyzed as the flow in a prismatic<br />
channel using the Manning equation<br />
where<br />
u is the mean flow velocity,<br />
u = 1<br />
nm<br />
A<br />
Pw<br />
nm is determined experimentally for each channel,<br />
A is the cross-sectional area of the flow channel,<br />
Pw is the wet perimeter of the channel cross section, and<br />
S is the slope of the energy line.<br />
2/3 √S, (13)<br />
There is no theoretical basis for the Manning equation; however, it has been<br />
extensively verified experimentally. Its primary advantage is the amount of<br />
information available on estimating Manning coefficients, nm [Chanson 2004].<br />
We apply it in our model because we can estimate nm for the Saluda from<br />
data for other floodplains. The prismatic nature of the narrows means that we<br />
can apply the Manning equation without correcting for channel irregularities.<br />
Typical values of nm are 0.5 for a brush-covered floodplain and 1.5 for a treecovered<br />
one [Chanson 2004]. Assuming that our floodplain is somewhere<br />
between, we choose a moderate value of nm =1.
Analysis of Dam Failure 269<br />
We set S, the slope of the energy line, equal to the slope of the valley floor.<br />
This is equivalent to assuming that the depth and speed of the water are constant<br />
with respect to flow direction in each narrows. Because of this, our model will<br />
be most accurate when radical changes in volume occur on a time scale greater<br />
than the time required to pass through the narrows. From the propagation rates<br />
observed, the time required for the water to pass through each of the narrows is<br />
on the order of 0.1 h. The flood that we wish to consider rises sharply for 0.5 h,<br />
stays steady for 1.5 h, and then trails off gradually (see Figure 2). Our model<br />
is least accurate for the steepest part of the initial rise but ultimately describes<br />
most of the flood well.<br />
We estimate the slope of the channel out of each reach from USGS topographical<br />
maps [USGS 1971; 1994; 1997]:<br />
S1 = 1<br />
1200 , S2 = 1<br />
800 , S3 = 1<br />
600 , S4 = 1<br />
. (14)<br />
800<br />
We estimate S4, the slope of the final outflow channel, conservatively so as<br />
to produce a worst-case scenario of the flooding of the basin that contains<br />
Columbia.<br />
Our topographical models of the river basin allow us to establish one-to-one<br />
correspondences between the volume of water in each reach, the cross-sectional<br />
area and wet perimeter of its outlet, and the height of the water in the reach.<br />
These correspondences define the cross-sectional area and wet perimeter of the<br />
outflow narrows as functions of volume; we designate these functions as An(V )<br />
and Pn(V ). Noting that for a given channel cross section, the flow Q satisfies<br />
Q = uAn, (15)<br />
where u is the mean water velocity, (13) can be stated as a constraint on (2):<br />
Qn = Anun = An<br />
nm<br />
An<br />
Pn<br />
2/3 Sn, (16)<br />
where An = An(ρV ), Pn = Pn(ρV ), and V = V (t − ζ).<br />
We introduce parameters ρ and ζ to calibrate of the model; we determine<br />
them subsequently from observational data.<br />
ρ describes how friction and surface features of the reach prevent the entire<br />
volume of water from flowing downstream.<br />
ζ describes the amount of time that it takes water to pass through a reach. We<br />
assume ζ to be constant because of the constant length of our reaches.<br />
Selection and Analysis of Reaches<br />
We use 3’ topographical data [National Geophysical Data Center 2005] to<br />
construct a topographical model. To establish correspondences between the
270 The UMAP Journal 26.3 (2005)<br />
volume Vn of water contained in each basin and the area An and wet perimeter<br />
Pw of their outflow channels, we intersect the topographical model of each<br />
basin with a plane representing the water level and integrate numerically over<br />
the appropriate regions. We construct a database of these values in terms of<br />
height, to be used as we simulate (2). Figure 3 displays one such profile, for<br />
reach 4, with volume and area next to the topographical map of the basin.<br />
Our accuracy is limited by the 0.2-m height resolution of the NGDC data.<br />
This does not significantly effect the accuracy of our volume estimates, but the<br />
area and wet perimeter estimates display noticeable discontinuities for small<br />
volumes. (The oscillatory behavior seen later in Figure 4 is caused by this.) Our<br />
model could be improved by conducting better surveys of the outflow channel<br />
of each reach; since we are primarily interested in large volumes, we proceed.<br />
To summarize, our model places the following requirements on the selection<br />
of the reaches:<br />
• The inflow and outflow channels must be narrower than the rest of the reach.<br />
• The channels must also be prismatic.<br />
• Water should take approximately the same amount of time to flow down<br />
each reach.<br />
To satisfy these conditions, we construct reaches as follows:<br />
• Reach 1: The 6-km section from Saluda Dam to the narrows at Correly Island.<br />
• Reach 2: The 6-km section from Correly Island to the narrows just below<br />
Interstate 20.<br />
• Reach 3: The 6-km section from just below Interstate 20 to the narrows just<br />
above the Saluda’s outlet into the Congaree river.<br />
• Reach 4: A large section of the Congaree River Basin including the area<br />
around the Capitol and a 6-km stretch of downstream channel.<br />
Reaches 1, 2, and 3 satisfy our requirements extremely well. The Congaree<br />
River valley widens rapidly into a floodplain below Columbia and there are<br />
no natural narrows. We end our basin at a point that is somewhat narrow and<br />
satisfies the requirement for water flow time. A large portion of the broad river<br />
valley is included to allow for upstream flooding.<br />
Calibration and Sensitivity Analysis<br />
The US Geological Survey (USGS) has river observation stations just below<br />
the dam (at 34 ◦ 03 ′ 03” N 81 ◦ 12 ′ 35” W) and just above Columbia (at 34 ◦ 00 ′ 50” N<br />
81 ◦ 05 ′ 17” W). Each logs the last 31 days’ flows [USGS 2005]. On 6 January 2005,<br />
the station at Saluda Dam registered a surge of 30,000 m 3 . Flow rates jumped<br />
from 27 m 3 /s to 700 m 3 /s and then receded over a 5-h period. A similar surge
Analysis of Dam Failure 271<br />
Figure 3. Topographical map and volume and outlet channel area profiles for Reach 4.<br />
Surge down the Saluda River on 6 January 2005.<br />
The solid line is flow at the upstream station and<br />
the dotted line is flow at the downstream station.<br />
Figure 4. Actual surge and simulated surge.<br />
Our simulation of a similar surge.
272 The UMAP Journal 26.3 (2005)<br />
was recorded by the Columbia observation station 1.5 h later (see Figure 4).<br />
We use this event to calibrate our model.<br />
We first calibrate the model to produce a typical river flow at the dam to a<br />
value of 60 m 3 /s and systematically vary ρ. Wefind that our model displays<br />
stable but oscillatory behavior for ρ < 0.1. The oscillations can be traced<br />
to jumps in the flow rates between the breaches, and we attribute them to<br />
inaccuracy of our channel profiles for small volumes.<br />
For ρ =0.1, our system becomes unstable when large volumes are introduced.<br />
Since we are indeed interested in a large flood, we set ρ =0.01. This<br />
value is consistent with the idea that the ground cover density, and thus the<br />
amount of water stored in the ground cover, increases with distance from the<br />
main river channel. The small size of ρ corresponds to the fact that in our<br />
equation it scales volume.<br />
Once our model is stable for typical flow volumes, we introduce a “flood”<br />
in the form of a Gaussian bump in Q0 of similar shape to the Jan. 6th event. We<br />
adjust ζ until this event arrives at the bottom of reach 3 in 1.5 hours. This occurs<br />
when ζ = −0.5, consistent with the three reaches that must be traversed. In<br />
calibrating our model for a large flood by using a small one, we assume that the<br />
effect of ζ is independent of flood size. A better calibration could be achieved<br />
by analyzing observations of a larger flood, but such data are not available from<br />
the observation stations [USGS 2005].<br />
Predictions<br />
Our model predicts that the flood waters would travel slowly down the<br />
Saluda River Valley, producing extremely high levels of flooding in the upper<br />
reaches of the Saluda near Rawls Creek (reach 1) and near Columbia (reach 4).<br />
Our results are summarized in Figure 5 and in Tables 1–2. Our numerical<br />
simulations suggest that Rawls Creek would flood approximately 32 m but the<br />
State Capitol building would remain dry.<br />
Table 1.<br />
The maximum flood volumes in each reach and their corresponding elevations above sea level.<br />
Reach Max. Flood Vol. Max Flood Elev. Avg. River Elev.<br />
(×10 8 m 3 ) (m) (m)<br />
1 19 87 58<br />
2 15 79 55<br />
3 3.5 68 50<br />
4 2.4 68 45
Table 2.<br />
Elevation above sea level of points of interest.<br />
Point of Interest Elevation (m)<br />
Lake Murray 120<br />
Saluda River (Just Below Dam) 60<br />
Rawls Creek (Reach 1) 55<br />
Saluda River (Bottom of River) 45<br />
Capitol (Reach 4) 100<br />
Analysis of Dam Failure 273<br />
Figure 5. Volumes predicted in each reach as a gradual flood propagates.<br />
Rapid Failure: Dam Break Wave<br />
The complete annihilation of a dam results in a highly turbulent, unsteady<br />
flow that is commonly known as a dam break wave. The removal of the dam<br />
results in the creation of a retreating (negative surge) wave front in response<br />
to the sudden reduction in flow depth [Chanson 2004]. In the case of a dam<br />
separating two bodies of water, the intersection of the resulting negative surge<br />
with a relatively slow moving body of water results in a discontinuity of velocity.<br />
Since momentum must be preserved, these two bodies of water cannot<br />
intersect without the creation of a second wave moving in a direction opposite<br />
to that of the first wave; this second wave is a positive surge (see Figure 6).<br />
The propagation properties of the wave resulting from the intersection of<br />
the positive and negative surges can be described using equations developed<br />
by Saint-Venant. These equations form a coupled system of one-dimensional<br />
quasi-linear hyperbolic partial differential equations describing varied unsteady
274 The UMAP Journal 26.3 (2005)<br />
Figure 6. The shape of the wave just after the dam fails. The dam is located at x =0. Note the<br />
discontinuity between the positive and negative surges at x = 100 m.<br />
channel flow [Freed 1971]:<br />
1 ∂u u ∂u ∂d<br />
+ +<br />
g ∂t g ∂x ∂x +(Sf − S0) =0, (17)<br />
∂d ∂du ∂d<br />
∂d<br />
+ = + d∂u + u<br />
∂t ∂x ∂t ∂x ∂x =0,<br />
where u is the mean velocity of the wave, d is the flow depth, x is the direction<br />
of propagation, t is time, and g is the acceleration due to gravity. Sf is the<br />
friction slope and S0 is the slope of the canal.<br />
The first equation is known as the equation of motion and describes the contribution<br />
of various forces to wave propagation, each of which is represented<br />
by a separate term:<br />
• the first term describes the local inertia of the wave,<br />
• the second term describes the convective inertia of the wave,<br />
• the third term describes the pressure differential, and<br />
• the fourth term describes the friction and bed slope.<br />
The second equation, known as the equation of continuity, expresses conservation<br />
of mass.<br />
The Saint-Venant equations assume the following [Chanson 2004; Freed<br />
1971]:<br />
• The flow is one dimensional; motion occurs only in the direction of propagation.
Analysis of Dam Failure 275<br />
• Vertical acceleration is negligible, resulting in a hydrostatic pressure distribution.<br />
• Water is incompressible.<br />
• Flow resistance is the same as for uniform flow, Sf = S0.<br />
We are interested in describing the flood wave attenuation. In our model,<br />
we assume that the total volume of water impounded by the Saluda Dam is<br />
released as a single giant surge. The final value to which the peak discharge is<br />
attenuated is independent of the magnitude of the initial peak discharge [Ponce<br />
et al. 2003]. This allows for generalization of results calculated by our model<br />
to waves of arbitrary size.<br />
Solutions to the Saint-Venant Equations<br />
Ponce et al. [2003] derives a solution to (17) in the case of a dam failure<br />
through sinusoidal perturbation of the steady-state solution. Using spectral<br />
analysis, it can be shown that the peak discharge at position X has magnitude<br />
qp = qp0 exp<br />
<br />
−αX<br />
, (18)<br />
where<br />
with<br />
L0<br />
α = 2π<br />
m2 <br />
L0d0B<br />
<br />
ζ −<br />
Vw<br />
C − A<br />
<br />
1/2<br />
, A =<br />
2<br />
1<br />
F 2 0<br />
ζ = 1<br />
σF 2 , σ =<br />
0<br />
2π<br />
L<br />
F0 the Froude number F0,<br />
u0 the steady equilibrium mean flow velocity,<br />
L the perturbation wavelength,<br />
L0 the reference channel length,<br />
d0 the steady equilibrium flow depth,<br />
B the average reach width,<br />
Vw the reservoir volume,<br />
g the acceleration due to gravity, and<br />
m the Manning friction coefficient.<br />
− ζ 2 , C =<br />
<br />
A 2 + ζ<br />
<br />
L0, F0 = u0<br />
√gd0 ,<br />
2 1<br />
2<br />
,
276 The UMAP Journal 26.3 (2005)<br />
The equation for unit width discharge (speed × depth) is<br />
q = N<br />
N +1 Vmaxd (19)<br />
where N = 0.4 8/f, f is the Darcy friction factor, Vmax is the maximum<br />
reservoir volume, and d is the flow depth.<br />
We compute the wave speed using the empirical data in Figure 4 and from<br />
it estimate the Darcy friction factor f for the Saluda River Valley. From (19),we<br />
also estimate the depth of the wave.<br />
Predictions<br />
Using estimated values of the depth of the water impounded by the dam,<br />
the depth of the Saluda River in close proximity to the dam, and the volume of<br />
the Saluda River Basin, we approximate the depth of a dam break wavefront<br />
as a function of distance from the damsite. Figure 7 displays the results. The<br />
depth of the dam break wave decreases exponentially from an initial value of<br />
65 m to a final value of approximately4matadistance of 20 km from the dam<br />
site. This distance roughly corresponds to the distance between the Saluda<br />
Dam and the Capitol Building.<br />
Since the Capitol Building sits approximately 50 m above the Saluda River,<br />
the possibility of the wave reaching the Capitol Building is extremely small.<br />
The probability is further decreased by the simplistic geometry of our model,<br />
which approximates the river bed approximated as rectangular and of uniform<br />
width and texture. In reality, the river exhibits numerous contractions and<br />
expansions and is far from uniform in texture. These qualities would further<br />
attenuate the flow depth of the propagating wave.<br />
Figure 7. Predicted maximum depth of the floodwave for the upper Saluda River (left) and the<br />
entire Saluda River (right).<br />
Our model predicts a wave 40 m high in the vicinity of Rawls Creek. A<br />
rapid dam failure would cause significant intrusion of flood waters into the<br />
Rawls Creek basin.
Conclusions<br />
Analysis of Dam Failure 277<br />
In either gradual or rapid failure of the Saluda dam, the effect on the downstream<br />
areas would be severe. Our models predict that the waters near Rawls<br />
Creek could rise by as much as 40 m (rapid dam failure) or 32 m (gradual dam<br />
failure), protruding far into the Rawls Creek basin and other drainages. The<br />
waters would not be as high near Columbia and would not reach the Capitol<br />
Building. However damage to low-lying areas would be severe, since the water<br />
might rise as much as 23 m.<br />
Several improvements could be made to the models:<br />
Gradual Failure Model<br />
• This model successfully describes small surges in the Saluda River. However,<br />
extrapolating small events to larger events is inherently problematic;<br />
so for a flood of the magnitude that we are considering, we should test the<br />
model against larger events in the Saluda and/or large events in comparable<br />
rivers.<br />
• Estimates in our erosion model could be strengthened with better information<br />
about the material from which the dam is constructed.<br />
• Better profiles of the outlet channel of each reach would allow us to apply<br />
the Manning Equation more accurately.<br />
Rapid Failure Model<br />
• We calibrate this model too from a small surge in the Saluda River. A more<br />
comprehensive study of waves from other breached dams would provide<br />
better data for calibration of this model for large events.<br />
• Access to the river site would provide better estimates for friction factors of<br />
the floodplain.<br />
• This model is intended to place an upper bound on the magnitude of the<br />
flood wave. Further consideration of factors such as turns in the flood course<br />
would increase the accuracy of this model.<br />
References<br />
Chanson, Herbert. 2004. The Hydraulics of Open Channel Flow: An Introduction.<br />
2nd ed. Amsterdam, Holland: Elsevier.<br />
Chow, V.T. 1959. Open-Channel Hydraulics. New York: McGraw-Hill.<br />
Fread, D.L. 1971. Transient hydraulic simulation: Breached earth dams. Doctoral<br />
Dissertation, University of Missouri–Rolla.<br />
National Geophysical Data Center Coastal Relief Model. 2005. GEODAS<br />
Grid Translator—Design-a-Grid. http://www.ngdc.noaa.gov/mgg/gdas/<br />
gd_designagrid.html .
278 The UMAP Journal 26.3 (2005)<br />
Ponce, V.M., and D.B. Simons. 1977. Shallow wave propagation in open channel<br />
flow. Journal of the Hydraulics Division 103 (12): 1461–1476.<br />
Ponce, V.M., A. Taher-shamsi, and A.V. Shetty. 2003. Dam-breach flood wave<br />
propagation using dimensionless parameters. Journal of the Hydraulics Division<br />
129 (10): 777–782.<br />
Pugh, C.A., and F.W. Gray, Jr. 1984. Fuse Plug Embankments in Auxillary<br />
Spillways—Devloping Design Guidlines and Paramaters. Bureau of Reclamation<br />
Reports. Denver, CO: U.S. Dept. of the Interior.<br />
Singh, Vijay P. 1996. Dam Breach Modeling Technology. Dordrecht, Holland:<br />
Kluwer Academic Publishers.<br />
South Carolina Electric & Gas Company. 1995. Lake Murray Shoreline<br />
Management Program. http://www.scana.com/NR/rdonlyres/<br />
e56porb5wwxxtjqfz3i4dci3pc7j3o2ans3t7c2ydaoh5m7myuigj5dz3cnmdw7<br />
qpplewtvnq4j3qy3lhhrmjvmqawh/shorelinemanagementplan.pdf .<br />
Workshop on Seismic Analysis and Design of Earth and Rockfill Dams. 1986. Lecture<br />
notes. 2 vols. New Delhi, India: Central Board of Irrigation and Power.<br />
USGS (Department of the Interior, U.S. Geological Survey). 1971. Irmo Quadrangle<br />
South Carolina 7.5 Minute Series (Topographic). Photorevised 1990.<br />
Denver, CO: Department of the Interior, U.S. Geological Survey.<br />
. 1994. South West Columbia Quadrangle South Carolina 7.5 Minute<br />
Series (Topographic). Denver, CO: Department of the Interior, U.S. Geological<br />
Survey.<br />
. 1997. Columbia North Quadrangle South Carolina 7.5 Minute Series<br />
(Topographic). Denver, CO: Department of the Interior, U.S. Geological<br />
Survey.<br />
. 2005. USGS Real-Time Water Data for the Nation. Stations 02168504<br />
(Saluda River below Lake Murray Dam ... ) and 02169000 (Saluda River<br />
near Columbia, SC). NWISWeb Data for the Nation. http://waterdata.<br />
usgs.gov/nwis/current/?type=flow .<br />
Prof. Rekha Thomas, Ryan Bressler, Christina Polwarth, Braxton Osting, and Prof. Jim Morrow.<br />
Prof. Morrow coached the other MCM team from the University of Washington.
Judge’s Commentary 279<br />
Judge’s Commentary:<br />
The Outstanding Flood Planning<br />
Papers<br />
Daniel Zwillinger<br />
Raytheon<br />
528 Boston Post Road<br />
Sudbury, MA 01776<br />
Introduction<br />
Flood planning for dams is a real-life activity. An analysis of the Saluda Dam<br />
at Lake Murray determined that the area below the dam needed to be protected<br />
in the event of dam failure, and a second dam is being built. Investigation<br />
conclusions can be found on the Web.<br />
Since flood plan analysis is complex, mathematical modeling is appropriate<br />
and useful. A sequence of models is typically used to understand a phenomena.<br />
For the Saluda Dam, a first model might have a straight river, the dam<br />
disappearing instantaneously, and a simple model of water flow. More detailed<br />
effects could then be added: the riverbed bends, the riverbed gradient is not<br />
uniform, perhaps the dam breaks slowly, perhaps the dam is breached in the<br />
center, etc. Starting with a complicated model may make it difficult to determine<br />
if the results are reasonable, since there may be little to validate against. A<br />
series of models that allows additional effects to be incorporated sequentially<br />
is preferable; it may facilitate creation of a sensitivity analysis.<br />
Water flow in open channels has traditionally been modeled by the Saint-<br />
Venant equations, which are nonlinear partial differential equations. Many<br />
teams started by numerically solving these equations and got immersed in<br />
details. (The MCM is not a contest in computation!) Often these teams focused<br />
only on the water flow and spent little effort modeling the dam break itself.<br />
Although there are many models for dam failure, a dam “vanishing” completely<br />
is rather simplistic. (There are a few well-defined dam failure mechanisms.<br />
Teams that considered different mechanisms tended to do better than those<br />
teams that used simplistic assumptions.)<br />
The UMAP Journal 26 (3) (2005) 279–281. c○Copyright 2005 by COMAP, Inc. All rights reserved.<br />
Permission to make digital or hard copies of part or all of this work for personal or classroom use<br />
is granted without fee provided that copies are not made or distributed for profit or commercial<br />
advantage and that copies bear this notice. Abstracting with credit is permitted, but copyrights<br />
for components of this work owned by others than COMAP must be honored. To copy otherwise,<br />
to republish, to post on servers, or to redistribute to lists requires prior permission from COMAP.
280 The UMAP Journal 26.3 (2005)<br />
Many teams started with static models, but most recognized that these models<br />
do not yield reasonable results. The dam-break problem seemed to require<br />
a dynamic approach. The approaches varied considerably, but included:<br />
• Continuous technique: use of sophisticated equations, such as Saint-Venant’s<br />
equation. (Note: Copying an equation derivation achieves little. Pointing<br />
out assumptions needed to obtain an equation may be useful.)<br />
• One-dimensional discrete techniques: breaking the Saluda River up into<br />
prisms and computing flow from one to the next. Rectangles and trapezoids<br />
were popular choices.<br />
• Two-dimensional discrete techniques: cellular automata using USGS data<br />
and computing flows from neighboring cells. The cellular approach can be<br />
difficult to understand and to implement correctly.<br />
Widely varying techniques obtained approximately the same result. Teams<br />
that used more than one approach tended to do better. The usual answers to<br />
the specific test questions are: No, the State Capitol doesn’t flood, and Rawls<br />
Creek backs up about 2.5 miles.<br />
The outstanding papers are remarkable in that each used a fundamentally<br />
different technique:<br />
• The University of Washington team pursued an analytic approach. They<br />
considered two models, obtained real data, and calibrated their model.<br />
• The Harvey Mudd team numerically solved the Saint-Venant equations.<br />
• The University of Saskatchewan team considered a model, rejected it as<br />
being unrealistic, and then numerically solved a dynamic model that they<br />
created themselves.<br />
Some overall comments on the submissions:<br />
• Several teams validated their results from evacuation plans and recorded<br />
flood events. Many others did not do enough reality checking; a back-ofthe-envelope<br />
computation frequently would have helped.<br />
• Many teams had perhaps overly complicated models, involving many variables<br />
and parameters.<br />
• The reference for a Web page should list the date of access.
About the Author<br />
Judge’s Commentary 281<br />
Daniel Zwillinger attended MIT and Caltech, where he obtained a Ph.D. in<br />
applied mathematics. He taught at <strong>Rensselaer</strong> <strong>Polytechnic</strong> <strong>Institute</strong>, worked in<br />
industry (Sandia Labs, Jet Propulsion Lab, Exxon, IDA, Mitre, BBN), and has<br />
been managing a consulting group for the last dozen years. He has worked<br />
in many areas of applied mathematics (signal processing, image processing,<br />
communications, and statistics) and is the author of several reference books.
282 The UMAP Journal 26.3 (2005)
The Booth Tolls for Thee<br />
Adam Chandler<br />
Matthew Mian<br />
Pradeep Baliga<br />
Duke University<br />
Durham, NC<br />
Advisor: William G. Mitchener<br />
<strong>Summary</strong><br />
The Booth Tolls for Thee 283<br />
We determine the optimal number of tollbooths for a given number of incoming<br />
highway lanes. We interpret optimality as minimizing “total cost to<br />
the system,” the time that the public wastes while waiting to be processed plus<br />
the operating cost of the tollbooths.<br />
We develop a microscopic simulation of line-formation in front of the tollbooths.<br />
We fit a Fourier series to hourly demand data from a major New Jersey<br />
parkway. Using threshold analysis, we set upper bounds on the number of<br />
tollbooths. This simulation does not take bottlenecking into account, but it<br />
does inform a more general macroscopic framework for toll plaza design.<br />
Finally, we formulate a model for traffic flow through a plaza using cellular<br />
automata. Our results are summarized in the formula for the optimal number<br />
B of tollbooths for L lanes: B = ⌊1.65L +0.9⌋.<br />
Previous Work in Traffic Theory<br />
Most models for traffic flow fall into one of two categories: microscopic and<br />
macroscopic.<br />
Microscopic models examine the actions and decisions made by individual<br />
cars and drivers. Often these models are called car-following models, since they<br />
use the spacing and speeds of cars to characterize the overall flow of traffic.<br />
Macroscopic models view traffic flow in analogy to hydrodynamics and the<br />
flow of fluid streams. Such models assess “average” behavior, and commonlyused<br />
variables include steady-state speed, flux of cars per time, and density of<br />
traffic flow.<br />
The UMAP Journal 26 (3) (2005) 283–297. c○Copyright 2005 by COMAP, Inc. All rights reserved.<br />
Permission to make digital or hard copies of part or all of this work for personal or classroom use<br />
is granted without fee provided that copies are not made or distributed for profit or commercial<br />
advantage and that copies bear this notice. Abstracting with credit is permitted, but copyrights<br />
for components of this work owned by others than COMAP must be honored. To copy otherwise,<br />
to republish, to post on servers, or to redistribute to lists requires prior permission from COMAP.
284 The UMAP Journal 26.3 (2005)<br />
Some models bridge the gap between the two kinds, including the gaskinetic<br />
model, which allows for individual driving behaviors to enter into a<br />
macroscopic view of traffic, much as ideal gas theory can examine individual<br />
particles and collective gas [Tampere et al. 2003].<br />
The tollbooth problem involves no steady speed, so macroscopic views may<br />
be tricky. On the other hand, bottlenecking is complex and tests microscopic<br />
ideas.<br />
An M|M|n queue seems appropriate at first: Vehicles arrive with gaps (determined<br />
by an exponential random variable) at n tollbooths, with service at<br />
each tollbooth taking an exponential random variable amount of time [Gelenbe<br />
1987]. We incorporate aspects of the situation from a small scale into a<br />
larger-scale framework.<br />
Properties of a Successful Model<br />
A successful toll-plaza configuration should<br />
• maximize efficiency by reducing customer waiting time;<br />
• suggest a reasonably implementable policy to toll plaza operators; and<br />
• be robust enough to handle efficiently the demands of a wide range of operating<br />
capacities.<br />
General Assumptions and Definitions<br />
Assumptions<br />
• All drivers act according to the same set of rules. Although the individual<br />
decisions of any given driver are probabilistic, the associated probabilities<br />
are the same for all drivers.<br />
• Bottlenecking downstream of the tollbooths does not hinder their operation.<br />
Vehicles that have already passed through a tollbooth may experience a<br />
slowing down due to the merging of traffic, but this effect is not extreme<br />
enough to block the tollbooth exits.<br />
• The number of highway lanes does not exceed the number of tollbooths.<br />
• All tollbooths offer the same service, and vehicles do not distinguish among<br />
them.<br />
• The amount of traffic on the highway is dictated by the number of lanes on<br />
the highway and not by the number of tollbooths. Changing the number of<br />
tollbooths does not affect “demand” for the roadway.<br />
• The number of operating tollbooths remains constant throughout the day.
Terms and Definitions<br />
The Booth Tolls for Thee 285<br />
• A “highway lane” is a lane of roadway in the original highway before and<br />
after the toll plaza.<br />
• Influx is the rate (in cars/min) of cars entering all booths of the plaza.<br />
• Outflux is the rate (in cars/min) of cars exiting all booths of the plaza.<br />
Optimization<br />
We seek to balance the cost of customer waiting time with toll plaza operating<br />
costs.<br />
• The daily cost C of a tollbooth is the total time value of the delays incurred<br />
for all individuals (driver plus any passengers) plus the cost of operation of<br />
the booth. The tolls and the startup cost of building the plaza are not part of<br />
this cost.<br />
• a is the average time-value of a minute for a car occupant.<br />
• γ is the average car occupancy.<br />
• N is the total number of (indistinct) tolls paid over the course of one day.<br />
• L is the number of lanes entering and leaving a plaza.<br />
• W is the average waiting time at a tollbooth, in minutes.<br />
• B is the number of booths in the plaza.<br />
• Q is the average daily operating cost of a human-staffed tollbooth.<br />
We seek a number of toolbooths B that minimizes cost C.<br />
The total waiting time per car is WN,sothe total cost incurred by waiting<br />
time is WaNγ. General human time-value is cited as $6/hour or a =$0.10/min<br />
[Boronico 1998]. The cost to operate a booth for a day is QB. The average<br />
annual operation cost for a human-staffed tollbooth is $180,000, so we set Q =<br />
$180000/365.25 days [Sullivan et al. 1994].<br />
Reasoning that W depends on B, wehave<br />
Car Entry Rate<br />
C(B) =WaNγ + QB.<br />
We fit a curve to mean hourly traffic-flow data from Boronico [1998]. To<br />
interpolate an influx rate for every minute during the day, we fit a Fourier<br />
series approximation, whose advantage is its periodicity, with period of one<br />
day. [EDITOR’S NOTE: We omit the table of data from Boronico [1998] and the<br />
17-term expression for the approximating series.]
286 The UMAP Journal 26.3 (2005)<br />
Model 1: Car-Tracking Without Bottlenecks<br />
Approach<br />
We seek an upper bound on the optimal number of booths for a particular<br />
number of lanes.<br />
Assumptions<br />
• Each vehicle is looking to get through the toll plaza as quickly as possible,<br />
and the only factor that may cause Car A, which arrives earlier than Car B,<br />
to leave later than B is the random variable of service time at a tollbooth. In<br />
other words, cars do not make bad decisions about their wait times<br />
• Customers are served at a tollbooth at a rate defined by an exponential<br />
random variable (a common assumption in queueing theory [Gelenbe 1987])<br />
with mean 12 s/vehicle, or 5 cars/min.<br />
• Traffic influx occurs on a “per lane” basis, meaning that influx per lane is<br />
constant over all configurations with varying number of lanes.<br />
• Bottlenecking occurs more frequently when there are more tollbooths, given<br />
a particular number of lanes. This implies that omitting bottlenecking from<br />
our model will cause us to overestimate the optimal number of tollbooths.<br />
• There exists a time-saving threshold such that if the waiting time saved by<br />
adding another tollbooth is under this threshold, it is not worth the trouble<br />
and expense to add the tollbooth. We assume that if an additional tollbooth<br />
does not reduce the maximum waiting time over all cars by the same amount<br />
as the average time that it takes to serve a car at a tollbooth (12 s=0.2m),<br />
then it is unnecessary.<br />
• An incoming car chooses the tollbooth that will be soonest vacated, if all are<br />
currently occupied. If only one is vacant, the car chooses that tollbooth. If<br />
multiple tollbooths are vacant, the car chooses the one vacated the earliest.<br />
• Cars make rational decisions with the goal of minimizing their wait times.<br />
Expectations of the Model<br />
• An additional booth should not increase waiting time.<br />
• Each additional tollbooth offers diminishing returns of time saved.
Development of Model<br />
The Booth Tolls for Thee 287<br />
Cars arrive at the toll plaza at a rate described by the Fourier series approximation<br />
of the data from Boronico [1998]. Cars are considered inside the toll<br />
plaza (meaning that we begin to tabulate their waiting times) when they are<br />
either being served or waiting to be served.<br />
Service time does not count as waiting time; so if a car enters the toll plaza<br />
and there is a vacant tollbooth, its waiting time is 0. If there are no vacant tollbooths,<br />
cars form a queue to wait for tollbooths, and they enter new vacancies<br />
in the order in which they entered the toll plaza. Once a car has been served, it<br />
is considered to have exited its tollbooth and the toll plaza as a whole.<br />
Our car-tracking model does not factor in the cost of tollbooth operation.<br />
Simulation and Results<br />
For L highway lanes, L ∈{1..8, 16},weran the simulation for numbers B of<br />
tollbooths up to a point where additional booths no longer have any noticeable<br />
effect on waiting time. We exhibit results for a 6-lane highway in Table 1.<br />
Table 1.<br />
Waiting times (in minutes) for six-lane simulations.<br />
Booths Ave. wait Ave. wait Max. wait Marginal utility<br />
for wait > 0<br />
6 28 43 99 N/A<br />
7 12 28 55 44<br />
8 6 17 32 23<br />
9 2 8 16 16<br />
10 0.25 1.22 2.78 13<br />
11 0.02 0.17 0.75 2<br />
12 0.004 0.07 0.31 0.44<br />
13 0.001 0.04 0.27 0.04<br />
The column “Marginal Utility” shows how much each additional booth<br />
reduces maximum waiting time. For the 13th booth, this value is 0.04 min. To<br />
choose an optimal number of booths by threshold analysis, we seek the first<br />
additional booth that fails to reduce the maximum waiting time for a car by at<br />
least the length of the average tollbooth service time (0.2 min). So, based on our<br />
assumptions, it is unnecessary to build a 13th tollbooth for a toll plaza serving<br />
6 lanes of traffic. Thus, we set B =12for L =6. Table 2 shows the optimal<br />
number of tollbooths for other various numbers of lanes.<br />
Table 2.<br />
Optimized number of booths.<br />
Lanes 1 2 3 4 5 6 7 8 16<br />
Booths 4 5 7 8 10 12 13 16 29
288 The UMAP Journal 26.3 (2005)<br />
We also explore the situation of one booth per lane. Regardless of the<br />
number of lanes, we find average wait times of around 30 min (over 40 min for<br />
cars that wait at all), and maximum wait time of around 100 min.<br />
Discussion<br />
Our results match our expectations. The optimal number of booths increases<br />
with the number of lanes, each additional booth reduces waiting time, and<br />
additional booths yield diminishing returns in reducing waiting time.<br />
The benefits of this rather simplistic model are its speed and the definite<br />
upper bounds that it offers.<br />
Model 2: Cost Minimization<br />
Approach<br />
This model is concerned less with the details of individual vehicular motion<br />
and decision-making than with the general aggregate effect of the motions of<br />
the cars. We monitor traffic over the course of one day.<br />
For instance, there is no need for this model to decompose analytically the<br />
situation of two cars trying to merge into the same lane. Instead, it recognizes<br />
that beyond a certain threshold of outflux from the booths, some bottlenecking<br />
will occur.<br />
Also, this model addresses the cost of daily operation of the plazas.<br />
Assumptions, Variables, and Terms<br />
• The average waiting time per car in the toll plaza, W ,iscomprised of time<br />
in line (W1), service time (W2), and bottlenecking (W3).<br />
• Fi (a function of time) is the influx (cars/min) to the plaza from one lane, Fo<br />
is the outflux (cars/min) from the booth.<br />
• r is the maximum potential service rate (cars/min).<br />
• There is an outflux barrier, K (cars/min), above which bottlenecking takes<br />
place. We take it to be linear in L and independent of B, and we call it the<br />
bottlenecking threshold.<br />
Development<br />
From the definitions, we have W2 =1/r. Both W1 and W3 depend on B.<br />
The average time in line, W1, begins to accumulate when the influx of traffic<br />
exceeds the toll plaza capacity (see Figure 1). The influx is LFi(t) and the
The Booth Tolls for Thee 289<br />
maximal rate of service is Br. Weintegrate over time to calculate how many<br />
cars were forced to wait in line.<br />
Figure 1. The area below the curve and above the line represents cars in line.<br />
Integrating again (over time) gives us the total waiting time for all those cars<br />
(with 3600 as a scale factor for time units), and dividing by the total number of<br />
cars gives the average waiting time:<br />
W1 = 3600<br />
24 t<br />
max<br />
N 0 0<br />
LFi(τ) − Br,0 dτdt.<br />
We obtain W3 in similar fashion:<br />
W3 = 3600<br />
24 t<br />
max<br />
N 0 0<br />
Fo(τ,B) − K, 0 dτdt.<br />
The problem is to determine the variable(s) that K depends on. First, K<br />
is not directly dependent on B, since bottlenecking should only be a result of<br />
general outflux from the booths into L lanes. Instead, K depends indirectly<br />
on the number of booths, because K depends on outflux Fo, which in turn<br />
depends on B. Also, K also can be considered a linear function of L, because<br />
L is directly proportional to influx, which, by the law of conservation of traffic,<br />
must equal outflux in the aggregate.
290 The UMAP Journal 26.3 (2005)<br />
Simulation and Results<br />
We use the same data and Fourier series for traffic influx as in Model 1. We<br />
focus our attention on the case L =6; other values are analogous.<br />
We use Mathematica to integrate numerically the expression for W1 for a<br />
given L and r =5cars/min. (N comes from integration of the influx expression.)<br />
We do the calculation for values of B ranging from L to L +7(since L +7<br />
is usually greater than the upper bound from Model 1) with step size 0.25. We<br />
fit a quartic polynomial fit to the resulting points (B,W1(B)) to get W1 as a<br />
function of B.<br />
We illustrate for L =6. We find N =92,355. We plot W1 for values of B<br />
from 6 to 13, in steps of 0.25, together with the best-fit quartic, in Figure 2.<br />
Figure 2. W1(B) for B ranging from 6 to 13 (actual points with quartic fit).<br />
The recipe for W3(B) is somewhat less straightforward, since Fo(t) is generated<br />
from a stochastic distribution, unlike the deterministic Fi(t). Also, Fo(t)<br />
depends on B,asignificant complication. We ran at least 20 trials of each case<br />
(L, B) under the first model; the averaged outcomes of their outflux functions<br />
are the function that we use for outflux in this model’s simulation, henceforth<br />
referred to just as Fo(t, B).<br />
We use surface-fitting software (Systat’s TableCurve3D) togenerate an expression<br />
for outflux as a function of time and the number of booths and use<br />
this expression in the compound integral for W3 in integrating numerically.<br />
As before, we generate a scatter plot of points (B,W3(B)) and fit a quartic<br />
polynomial.<br />
The values of R 2 for the surface fits all fall between .84 and .95, which are<br />
acceptable values. All of the quartic fits have R 2 near 1.<br />
For the case L =6, Figure 3 shows the surface fit and Figure 4 shows the<br />
function W3.<br />
With W3 a quartic polynomial in B, minimization via calculus yields a<br />
solution. For 6 lanes, Mathematica’s numeric solver gives the minimum at<br />
B =10.84. Values for various numbers of lanes are summarized in Table 3.
Outflux<br />
60<br />
50<br />
40<br />
30<br />
20<br />
10<br />
0<br />
12<br />
Booths<br />
11<br />
10<br />
9<br />
8<br />
7<br />
6<br />
0<br />
5<br />
10<br />
The Booth Tolls for Thee 291<br />
Outflux (cars/min) -- 6 Lane<br />
Rank 4 Eqn 317016996 z^(-1)=a+bx^(1.5)+cx^2+dx^2lnx+ex^(2.5)+fx^3+ge^(x/wx)+h/lny<br />
r^2=0.89795631 DF Adj r^2=0.89349539 FitStdErr=3.5049628 Fstat=231.30704<br />
a=-220.32191 b=-2.9096518 c=1.5952541 d=-0.63655404<br />
e=0.23714718 f=-0.0079954663 g=220.43421 h=0.010602912<br />
15<br />
Time<br />
Figure 3. L =6: Surface fit for outflux function in terms of time (h) and number of booths.<br />
Figure 4. L =6: Plot of W3(B) for B ranging from 6 to 13 (actual points plus quartic fit).<br />
Table 3.<br />
Optimized number of booths—final recommendations from Model 2.<br />
Lanes 1 2 3 4 5 6 7 8 16<br />
Booths 3 5 6 7 9 11 12 14 27<br />
20<br />
50<br />
40<br />
30<br />
20<br />
10<br />
0<br />
60<br />
Outflux
292 The UMAP Journal 26.3 (2005)<br />
Discussion<br />
This model calculates total waiting time for drivers based on general ideas<br />
of traffic flow. The results are reasonable and satisfy many of our expectations<br />
for a successful model. The recommended B-values increase monotonically<br />
with L and are all less than the upper bounds produced in Model 1. One booth<br />
per lane is nowhere near optimal, because (as we can see from the graphs of<br />
W1 and W3), while bottlenecking is zero, waiting time in line is much higher,<br />
thus diminishing the effect of bottlenecking.<br />
Given the model’s success, it may be disheartening to acknowledge its lack<br />
of robustness. Any adjustments to fine-scale aspects of traffic, such as the<br />
addition of a potential E-ZPass lane (to be discussed later), would be impossible<br />
to implement. Perhaps the rate of service r could be adjusted higher for such a<br />
scenario, but changing lanes before the tollbooths would be difficult to capture<br />
with this model.<br />
Model 3: Cellular Automata<br />
Motivation<br />
What effect does the discreteness of traffic have on the nature and solution<br />
of the problem? A continuous model of traffic may neglect the very factors that<br />
give rise to traffic congestion and jamming. To address this possibility, we turn<br />
to cellular automata theory to develop a discrete, microscopic model.<br />
Approach<br />
Each cell is designated as a vehicle, a vacancy, or a barrier to traffic flow. The<br />
model follows individual vehicles through the plaza and computes the waiting<br />
time for each. The total waiting time measures the plaza’s efficiency.<br />
In any particular time step, a vehicle advances, changes lanes, or sits still.<br />
Vehicles enter the plaza from a stretch of road containing a specific number<br />
of lanes. As a vehicle approaches the string of tollbooths, the road widens<br />
to accommodate the booths (given that there are more tollbooths than lanes).<br />
There is a specific delay associated with using a tollbooth. Once a vehicle leaves<br />
a booth, it merges into a roadway with the original number of lanes.<br />
Assumptions<br />
• The plaza consists of occupied cells, vacant cells, and “forbidden” cells.<br />
• Cells represent a physical space that accommodates a standard vehicle with<br />
buffer regions on both sides.<br />
• All vehicles are the same size.
Governing Dynamics<br />
The Booth Tolls for Thee 293<br />
Cars move through the toll plaza according to rules. Each vehicle has options,<br />
each with an associated probability. For each time step, the following<br />
rules are applied in sequential order:<br />
1. Starting at the front of the traffic and moving backward (with respect to the<br />
flow), vehicles advance to the cell directly in front of them with probability<br />
p; ifthe next cell is not vacant, the vehicle does not advance and is flagged.<br />
This probability is meant to simulate the stop-and-go nature of slowly moving<br />
traffic. We can think of p as a measure of driver attentiveness; p =1<br />
corresponds to the case where drivers are perfectly attentive and move forward<br />
at every opportunity, while p =0represents the extreme case where<br />
drivers have fallen asleep and fail to move forward at all.<br />
2. Using an influx distribution function, the appropriate number of new vehicles<br />
is randomly assigned to lanes at the initial boundary (see next section).<br />
3. Starting at the front of traffic and moving backward, vehicles flagged in<br />
step 1 are given the opportunity to switch lanes. For each row of traffic,<br />
the priority order for switching is determined by a random permutation of<br />
lanes. Switching is attempted with probability q. Ifswitching is attempted,<br />
left and right merges are given equal probability to be attempted first. If<br />
a merge in one direction (i.e. left or right) is impossible (meaning that the<br />
adjacent cell is not vacant), then the other direction is attempted. If both<br />
adjacent cells are unavailable, the vehicle is not moved.<br />
4. Total waiting time for the current time step is computed by determining the<br />
number of cells in the system containing a vehicle.<br />
5. The number of vehicles advancing through the far boundary (end of the<br />
simulation space) are tabulated and added to the total output. This number<br />
is later used to confirm conservation of traffic.<br />
Population Considerations<br />
The Fourier series for daily influx distribution of cars is still valid for the<br />
automata model, but the influx values must be scaled to reflect the effective<br />
influx over a much smaller time interval (a single time step). The modified<br />
influx function, Fin,iscomputed as follows:<br />
<br />
Fin(t)<br />
Fin(τ) =min ,L ,<br />
η<br />
where η is a constant factor required for the conversion from units of t to those<br />
of τ and L is the number of initial travel lanes.
294 The UMAP Journal 26.3 (2005)<br />
Computing Wait Time<br />
Wait time is determined by looking through the entire matrix at each time<br />
step and noting the number of cells with positive values. The only cells containing<br />
positive values are those representing vehicles. Thus, by counting the<br />
number of vehicles in the plaza at any given time, we are also counting the<br />
amount of time spent by vehicles in the plaza (in units of time steps).<br />
At time step i, total cumulative waiting time is computed as follows:<br />
Wi = Wi−1 +1 plaza(x, y) > 0 ,<br />
where 1() denotes an indicator function and plaza denotes the matrix of cells.<br />
Simulation and Results<br />
The cost optimization method defines total cost as<br />
Ctotal = αγNW (B,L)+BQ.<br />
Using the cellular automata model, we compute waiting time as a function<br />
of both the number of lanes and the number of tollbooths. For fixed L, we<br />
compare all values of Ctotal and choose the lowest one. The results are presented<br />
in Table 4.<br />
Table 4.<br />
Optimization for cellular automata model.<br />
Optimal number of booths<br />
Highway lanes Typical day Rush hour<br />
1 1 2<br />
2 4 4<br />
3 5 6<br />
4 7 7<br />
5 8 9<br />
6 10 11<br />
7 12 13<br />
8 14 15<br />
16 27 29<br />
Each value in Table 4 represents approximately 20 trials. Through these<br />
trials, we noted a remarkable stability in our model. Despite the stochastic<br />
nature of our algorithm, each number of lanes was almost always optimized<br />
to the same number of tollbooths. There were a handful of exceptions; they<br />
occurred exclusively for small numbers of highway lanes (< 3 lanes).<br />
Sensitivity Analysis<br />
Our cellular automata model is relatively insensitive to both p and q. Changes<br />
of ±11% in p and ±5.2% in q have no effect on the optimal number of tollbooths
The Booth Tolls for Thee 295<br />
for a six-lane highway. On the other hand, increasing the delay time by 25%<br />
shifts the optimal number of booths from 10 to 11 (10%). Decreasing the delay<br />
by 25% has no effect on the solution. Perhaps additional work could lead to<br />
an elucidation of the relation between delay and optimal booth number that<br />
could help stabilize the cellular automata model.<br />
Comparison of Results from the Models<br />
Table 5 show the optimal number of booths.<br />
Table 5.<br />
Comparison of final recommendations for three models.<br />
Model<br />
Lanes Car-tracking Macroscopic Automata<br />
1 4 3 2<br />
2 5 5 4<br />
3 7 6 5<br />
4 8 7 7<br />
5 10 9 8<br />
6 12 11 10<br />
7 13 12 12<br />
8 16 14 14<br />
16 29 27 27<br />
The car-tracking model serves as an upper bound for the optimal number of<br />
booths, due to its omission of bottlenecking, a fact confirmed in the table. The<br />
cellular automata model, on the other hand, incorporates bottlenecking. Due<br />
to its examination of each car and each period waited, we lean more toward the<br />
cellular automata model for a determination of the optimal number of booths<br />
that is more accurate than those of the other two models.<br />
The optimal values for each model are fit very well (r 2 >.996)byastraight<br />
line, with slopes between 1.6 and 1.7.<br />
Conclusion<br />
We use three models—the car-tracking model, the macroscopic model for<br />
total cost minimization, and the cellular automata model—to determine the<br />
optimal (per our definition) number B of tollbooths for a toll plaza of L lanes.<br />
The car-tracking model uses a simple orderly lineup of cars approaching<br />
tollbooths and ignores bottlenecking after the tollbooths; it provides a strong<br />
upper bound on B for any given L.<br />
The macroscopic model looks at the motion of traffic as a whole. It tabulates<br />
waiting time in line before the tollbooths by considering times when<br />
traffic influx into the toll plaza is greater than tollbooth service time. It also
296 The UMAP Journal 26.3 (2005)<br />
finds bottlenecking time by assuming there exists a threshold of outflux, above<br />
which bottlenecks will occur, and notices when outflux is greater than said<br />
threshold. This is a much more accurate model than the Car-Tracking Model,<br />
and it provides us with reasonable solutions for B in terms of L.<br />
The cellular automata model looks at individual vehicles and their “per lane<br />
length” motion on a toll plaza made up of cells. With a probabilistic model of<br />
how drivers advance and change lanes, this model details far better than the<br />
other models the waiting time in line and the bottlenecking after the tollbooths.<br />
Thus, we recommend values closer to those provided by the automata<br />
model than the macroscopic one. In order to write B explicitly in terms of<br />
L, weinvoke the linearity of the results. Also, to preserve integral values for<br />
B,weuse the floor function and determine that<br />
B = ⌊1.65L +0.9⌋.<br />
Potential Extension and Further Consideration<br />
Our models assume that all booths are identical. However, systems such as<br />
E-ZPass allow a driver to pay a toll electronically from an in-car device without<br />
stopping at a tollbooth. If all E-ZPass booths also double as regular telleroperated<br />
booths, much of our models remain the same, except that the average<br />
service rate might increase. The trouble comes when all the booths are not<br />
the same and drivers may need to change lanes upon entering the plaza. This<br />
directed lane changing was not implemented in any of the models presented<br />
here, but could easily become a part of the automata model. Exclusive E-ZPass<br />
booths also would drastically reduce the operating cost for the booth, since an<br />
operator’s salary would not need to be paid (from $16,000 to $180,000 annually)<br />
[Sullivan 1994].<br />
References<br />
Boronico, Jess S., and Philip H. Siegel. Capacity planning for toll roadways<br />
incorporating consumer wait time costs. Transportation Research A (May<br />
1998) 32 (4): 297–310.<br />
Daganzo, C.F., et al. 1997. Causes and effects of phase transitions in highway<br />
traffic. ITS Research Report UCB-ITS-RR-97-8 (December 1997).<br />
Gartner, Nathan, Carroll J. Messer, and Ajay K. Rathi. 1992. Traffic Flow Theory:<br />
A State of the Art Report. Revised monograph. Special Report 165. Oak<br />
Ridge, TN: Oak Ridge National Laboratory. http://www.tfhrc.gov/its/<br />
tft/tft.htm .<br />
Gelenbe, E., and G. Pujolle. 1987. Introduction to Queueing Networks. New York:<br />
John Wiley & Sons.
The Booth Tolls for Thee 297<br />
Jost, Dominic, and Kai Nagel. 2003. Traffic jam dynamics in traffic flow models.<br />
Swiss Transport Research Conference. http://www.strc.ch/Paper/jost.<br />
pdf . Accessed 4 February 2005.<br />
Kuhne, Reinhart, and Panos Michalopoulos. 1992. Continuum flow models.<br />
Chapter 5 in Gartner et al. [1992].<br />
Schadschneider, A., and M. Schreckenberg. Cellular automaton models and<br />
traffic flow. Journal of Physics A: Mathematical and General (1993) 26: L679–<br />
L683.<br />
Sullivan, R. Lee. Fast lane. Forbes (4 July 1994) 154: 112–115.<br />
Tampere, Chris, Serge P. Hoogendoorn, and Bart van Arem. Capacity funnel<br />
explained using the human-kinetic traffic flow model. http://www.<br />
kuleuven.ac.be/traffic/dwn/res2.pdf . Accessed 4 February 2005.<br />
Matthew Mian, William G. Mitchener (advisor), Pradeep Baliga, and Adam Chandler.
298 The UMAP Journal 26.3 (2005)
A Single-Car Interaction Model 299<br />
A Single-Car Interaction Model of<br />
Traffic for a Highway Toll Plaza<br />
Ivan Corwin<br />
Sheel Ganatra<br />
Nikita Rozenblyum<br />
Harvard University<br />
Cambridge, MA<br />
Advisor: Clifford H. Taubes<br />
<strong>Summary</strong><br />
We find the optimal number of tollbooths in a highway toll-plaza for a<br />
given number of highway lanes: the number of tollbooths that minimizes average<br />
delay experienced by cars.<br />
Making assumptions about the homogeneity of cars and tollbooths, we create<br />
the Single-Car Model, describing the motion of a car in the toll-plaza in<br />
terms of safety considerations and reaction time. The Multi-Car Interaction<br />
Model, a real-time traffic simulation, takes into account global car behavior<br />
near tollbooths and merging areas.<br />
Drawing on data from the Orlando–Orange Country Expressway Authority,<br />
we simulate realistic conditions. For high traffic density, the optimal number<br />
of tollbooths exceeds the number of highway lanes by about 50%, while<br />
for low traffic density the optimal number of tollbooths equals the number of<br />
lanes.<br />
Definitions and Key Terms<br />
• A toll plaza with n lanes is represented by the space [−d, d] ×{1,...,n},<br />
where members of the set {0} ×{1,...,n} are called tollbooths and d is<br />
called the radius of the toll plaza. Denote the tollbooth {0}×{i} by τi. The<br />
subspace [−d, 0) ×{1,...,n} is known as the approach region and (0,d] ×<br />
{1,...,n} is known as the departure region.<br />
The UMAP Journal 26 (3) (2005) 299–315. c○Copyright 2005 by COMAP, Inc. All rights reserved.<br />
Permission to make digital or hard copies of part or all of this work for personal or classroom use<br />
is granted without fee provided that copies are not made or distributed for profit or commercial<br />
advantage and that copies bear this notice. Abstracting with credit is permitted, but copyrights<br />
for components of this work owned by others than COMAP must be honored. To copy otherwise,<br />
to republish, to post on servers, or to redistribute to lists requires prior permission from COMAP.
300 The UMAP Journal 26.3 (2005)<br />
• A highway/toll plaza pair is represented by the space H = (−∞,d) ×<br />
{1,...,m}∪[−d, d] ×{1,...,n}∪(d, ∞) ×{1,...,m}, where the toll plaza<br />
is (as above) the subspace [−d, d] ×{1,...,n} and the stretches of highway<br />
are the subspaces (−∞,d) ×{1,...,m} and (d, ∞) ×{1,...,m}. Elements<br />
of the sets {1,...,m} and {1,...,n} are highway lanes and tollbooth lanes<br />
respectively, and elements of R are highway positions. Inpractice, we take<br />
m ≥ n.<br />
• The fork point of a highway/toll plaza pair, given by the highway position<br />
−d, isthe point at which highway lanes turn into toll lanes. Similarly, the<br />
merge point of a highway/toll plaza pair, given by the highway position d,<br />
is the point at which toll lanes turn back into highway lanes (Figure 1).<br />
m lanes<br />
Fork point n tollbooths<br />
Merge Point<br />
Tollbooth line<br />
Merging<br />
Queue<br />
-d 0<br />
d<br />
Traffic Flow<br />
Figure 1. A depiction of the highway/toll plaza pair.<br />
• A car C is represented by a 4-tuple (L, a+, a−, abrake) and a position function<br />
p =(x, k) :R → H where x(t) is smooth for all t. Here, x(t) gives the highway<br />
position of the front tip of C and k(t) is the (tollbooth or highway) lane<br />
number of C. Let L be the length of C in meters, a+ the constant comfortable<br />
positive acceleration, a− the constant comfortable brake acceleration,<br />
and abrake the maximum brake acceleration. At a fixed time, the region of<br />
H in front of C is the portion of H with greater highway position than C,<br />
while the rear of C is the region of H with highway position at most the<br />
position of C minus L.<br />
• The speed limit vmax of H is the maximum speed at which any car in H can<br />
travel.<br />
• The traffic density ρ(t) of H at time t is the average number of cars per lane<br />
per second that would pass highway position 0 if there were no toll plaza.<br />
• The average serving rate s of tollbooth τi is the average number of cars that<br />
can stop at τi, pay the toll, and leave, per second.
Table 1.<br />
Variables, definitions, and units.<br />
A Single-Car Interaction Model 301<br />
Variable Definition Units<br />
n Number of tollbooths unitless<br />
ρ Traffic density cars/s<br />
T Total delay time s<br />
x Position m<br />
v Velocity m/s<br />
xo Position of initial deceleration m<br />
to Time of initial deceleration s<br />
xf Position upon returning to speed limit m<br />
tf Time upon returning to speed limit s<br />
x1 Position of car C m<br />
x2 Position of car C ′ m<br />
v1 Velocity of car C m/s<br />
v2 Velocity of car C ′ m/s<br />
x ′ 1 Position of car C after time step m<br />
x ′ 2 Position of car C ′ after time step m<br />
v ′ 1 Velocity of car C after time step m/s<br />
v ′ 2 Velocity of car C ′ after time step m/s<br />
G Safety gap m<br />
G ′ Safety gap after time step m<br />
t Time s<br />
t ′ Additional time s<br />
αC Compensation deceleration from car/safety gap overlap m/s 2<br />
αO Compensation deceleration from obstacle/safety gap overlap m/s 2<br />
x Position m<br />
v Velocity m/s<br />
ci Size of tollbooth line i cars<br />
li Length of tollbooth line i m<br />
tserve Time C enters departure area s<br />
tmerge Time C upon passing merge point s<br />
vout Velocity of a car C upon passing merge point s<br />
Table 2.<br />
Constants, definitions, and units.<br />
Constant Meaning Units<br />
d toll plaza radius m<br />
m Number of highway lanes unitless<br />
a+ Comfortable acceleration m/s 2<br />
a+ Comfortable deceleration m/s 2<br />
a brake Hard brake deceleration m/s 2<br />
L Car length m<br />
vmax Speed limit m/s<br />
s Mean serving rate cars/s<br />
σ Standard deviation of serving time s/car<br />
∆t Expected reaction time s<br />
γ Unexpected reaction time s<br />
ɛ Line spacing distance m
302 The UMAP Journal 26.3 (2005)<br />
General Assumptions<br />
Time<br />
• Time proceeds in discrete time steps of size ∆t.<br />
Geometry of the Toll Plaza<br />
• The highway is straight and flat and extends in an infinite direction before<br />
and after the toll plaza. The highway is obstacle-free with constant speed<br />
limit vmax. The assumption of infinite highway is based on toll plazas being<br />
far enough apart that traffic delays at one toll plaza don’t significantly affect<br />
traffic at an adjacent one.<br />
• A car’s position is determined uniquely by a lane number and a horizontal<br />
position. Thus, on a stretch of road with m operating lanes, the position of<br />
a car is given by the ordered pair (x, i) ∈ R ×{1,...,m}.<br />
Tollbooths and Lines<br />
• A car comes to a complete stop at a tollbooth.<br />
• The time required to accelerate and decelerate to move up a position in a<br />
waiting line is less than the serving time of the line. Thus, average time<br />
elapsed before exiting a line is simply a function of average serving time<br />
and line length measured in cars.<br />
• A car cannot enter a tollbooth until the entire length of the car in front of it<br />
has left the tollbooth.<br />
• All tollbooths have the same normally distributed serving time with mean<br />
1/s and standard deviation σ.<br />
Fork and Merge Points<br />
• Transitions between the highway and tollbooth lanes are instantaneous.<br />
• When transitioning at the fork point into a tollbooth lane, cars enter the lane<br />
with the shortest tollbooth lines.<br />
• There is no additional delay associated with the division of cars into tollbooths.<br />
• The process of transitioning at the merge points from the tollbooth lanes,<br />
called merging, does incur delay due to bottlenecking because we assume<br />
that there are at least as many tollbooth lanes as highway lanes.
Optimality<br />
A Single-Car Interaction Model 303<br />
Measures of optimality for a toll include having minimal average delay,<br />
standard deviation of average delay, accident rate, and proportion of cars delayed<br />
[Edie 1954]. We assume that optimality occurs when cars experience<br />
minimal average delay. Specifically, for a car C, let xo, to be the position and<br />
time at which C first decelerates from the speed limit to enter the tollbooth line,<br />
and let xf ,tf be time and position at which, having merged onto the highway<br />
once more, C reaches the speed limit. Then the delay T experienced by the<br />
car, or the time cost associated with passing through the toll plaza instead of<br />
travelling unhindered, is given by<br />
T = tf − to − xf − xo<br />
. (1)<br />
vmax<br />
We secondarily prefer toll plaza configurations with minimal construction and<br />
operating cost, i.e., toll plaza configurations with fewer tollbooths. Specifically,<br />
for a given highway, if two values of n (the number of tollbooths) give sufficiently<br />
close average delay times (say, within 1 s), we prefer the lower n.<br />
We rephrase the problem as follows:<br />
Given a highway configuration with m lanes and a model of traffic density, what<br />
is the least number of tollbooth lanes n that minimizes the average delay (within<br />
1s)experienced by cars travelling through the tollbooth?<br />
Expectations of Our Model<br />
• For sufficiently low traffic density, the delay time per car is relatively constant<br />
and near the theoretical minimum, because the tollbooth line does not<br />
grow and there are no merging difficulties. We expect that for low density the<br />
optimal number of tollbooths equals or slightly exceeds the number of lanes.<br />
• For high traffic density, the delay time per car is very large and continues to<br />
grow, because the tollbooth queue is unable to move fast enough to handle<br />
the influx of cars; waiting time increases approximately linearly in time. We<br />
expect that for high density, the optimal number of tollbooths significantly exceeds<br />
the number of lanes.<br />
• An excessive number of tollbooths leads to merging inefficiency, causing<br />
great delay in the departure region.
304 The UMAP Journal 26.3 (2005)<br />
The Single-Car Model<br />
Additional Definitions and Assumptions<br />
• An obstacle for a car C is a point in the highway/toll plaza pair which C<br />
must slow down to avoid hitting. The only obstacle that we consider is the<br />
merge point under certain conditions.<br />
• At a fixed time, the closest risk to a car C is the closest obstacle or car in<br />
front of C.<br />
• The unexpected reaction time γ is the amount of time a car takes between<br />
observing an unexpected occurrence ( a sudden stop) and physically reacting<br />
(braking, accelerating, swerving, etc.). The expected reaction time<br />
∆t is the amount of time between observing an expected occurrence (light<br />
change, car brake, tollbooth) and physically reacting.<br />
• Cars are homogeneous; that is, all have the same L, a+,a−, and abrake.<br />
• All cars move in the positive direction.<br />
• All cars observe the speed limit vmax. Moreover, unless otherwise constrained,<br />
a car travels at this speed or accelerates to it. In particular, outside<br />
a sufficiently large neighborhood of the toll plaza, all cars travel at vmax.<br />
• Cars accelerate and decelerate at constant rates a+ and a− unless otherwise<br />
constrained.<br />
• Cars do not attempt to change lanes unless at a fork or merge point. That<br />
is to say, for a car C, k(t) is piecewise constant, changing only at t such that<br />
x(t) =−d or d.<br />
• A car C prefers to keep a certain quantity of unoccupied space between its<br />
front and its closest risk, of size such that if C were to brake with maximum<br />
deceleration, abrake, C would always be able to stop before reaching its closest<br />
risk [Gartner et al. 1992, §4]. We refer to this quantity as the safety gap<br />
G. Given the position of a car C, the position corresponding to distance G<br />
in front of C is the safety position with respect to C. Ifthe safety position<br />
with respect C does not overlap the closest risk, we say C is unconstrained.<br />
• A car can accurately estimate the position and velocity of itself and of the<br />
car directly in front of it and its distance from the merging point.<br />
• If a car C comes within a sufficiently small distance ɛ of a stopped car, C<br />
stops. This minimum distance ɛ is constant.<br />
• For each car, there is a delay, the reaction time, between when there is a need<br />
to adjust acceleration and when acceleration is actually adjusted. Green<br />
[2000] splits reaction times into three categories; the ones relevant to us are
A Single-Car Interaction Model 305<br />
expected reaction time ∆t and unexpected reaction time γ, which are defined<br />
above. Although these times vary with the individual, we make the<br />
simplifying assumption that all cars have the same values, ∆t = 1sand γ =<br />
2s.Reaction times provide a motivation for discretizing time with time step<br />
∆t; drivers simply do not react any faster.<br />
The Safety Gap<br />
We develop an expression for the safety gap G of car C, which depends on<br />
the speed of the closest risk C ′ . Let the current speeds of C and C ′ be v1 and<br />
v2. Now suppose that C ′ brakes as hard as possible and thus decelerates at<br />
rate abrake. Intime v2/abrake, car C ′ stops; meanwhile it travels distance<br />
v2<br />
v2<br />
abrake<br />
− 1<br />
2abrake 2 v2<br />
=<br />
abrake<br />
v2 2<br />
.<br />
2abrake<br />
If C starts braking after a reaction time of γ,ittakes total time γ + v1/abrake<br />
to stop and travels distance<br />
γv1 + v2 1<br />
.<br />
2abrake<br />
Thus, in the elapsed time, the distance between C and C ′ decreases by<br />
γv1 + v2 1 − v2 2<br />
.<br />
2abrake<br />
Therefore, this must be the minimum distance between the front of C and the<br />
back of C ′ in order to avoid collision. Accounting for the length of C ′ , the<br />
minimum distance between C and C ′ , and thus the safety gap, must be<br />
G = L + γv1 + v2 1 − v2 2<br />
.<br />
2abrake<br />
Now suppose that the closest risk is an obstacle, in particular the merge<br />
point. Rather than braking with deceleration abrake, C will want to keep a<br />
safety gap that allows for normal deceleration of a−. Because deceleration<br />
on approach is expected, C will opt to decelerate at a comfortable rate, a−.<br />
Moreover, since C is reacting to an expected event, the reaction time is given<br />
by ∆t. Since the length and velocity of the obstacle are both 0, the safety gap<br />
must be<br />
Individual Car Behavior<br />
G =∆tv1 + v2 1<br />
.<br />
2a−<br />
An individual car C can be in one of several positions:
306 The UMAP Journal 26.3 (2005)<br />
• No cars or obstacles are within its safety gap, that is, C is unrestricted. Consequently,<br />
C accelerates at rate a+ unless it has velocity vmax.<br />
• The tollbooth line is within braking distance. Since this is an expected occurrence,<br />
the car brakes with deceleration a−.<br />
• Another car C ′ is within its safety gap, so C reacts by decelerating at some<br />
rate αC so that in the next time step, C ′ is no longer within the safety gap.<br />
C chooses αC based on the speeds v1,v2 and positions x1,x2 of both cars. If<br />
C assumes that C ′ continues with the same speed, then after one time step<br />
∆t the new positions and speeds are<br />
and the new safety gap is<br />
x ′ 1 = x1 + v1∆t − 1<br />
2 αC(∆t) 2 ,x ′ 2 = x2 + v2∆t,<br />
v ′ 1 = v1 − αC∆t,v ′ 2 = v2,<br />
G ′ = γv ′ 1 + v′2 1 − v ′2<br />
2<br />
.<br />
2abrake<br />
For the new position of C2 to not be within the new safety gap, we must<br />
have<br />
x ′ 2 − x ′ 1 − L = G ′ .<br />
Substituting into this equation, we find:<br />
x2 + v2∆t − v1∆t + 1<br />
2αC(∆t) 2 − L = γv1 − γαC∆t + (v1 − αC∆t) 2 − v2 2<br />
2abrake<br />
Solving this equation for αC and taking the root corresponding to the situation<br />
that C trails C ′ ,wefind that<br />
cαC = 1<br />
<br />
∆tabrake<br />
∆t 2<br />
− 1<br />
2<br />
+ v1 + γabrake<br />
2<br />
[(∆t) − 4v1∆tabrake +4∆ta 2 2<br />
brakeγ +(2γabrake)<br />
+8(x2 − x1)abrake +8v2∆tabrake − 8Labrake +4v 2 2<br />
1 <br />
2 .<br />
• The merge point is within its safety gap. The safety gap equation differs<br />
from the car-following case by using a− instead of abrake and ∆t instead<br />
of γ and by leaving out the L. Therefore, by the same argument as in the<br />
previous paragraph, the deceleration is<br />
αo = 1<br />
<br />
v1 +<br />
∆t<br />
3∆ta−<br />
2<br />
<br />
(∆t) 2 − 4v1∆ta− +8(∆t) 2a2 − +8(x2− x1)+8v2∆ta− +4v2 <br />
2 .<br />
− 1<br />
2<br />
.
A Single-Car Interaction Model 307<br />
Finally, once we have determined the new acceleration α of C, wecan<br />
change its position and velocity for the next time step as follows (letting<br />
x, v and x ′ ,v ′ be the old and new position and velocity respectively):<br />
Calculating Delay Time<br />
v ′ = v + α∆t, x ′ = x + v∆t + 1<br />
2 α∆t2 .<br />
We calculate the delay time T for a car C moving through a toll plaza by<br />
breaking the process into several steps, tracing the car as soon as it starts slowing<br />
down before passing through the tollbooth, and until it merges back into a<br />
highway lane and accelerates to the speed limit.<br />
Recalling our assumptions that cars do not change lanes, that they are<br />
evenly distributed among the lanes, and that there is no time loss associated<br />
with the distribution of cars into tollbooth lane at the fork point, we find that<br />
the period of approach to a tollbooth can be broken down as follows:<br />
• Deceleration from speed limit to stopping. We assume that a car comes to<br />
a complete stop upon joining a tollbooth line as well as upon reaching the<br />
tollbooth. Therefore, the first action taken by a car approaching a toll plaza<br />
is to decelerate to zero; at constant deceleration a−,ittakes time vmax/a− to<br />
go from the speed limit to zero, over distance v 2 max/2a−.<br />
• Line Assignment. As a car approaches the toll plaza, it is assigned to the<br />
currently shortest line. Let ci be the number of cars in line i. The cars<br />
are spaced equidistantly throughout the line with distance ɛ between cars.<br />
Thus, as long as the length of the line is less than d, wehave that the length<br />
of the line is li = ci(L+ɛ), where L is the length of a car. Now, if ci(L+ɛ) >d,<br />
then the line extends to before the fork area, where there are m lanes instead<br />
of n. Assuming that the line lengths are roughly the same, increasing the<br />
minimum line length by one car increases the total number of cars by about<br />
n, and therefore each of the m lanes has an additional n/m cars. It follows<br />
that<br />
<br />
ci(L + ɛ), if ci(L + ɛ)
308 The UMAP Journal 26.3 (2005)<br />
– Once C enters the departure area, it accelerates forward until either another<br />
car or the merge point enters its safety gap.<br />
– If another car C ′ enters the safety gap of C, C slows down and follows<br />
C ′ until C ′ merges, at which time the merge point will overlap the safety<br />
gap of C.<br />
– When the safety position of C reaches the merge point, if C does not<br />
have right of way, C will slow down so as to prevent the merge point<br />
from overlapping the safety gap, treating the merge point as an obstacle.<br />
This is in order to allow other cars who have already begun to merge,<br />
to do so until C can merge.<br />
– Upon having the right of way, C merges and accelerates unconstrained<br />
from the departure region until reaching the speed limit. Let tmerge be<br />
the time at which C merges and vout be its speed at that time. Then<br />
tf = tmerge + vmax − vout<br />
,<br />
a+<br />
vmax − vout<br />
xf = d + vout<br />
a+<br />
Thus by (1), the delay experienced by C is<br />
T = tmerge − tline − li(tline)+d<br />
vmax<br />
+ vmax − vout<br />
a+<br />
+ (vmax − vout) 2<br />
.<br />
2a+<br />
− 3vmax<br />
2a−<br />
The Multi-Car Interaction Model<br />
− vout(vmax − vout)<br />
.<br />
a+vmax<br />
We now determine the average delay time for a group of cars entering the<br />
toll plaza over a period of time. We simulate a group of cars arriving as per<br />
an arrival schedule and average their respective delay times. There are two<br />
complications: determining the arrival schedule (the distribution of individual<br />
cars over which to average) and the two variables tmerge and vout (used in the<br />
delay-time formula above).<br />
To determine computationally the average delay time, we must use the<br />
traffic density function ρ(t) to produce a car arrival schedule. We create the<br />
arrival schedule by randomly assigning arrival times based on ρ. Using this<br />
schedule, we determine which cars begin to slow down for a given time step.<br />
Unfortunately this task is not as straightforward as determining whether a<br />
car’s arrival time is less than the present time step. The arrival schedule provides<br />
the time a car reaches 0 (on the highway) if unconstrained. We wish to<br />
know when a car reaches a certain distance from the tollbooth line. Essentially<br />
given that a car would be at a set position (say 0 for the tollbooth) at time<br />
t, weseek the time t ′ when that car would have passed the front of the tollbooth<br />
line. This reduces to a question of Galilean relativity and we find that
A Single-Car Interaction Model 309<br />
t ′ = t − li(t)/vmax. Now, up to knowing li(t), wecan exactly determine when<br />
cars join the tollbooth lines. We use (2) and the difference equation for car flow<br />
∆ci<br />
∆t<br />
m<br />
=<br />
n ρ<br />
<br />
t − li<br />
<br />
− si<br />
vmax<br />
to keep track of the length of the tollbooth line, increasing it as cars join and<br />
decreasing it as cars are served.<br />
As a car’s arrival time (adjusted to the line length) is reached, we immediately<br />
assign it to the current shortest tollbooth line. We introduce normally<br />
distributed serving times with mean 1 (where s is serving rate) and standard<br />
s<br />
deviation σ that we assume to be 1<br />
6s .<br />
The second consideration in simulating many cars is how to determine<br />
tmerge and vout for each car. Our time-stepping model allows us to recursively<br />
update every car and thus to determine the actions of a single car at each time<br />
step. Following the rules in the previous section, we know exactly when and<br />
how much to accelerate (a+) and decelerate (αc, αo). Furthermore, we observe<br />
that when a car that is first in its tollbooth lane approaches the merge point, it<br />
joins a merging queue (with at most n members). The only time when a car (on<br />
the merging queue) does not treat the queue as an obstacle (and consequently<br />
slow down) is when a highway lane clears and the car is taken from the queue<br />
and allowed to accelerate across the merge point and into free road. A lane is<br />
clear once the car in it accelerates L + ɛ passed the merge point.<br />
With this model, we thus have a method, given a highway with m lanes, a<br />
certain traffic density function, and values for various constants, to calculate<br />
the optimal number of tollbooth lanes n. Wecan estimate a finite range of values<br />
of n in which the optimal number must lie. For each value of n we run our<br />
model, calculating the delay experienced by each car and averaging these to<br />
calculate average delay. We then compare our average delays for all n, choosing<br />
the minimal such n so that average delay is within 1 s of the minimum.<br />
Case Study<br />
We need reasonable specific values for our constants and density function<br />
for use in our tests. We take most of these from the Orlando–Orange Country<br />
Expressway Authority [2004] and a variety of reports on cars. We begin with<br />
a few simplifying assumptions about our traffic density function.<br />
• To determine optimal average delay, it suffices to calculate the average delay<br />
over a suitably chosen day, as long as this day has periods of high and<br />
low density. This is reasonable because over most weekdays, traffic tends to<br />
follow similar patterns. Therefore, we limit the domain of ρ to the interval<br />
of seconds [0, 3600 × 24].<br />
• The function ρ(t) is piecewise constant, changing value on the hour. This
310 The UMAP Journal 26.3 (2005)<br />
is reasonable: Since cars are discrete, ρ(t) really is an average over a large<br />
amount of time and thus must already be piecewise constant.<br />
• The length of the time interval between an arriving car and the next car is<br />
normally distributed.<br />
The Orlando–Orange Country Expressway Authority’s report on plaza characteristics<br />
[2004] allows us to construct a realistic traffic density function ρ<br />
for the purposes of testing. The report gives hourly traffic volume on several<br />
highways in Florida, which we use along with our assumption about normal<br />
arrival times to develop an arrival schedule for cars on the highway.<br />
We assume several realistic values for constants defined earlier (Table 3).<br />
Table 3.<br />
Constant values used in testing.<br />
Constant name Symbol Value<br />
Comfortable acceleration a+ 2 m/s 2<br />
Comfortable deceleration a− 2 m/s 2<br />
Hard braking deceleration a brake 8 m/s 2<br />
Car length L 4m<br />
Speed limit vmax 30 m/s<br />
Line spacing ɛ 1m<br />
Our model assumes that every tollbooth operates at a mean rate of approximately<br />
s cars/s. But each type of tollbooth—human-operated, machineoperated,<br />
and beam-operated (such as an EZ-pass)—has a different service<br />
rate. We attempt to approximate the heterogenous tollbooth case by making<br />
s a composite of the respective services rates. According to Edie [1954], the<br />
average holding time (inverse of service rate) for a human operated tollbooth<br />
is 12 s/car, while according to the Orlando–Orange County Expressway Authority<br />
[n.d.], the average service rate for their beamoperated tollbooths, the<br />
E-Pass, is 2 s/car. Similarly, a report for the city of Houston [Texas Transportation<br />
<strong>Institute</strong> 2001] places the holding time for a human operated tollbooth at<br />
10 s/car and a machine operated tollbooth at 7 s/car. Looking at these times,<br />
we find that a reasonable average holding time could be 5 s/car, giving us an<br />
average service rate s =0.2 cars/s.<br />
For verification, we consider hourly traffic volumes for six Florida highways,<br />
with from 2 to 4 lanes and varying traffic volumes [Orlando–Orange<br />
Country Expressway Authority 2004]. We use the data to obtain ρ(t) and test<br />
various components of our model. After model verification, we use our model<br />
to determine the optimal tollbooth allocations.<br />
We look at two typical cases. A toll plaza radius of d = 250 m [Orlando–<br />
Orange Country Expressway Authority 2004] is fairly standard. The hourly<br />
traffic densities of the six highways take a standard form; they differ mostly<br />
in amplitude, not in shape. Therefore, we model our density functions on two<br />
such standard highways, 4-lane Holland West (high density) and 3-lane Bee
A Single-Car Interaction Model 311<br />
Line (low density) (Figure 2). We extrapolate their traffic volume profiles to<br />
profiles for highways with 1 through 7 lanes. For m lanes, we scale the traffic<br />
volume by m/4 (Holland West) or m/3 (Bee Line). Doing so maintains the<br />
shape of the profile and the density of cars per lane while increasing the total<br />
number of cars approaching the toll plaza.<br />
Traffic Volume (cars)<br />
4000<br />
3500<br />
3000<br />
2500<br />
2000<br />
1500<br />
1000<br />
500<br />
0<br />
Holland West<br />
Bee Line<br />
0 5 10 15 20 25<br />
Time (hrs)<br />
Figure 2. Traffic volume as a function of time for Holland West (top) and Bee Line (bottom).<br />
Verification of the Traffic Simulation Model<br />
Based on the optimality criteria, for various test scenarios we determine<br />
the minimal number of tollbooths with average delay time within 1 s of the<br />
minimal average delay. We show the results in Table 4.<br />
Model results for three toll plaza match the actual numbers, and the other<br />
three differ only slightly. In the case of Dean Road, having 4 tollbooths (the<br />
actual case) instead of 5 leads to a significantly longer average delay time (70 s<br />
vs. 25 s). For Bee Line and Holland West, the difference is at most 1 s. These<br />
results suggest that our model agrees generally with the real world.
312 The UMAP Journal 26.3 (2005)<br />
Table 4.<br />
Comparison of model-predicted optimal number of tollbooths and real-world numbers for six<br />
specific highway/toll plaza pairs.<br />
Highway Tollbooths Comparison<br />
Optimal Actual<br />
Hiawassee 4 4 same<br />
John Young Parkway 4 4 same<br />
Dean Road 5 4 mismatch<br />
Bee Line 3 5 close<br />
Holland West 7 6 close<br />
Holland East 7 7 same<br />
Results and Discussion<br />
Using real-world data from the Orlando–Orange Country Expressway Authority<br />
[2004], we create 14 test scenarios: high and low traffic density profiles<br />
for highways with 1 to 7 lanes. For each scenario, we run our model for a number<br />
n of tollbooths n ranging from the number of highway lanes m to 2m +2<br />
(empirically, we found it unnecessary to search beyond this bound) and determine<br />
at which n the average delay time is least—this is the optimal number<br />
of tollbooths. We present our optimality findings in Table 5. For high traffic<br />
densities and more than two lanes, the optimal number of tollbooths tends<br />
to exceed the number of highway lanes by about 50%, a figure that seems to<br />
match current practice in toll plaza design; for low densities, the optimal number<br />
of tollbooths equals the number of highway lanes.<br />
Table 5.<br />
The optimal number of tollbooths for 1 to 7 highway lanes, by traffic density.<br />
High density Low density<br />
Lanes 1 2 3 4 5 6 7 1 2 3 4 5 6 7<br />
Tollbooths 3 4 5 6 8 9 11 1 2 3 4 5 6 7<br />
For high traffic density but only as many tollbooths as lanes, the average<br />
delay time is is roughly 500 s, almost 20 times as long as the average delay<br />
of 25 s for the optimal number of tollbooths. So we strongly discourage construction<br />
of only as many tollbooths as lanes if high traffic density is expected<br />
during any portion of the day. However, when there is low traffic density, this<br />
case is optimal, with an average delay time of 22 s.<br />
Further Study<br />
To simulate real-world conditions more accurately, we could<br />
• consider the effect of heterogenous cars and tollbooths;
A Single-Car Interaction Model 313<br />
• allow for vehicles other than cars, each with their own size and acceleration<br />
constants;<br />
• consider the effect of changing serving rates, since research shows that average<br />
serving time decreases significantly with line length [Edie 1954]; or<br />
• vary the toll plaza radius.<br />
Strengths of Model<br />
The main strength of the Multi-Car Interactive Model stems from our comprehensive<br />
and realistic development of single-car behavior. The intuitive notion<br />
of a car’s safety gap and its relation to acceleration decisions, as well the<br />
effects of reaction times associated with expected and unexpected occurrence<br />
all find validation in traffic flow theory [Gartner et al. 1992]. The idea of a<br />
merge point and a car’s behavior approaching that point mimics the practices<br />
of yielding right-of-way as well as cautiously approaching lane merges. Our<br />
choice of time step realistically approximates the time that normal decisionmaking<br />
requires, allowing us to capture the complete picture of a toll plaza<br />
both on a local, small scale, but also on the scale of overall tendencies. Finally<br />
by allowing for certain elements of normally distributed randomness in serving<br />
time and arrival time we capture some of the natural uncertainty involved<br />
in traffic flow.<br />
Agreat strength of our model lies in the accuracy of its results. Our model<br />
meets all of our original expectations and furthermore predicts optimal tollbooth<br />
line numbers very close to those actually used in the real world, suggesting<br />
that our model approximates real-world practice.<br />
Finally, the Multi-Car Interactive Model provides a versatile framework for<br />
additional refinements, such as modified single-car behavior, different types of<br />
tollbooth, and nonuniform serving rates.<br />
Weaknesses of Model<br />
In the real world, a car in the center lane has an easier time merging into the<br />
center lanes than a car in a peripheral lane, but this behavior is not reflected in<br />
our model. We also disallow lane-changing except at fork and merge points,<br />
though cars often switch lanes upon realizing that they are in a slow tollbooth<br />
line. Our method of determining car arrival times may be flawed, since Gartner<br />
et al. [1992, §8] suggest that car volume is not uniformly distributed over a<br />
given time block but rather increases in pulses.<br />
Perhaps the two greatest weaknesses of our model are that all cars behave<br />
the same and all tollbooth lanes are homogeneous. While we believe that we<br />
capture much of the decision-making process of navigating a toll plaza, we<br />
recognize that knowledge is imperfect, decisions are not always rational, and<br />
all tollbooth lanes, and not all cars (or their drivers) are created equal.
314 The UMAP Journal 26.3 (2005)<br />
References<br />
Adan, Idan, and Jacques Resing. 2001. Queueing Theory. 2001. http://www.cs.<br />
duke.edu/ ∼ fishhai/misc/queue.pdf .<br />
Chao, Xiuli. 2000. Design and evaluation of toll plaza systems.<br />
http://www.transportation.njit.edu/nctip/final report/<br />
Toll Plaza Design.htm .<br />
Edie, A.C. 1954. Traffic delays at toll booths. Journal of Operations Research Society<br />
of America 2: 107–138.<br />
Gartner, Nathan, Carroll J. Messer, and Ajay K. Rathi. 1992. Traffic Flow Theory:<br />
A State of the Art Report. Revised Monograph. Special Report 165. Oak<br />
Ridge, TN: Oak Ridge National Laboratory. http://www.tfhrc.gov/its/<br />
tft/tft.htm .<br />
Green, Marc. 2000. “How long does it take to stop?” Methodological analysis<br />
of driver perception-brake times. Transportation Human Factors 2 (3): 195–<br />
216.<br />
Insurance <strong>Institute</strong> for Highway Safety. 2004. Maximum Posted Speed Limits<br />
for Passenger Vehicles as of September 2004. http://www.iihs.org/<br />
safety facts/state laws/speed limit laws.htm .<br />
Malewicki, Douglas J. 2003. SkyTran Lesson #2: Emergency braking: How can<br />
a vehicle shorten it’s [sic] stopping distance in an emergency. http://www.<br />
skytran.net/09Safety/02sfty.htm .<br />
Orlando–Orange Country Expressway Authority. n.d. E-Pass. http://www.<br />
expresswayauthority.com/trafficstatistics/epass.html .<br />
. 2004. Mainline plaza characteristics.<br />
http://www.expresswayauthority.com/assets/STD&Stats%20Manual/<br />
Mainline%20Toll%20Plazas.pdf .<br />
Texas Transportation <strong>Institute</strong>. 2001. Houston’s travel rate improvement program.<br />
http://mobility.tamu.edu/ums/trip/toolbox/increase system<br />
efficiency.pdf .<br />
UK Department of Transportation. 2004. The Highway Code. http://www.<br />
highwaycode.gov.uk/ .
A Single-Car Interaction Model 315<br />
Ivan Corwin, Nikita Rozenblyum, and Sheel Ganatra.
316 The UMAP Journal 26.3 (2005)
Lane Changes and Close Following 317<br />
Lane Changes and Close Following:<br />
Troublesome Tollbooth Traffic<br />
Andrew Spann<br />
Daniel Kane<br />
Dan Gulotta<br />
Massachusetts <strong>Institute</strong> of Technology<br />
Cambridge, MA<br />
Advisor: Martin Zdenek Bazant<br />
<strong>Summary</strong><br />
We develop a cellular-automaton model to address the slow speeds and<br />
emphasis on lane-changing in tollbooth plazas. We make assumptions about<br />
car-following, based on distance and relative speeds, and arrive at the criterion<br />
that cars maximize their speeds subject to<br />
gap ><br />
Vcar<br />
2<br />
<br />
+ 1<br />
2 (Vcar − Vfrontcar)(Vcar + Vfrontcar +1).<br />
We invent lane-change rules for cars to determine if they can turn safely and<br />
if changing lanes would allow higher speed. Cars modify these preferences<br />
based on whether changing lanes would bring them closer to a desired type<br />
of tollbooth. Overall, our assumptions encourage people to be a bit more<br />
aggressive than in traditional models when merging or driving at low speeds.<br />
We simulate a 70-min period at a tollbooth plaza, with intervals of light and<br />
heavy traffic. We look at statistics from this simulation and comment on the<br />
behavior of individual cars.<br />
In addition to determining the number of tollbooths needed, we discuss how<br />
tollbooth plazas can be improved with road barriers to direct lane expansion<br />
or by assigning the correct number of booths to electronic toll collection. We<br />
set up a generalized lane-expansion structure to test configurations.<br />
Booths should be ordered to encourage safe behavior, such as putting faster<br />
electronic booths together. Rigid barriers affect wait time adversely.<br />
Under typical traffic loads, there should be at least twice as many booths as<br />
highway lanes.<br />
The UMAP Journal 26 (3) (2005) 317–330. c○Copyright 2005 by COMAP, Inc. All rights reserved.<br />
Permission to make digital or hard copies of part or all of this work for personal or classroom use<br />
is granted without fee provided that copies are not made or distributed for profit or commercial<br />
advantage and that copies bear this notice. Abstracting with credit is permitted, but copyrights<br />
for components of this work owned by others than COMAP must be honored. To copy otherwise,<br />
to republish, to post on servers, or to redistribute to lists requires prior permission from COMAP.
318 The UMAP Journal 26.3 (2005)<br />
Definitions and Conventions<br />
Car/Driver. Used interchangeably; “cars” includes trucks.<br />
Tollbooth lane and highway lane. There are n highway lanes and m tollbooths.<br />
The tollbooth lane is the lane corresponding to a particular tollbooth after<br />
lane expansion.<br />
Default lane. In the lane-expansion region, each highway lane is assigned a<br />
tollbooth lane such that following the highway lane without turning leads<br />
by default to the tollbooth lane, and following that in the lane-contraction<br />
region leads to the corresponding highway lane. Other tollbooth lanes begin<br />
to exist at the start of lane expansion and become dead ends at the end of<br />
lane contraction.<br />
Delay. The time for a car to traverse the entire map of our simulated world,<br />
which stretches 250 cells before and after the tollbooth.<br />
Gap. We represent a lane as an array; the gap is obtained by subtracting the<br />
array indices between two adjacent cars.<br />
Assumptions and Justifications<br />
Booths<br />
A booth is manual, automatic, or electronic. A manual booth has a person to<br />
collect the toll, an automatic booth lets drivers deposit coins, and an electronic<br />
booth reads a prepaid radio frequency identification tag as the car<br />
drives by. A booth may allow multiple types of payment.<br />
The cost of operating the booths is negligible. Compared to the cost of building<br />
the toll plaza or of maintaining the stretch of highway for which the toll<br />
is collected, this expense is insignificant, particularly since automated and<br />
electronic booths require less maintenance than manual booths.<br />
Booth delays. Cars with an electronic pass can cross electronic tollbooths at a<br />
speed of 2 cells per time increment (≈30 mph). A car with an electronic pass<br />
can also travel through a manual or automatic booth but must wait 3–7 s<br />
for the gate to rise. A car without an electronic pass is delayed 8–12 s at<br />
an automatic booth and 13–17 s at a manual booth. We use probabilistic<br />
uniform distributions over these intervals to ensure that cars do not exit<br />
tollbooths in sync.
Cars/Drivers<br />
Lane Changes and Close Following 319<br />
Cars are generated according to a probability distribution. We start them at<br />
1mifrom the tollbooth and generate for a fixed amount of simulated time<br />
(usually about 1 h), then keep running until all have gotten to the end of the<br />
simulated road 1 mi beyond the tollbooth. There are no entry or exit ramps<br />
in the 1 mi section leading to the tollbooth. Some vehicles are classified as<br />
trucks, which function identically but must use manual tollbooths if they do<br />
not have an electronic pass.<br />
Drivers accurately estimate distances and differences in speed.<br />
Car acceleration and deceleration is linear and symmetric. In reality, a car<br />
can accelerate much faster from 0 to 15 mph than from 45 to 60 mph, and<br />
the distances for braking and acceleration are different; but this is a standard<br />
assumption for cellular-automaton models.<br />
Cars pack closely in a tollbooth line. Drivers don’t want people from other<br />
lanes to cut into their line, so they follow at distances closer than suggested<br />
on state driver’s license exams.<br />
Dissatisfaction from waiting in line is a nondecreasing convex function. An<br />
especially long wait is a major annoyance. In other words, it is better to<br />
spread wait times uniformly than to have a high standard deviation.<br />
Lanes<br />
Toll collectors can set up new rigid barriers in the lane-expansion region.<br />
Doing so would make certain lane changes illegal in designated locations.<br />
Since adding an extra tollbooth can be cost-prohibitive, setting up barriers<br />
to promote efficient lane-splitting and merging is important.<br />
Signs are posted telling drivers what types of payment each lane accepts.<br />
If drivers benefit from a certain type of booth (e.g., electronic), they will tend<br />
to gravitate toward it.<br />
No highway lane is predisposed to higher speeds than others. Which lanes<br />
are “fast” or “slow” is dictated by the types of tollbooths that they most<br />
directly feed into.<br />
The lane-expansion region covers about 300 ft. The lane contraction section<br />
is also assumed to be 300 ft.<br />
Criteria for Optimal Tollbooth Configuration<br />
Cars slowing or stopping at tollbooths make for bottlenecks. Since the<br />
speed of a car through a tollbooth must be slower than highway speed, adding<br />
tollbooths is an intuitive way to compensate.
320 The UMAP Journal 26.3 (2005)<br />
Our goal is a configuration of lanes and tollbooths that minimizes delay for<br />
drivers. Mean wait time is the simplest criterion but not the best. Consider<br />
the case where there are no electronic passes and traffic is very heavy. In this<br />
limiting but plausible case, there are constantly lines and cars pass through<br />
each booth at full capacity. For a fixed number of tollbooths, the total wait time<br />
should be similar regardless of tollbooth-lane configuration; but if one lane is<br />
moving notably faster than the others, then the distributions of wait times will<br />
differ. Because we assume that dissatisfaction is a convex function, we give<br />
more weight to people who are stuck a long time. Klodzinski and Al-Deek<br />
[2002, 177] suggest that the 85th percentile of delays is a good criterion.<br />
At the same time, we do not wish to ignore drivers who go through quickly.<br />
Therefore, we take the mean of the data that fall between the 50th and 85th<br />
percentiles for each type of vehicle. This will put an emphasis on cars that<br />
are stuck during times of high traffic but will not allow outliers to hijack the<br />
data. We consider separately the categories of cars, trucks, and vehicles with<br />
electronic passes, take the mean of the data that fall between the 50th and 85th<br />
percentiles, and take the weighted average of this according to the percentage<br />
of vehicles in the three categories.<br />
We also wish to analyze effect of toll plaza layout. We therefore record the<br />
incidence of unusually aggressive lane changes, excessive braking, and cars<br />
getting “stuck” in the electronic lane that do not have an electronic pass.<br />
Setting Up a Model<br />
In the Nagel-Schreckenberg cellular-automaton model of traffic flow [Nagel<br />
and Schreckenberg 1992, 2222], cars travel through cells that are roughly the<br />
size of a car with speeds of up to 5 cells per time increment. This model<br />
determines speeds with the rules that cars accelerate if possible, slow down to<br />
avoid other cars if needed, and brake with some random probability. The model<br />
updates car positions in parallel. Such models produce beautiful simulations<br />
of general highway traffic, but less research has been done using the tight speed<br />
constraints and high emphasis on lane-changing that a tollbooth offers.<br />
Creating models for multiple lanes involves defining lane-change criteria,<br />
such as change lanes if there is a car too close in the current lane, if changing<br />
lanes would improve this, if there are no cars within a certain distance<br />
back in the lane to change into, and if a randomly generated variable falls<br />
within a certain range [Rickert et al. 1996, 537]. Even with only two lanes,<br />
one gets interesting behavior and flow-density relationships that match empirical<br />
observations [Chowdhury et al. 1997, 423]. Huang and Huang even try<br />
to implement tollbooths into the Nagel-Schreckenberg model, but their treatment<br />
of lane expansion assumes that each lane branches into two (or more)<br />
tollbooths dedicated to that lane [2002, 602]. In real life, sometimes highways<br />
add tollbooth lanes without distributing the split evenly among highway lanes.<br />
To allow for a various setups, we develop a generalized lane-expansion
Lane Changes and Close Following 321<br />
structure. In the tollbooth scenario, low speeds are more common than in<br />
general stretches of highway, and there is a need to address more than two lanes.<br />
We change car-following and lane-change rules to fit a congested tollbooth area.<br />
In the Nagel-Schreckenberg model, cars adjust their speeds based on the<br />
space in front. The tollbooth forces a universal slowdown in traffic. At these<br />
slow speeds, it is possible to follow cars more closely than at faster speeds. In<br />
the real world, we consider the speed of the car in front in addition to its distance<br />
away. Random braking is needed in the Nagel and Schreckenberg model to<br />
prevent the cars from reaching a steady state. However, in a tollbooth scenario,<br />
the desire not to let other cars cut in line predisposes drivers to follow the car<br />
in front more closely than expected. Thus, we do not use random braking but<br />
incorporate randomness into the arrival of new cars and lane-change priority<br />
orders. Instead of Nagel and Schreckenberg’s rules, we propose the following<br />
rules for a cellular automaton model simulating a tollbooth scenario:<br />
1. Cars have a speed of from 0 to 5 cells per time increment. In a single time<br />
increment, they can accelerate or decelerate by at most 1 unit.<br />
2. Drivers go as fast as they can, subject to the constraint that the distance to<br />
the car in front is enough so that if it brakes suddenly, they can stop in time.<br />
3. Cars change lanes if doing so would allow them to move faster. They modify<br />
the increased speed benefits of changing lanes by checking if the lane leads<br />
to a more desirable tollbooth type or if they face an impending lane merger.<br />
Before changing lanes, cars check the gap criterion of rule 2) applies to both<br />
the gap in front and the gap behind the driver after the lane change.<br />
4. At each time step, we update positions and speeds from front to back.<br />
We examine the rules in detail. Let us say that<br />
• There are 250 cells in a mile (a little over 21 ft/cell).<br />
• Each time step represents about 1 s.<br />
Rule 1’s maximum speed of 5 cells per time step corresponds to 72 mph (each<br />
unit of velocity is just under 15 mph), which is about the expected highway<br />
speed. The numbers for length and time increments do not need to be precise,<br />
since we can fix one and scale the other; what is important is that the length of<br />
a cell is a little more than the average length of a car (about 15 ft).<br />
For any pair of following cars, we want the rear car to be able to decelerate<br />
at a rate of at most 1 unit and still avoid collision with the front car, even if<br />
the front car begins decelerating at a rate of 1 unit per time step squared. If<br />
for a given time step the rear and front cars have speeds Vcar and Vfrontcar and<br />
immediately begin decelerating at a rate of 1 unit squared until they stop, the<br />
total distances that they travel are<br />
Vcar +(Vcar − 1) + ···+1= 1<br />
2 Vcar(Vcar +1),<br />
Vfrontcar +(Vfrontcar − 1) + ···+1= 1<br />
2 Vfrontcar(Vfrontcar +1).
322 The UMAP Journal 26.3 (2005)<br />
Our condition is equivalent to the car in back remaining behind the car in front,<br />
so the gap or difference in squares between the cars must be<br />
gap > 1<br />
1<br />
2Vcar(Vcar+1)− 2Vfrontcar(Vfrontcar+1) = 1<br />
2 (Vcar−Vfrontcar)(Vcar+Vfrontcar+1).<br />
Thus, at each update, the rear car checks if it can increase its speed by 1 and still<br />
satisfy this inequality or if it must decrease its speed to maintain the inequality,<br />
and acts accordingly.<br />
However, according to this model, if two cars are going the same speed, then<br />
they theoretically touch. Besides being a safety problem, this also contradicts<br />
the observations of Hall et al. that flow of cars as a function of percent occupancy<br />
of a location increases sharply until about 20% and then decreases thereafter<br />
[1986, 207]. With the inequality above, we could generate initial conditions with<br />
high occupancy and high flow. Before we discard our model, though, let us<br />
first check to see if these conditions would actually show up in the simulation.<br />
We add the rule that a car tries to leave at least ⌊Vcar/2⌋ empty spaces before<br />
the car in front; this would still let cars tailgate at low speeds. For high speeds,<br />
this would be a somewhat unsafe distance but consistent with aggressive merging;<br />
but we expect high speeds to be rare near the tollbooth during moderate<br />
or high congestion. Thus, our final criterion for rule 2 is that a car looks at the<br />
number of empty spaces in front of it and adjusts its speed (upward if possible)<br />
so that it still meets the inequality<br />
<br />
Vcar<br />
gap > +<br />
2<br />
1<br />
2 (Vcar − Vfrontcar)(Vcar + Vfrontcar +1).<br />
When changing lanes (rule 3), cars ask, “If I changed lanes, how fast could I<br />
go this time step?” Cars avoid making lane changes that could cause a collision,<br />
as determined by the gap criterion. When given an opportunity to change lanes,<br />
a car compares the values of the maximum speeds that it could attain if it were<br />
in each lane but adds modifiers. Lanes have penalties in valuation for leading<br />
to tollbooths that the driver cannot use (−2 per lane away from a usable lane<br />
before the lanes branch and −20 after) or are suboptimal (−1 per lane away<br />
from an optimal lane), where suboptimal means a car with an electronic pass in<br />
a lane that does not accept it. Leaving the tollbooth, drivers try hard to get out<br />
of dead-end lanes (−3 or−5 depending on how far it is to the end). If drivers<br />
value the lane they are in and a separate lane equally, they do not change. If<br />
drivers value both the lane on their left and the lane on their right equally more<br />
than their current lane, they pick randomly.<br />
We update speeds in each lane from front to back, with lanes chosen in a random<br />
order. A consequence of this is that information can propagate backwards<br />
at infinite speed if for example the head of a string of cars all going at speed 1<br />
came to a complete stop. This infinite wave-speed problem could be fixed by<br />
introducing random braking, but at slow speeds we find it more acceptable to<br />
have people inching forward continuously than to have people braking from 1<br />
to 0 at inopportune times. This also has consequences for lane changes, in that
Lane Changes and Close Following 323<br />
randomly giving lanes an update priority will have different results from processing<br />
all lane changes in parallel. Although some cellular-automaton traffic<br />
models in the literature update in parallel, we use serial updating because it<br />
makes handling the arrays easier and eliminates the problem of having people<br />
from two different lanes trying to change into the lane between them at the<br />
same time. The random update priority ordering for the lanes is changed every<br />
time increment, so that there is less systematic asymmetry in lane changing.<br />
Generalized Lane-Expansion Structure<br />
We develop a system to describe easily a large number of different tollbooth<br />
setups. The road both starts and ends as an n-lane highway and contains m<br />
tollbooths in the middle. The lane dividers are labeled from 1 to n +1for the<br />
highway lanes and from 1 to m +1for the tollbooth lanes. A rigid barrier<br />
consists of an (x, y) pair where the xcoordinate represents a lane divider and<br />
the y-coordinate represents a tollbooth divider. Figure 1 shows the case n =4,<br />
m =6, with rigid barriers at (1, 1), (2, 3), (3, 4), and (5, 7). Cars may not make<br />
lane changes across a rigid barrier.<br />
Figure 1. Generalized lane-expansion scheme.<br />
Suppose that we have an ordered set of rigid barriers {(x1,y1),... ,(xk,yk)},<br />
where xi +1>xi for i =1,...,k− 1. Then the set of rigid barriers must obey<br />
the following rules:<br />
• you cannot drive off the road: (1, 1) and (n+1,m+1)must be rigid barriers;<br />
and
324 The UMAP Journal 26.3 (2005)<br />
• rigid barriers do not cross each other: for i =1,... ,k−1,wehave yi+1 >yi.<br />
The dotted lines in Figure 1 can be crossed as normal lane changes. In the<br />
lane-expansion region, each lane is assigned a “default” tollbooth lane that it<br />
most naturally feeds into. Highway lanes 1, 2, 3, and 4 feed tollbooth lanes 1,<br />
3, 4, and 5. If there is an adjacent lane not blocked by a rigid barrier, a car can<br />
enter that lane. The default tollbooth lane then feeds back into the highway<br />
lane after the tollbooth and the other highway lanes are treated as dead-ends.<br />
Cars are given an incentive to change out of these dead-end lanes ahead of<br />
time. We assume that rigid barriers and default lanes are symmetric between<br />
lane expansion and contraction. Additionally, no lane changes are allowed on<br />
the five cells immediately preceding and following the tollbooth cell.<br />
Results<br />
We simulate a 70-min period when incoming traffic starts light, increases<br />
for 40 min, then decreases again. Figure 2 shows the generation rates for light,<br />
normal, and heavy traffic. For a four-lane highway, these settings correspond<br />
to volumes of about 2200, 3000, and 3600 cars over the 70-min period.<br />
Figure 2. Traffic generation rates.<br />
We test two cases of allocation and arrangement of tollbooths: no barriers,<br />
or else each highway lane branches into an equal number of tollbooth lanes. In<br />
both cases, we make the odd numbered lanes the default lanes. We tested both<br />
of these cases for different orderings of the tollbooths. For a 4-lane highway, we<br />
use 2 electronic booths, 4 automatic booths, and 2 manual booths. Half of the<br />
vehicles had electronic passes and 10% of the vehicles are trucks (no electronic<br />
pass). First we clustered all booths of the same type in some permutation, then<br />
we alternated types. Figure 3 shows data averaged over 10 runs.
Lane Changes and Close Following 325<br />
Figure 3a. Clustered lanes. Figure 3b. Alternating lanes.<br />
Figure 3. Average delays for two lane configurations and with vs. without barriers. All situations<br />
are for normal traffic load, 4 highway lanes, and 8 booths—2 electronic, 4 automatic, 2 manual.<br />
The x-axis gives configurations and the y-axis is adjusted average delay<br />
time (mean of the 50th through 85th percentiles of travel time through the 250<br />
cells before and after the tollbooth). If there were no tollbooth, then a car at full<br />
speed would have delay 100 s. Barriers are slightly worse than just allowing<br />
people to change lanes.<br />
We note from Figure 3a that each of the clustered lane types is different from<br />
its mirror image, and this phenomenon is reproducible, which is puzzling. We<br />
think that it is caused by our handling of the concept of default lane, where<br />
some lanes feed directly into tollbooth lanes; with unrestricted lane expansion,<br />
this might make some lane changes easier than others.<br />
The alternating tollbooth configurations appear to have slightly less delay,<br />
but they also generate more warning flags about dangerous turns and cars<br />
becoming stuck in tollbooth lanes that they cannot use. For each clustered configuration,<br />
either it or its mirror image gives time equivalent to the alternating<br />
tollbooth configurations. Therefore, for safety reasons, we suggest using the<br />
clustered configurations.<br />
We next determine how many of each type of booth to use for a 4-lane<br />
highway with 8 tollbooths and a lane-expansion region with no rigid barriers.<br />
We put the electronic booths on the left and the manual booths on the right.<br />
We vary the numbers of each type of tollbooth for different distributions of<br />
cars, trucks, and vehicles with electronic passes and run the simulation under<br />
normal traffic loads. Unless the percentage of trucks is very low, allocating<br />
only 1 manual booth for the trucks generates a large number of trucks stuck<br />
in lanes that they cannot use. The number of electronic booths should be 2<br />
or 3, depending on whether cars with electronic passes outnumber vehicles<br />
without them. Since 8 to 12 tollbooths is reasonable size for a 4-lane highway,<br />
we recommend very roughly one-fourth electronic, one-half automatic, and one-fourth<br />
manual tollbooths.
326 The UMAP Journal 26.3 (2005)<br />
How many tollbooths are needed for different levels of traffic? We round<br />
down the number of manual and electronic tollbooths and round up the number<br />
of automatic tollbooths from the above proportions. Using the light, normal,<br />
and heavy traffic loads defined in Figure 2 above, we arrive at Figure 4.<br />
Figure 4. Delay vs. number of tollbooths.<br />
Finally, we consider the limiting case of no trucks and no electronic passes<br />
(all tollbooths are automatic). This is the standard case directly comparable to<br />
other models in the literature. Under light, normal, and heavy traffic loads, we<br />
find that delay times are as in Figure 5.<br />
Without electronic tollbooths, cars experience much longer delays, since<br />
each must stop at a tollbooth. With only one tollbooth per lane, the normal<br />
traffic load (3000 vehicles over 70 min) forces many people to wait over 45 min!<br />
It takes about 12 lanes to reach minimal delay in this situation instead of the 9<br />
in the situation with automatic and electronic lanes.<br />
Do the Cars Behave Reasonably?<br />
In Figure 6,wegraph travel time vs. arrival time for all cars, under normal<br />
traffic loads with no barriers, 4 highway lanes, 8 tollbooths (from left to right:<br />
2 electronic, 4 automatic, 2 manual). There are two main features:<br />
• The line represents cars with electronic passes. Even under a heavy traffic<br />
load, they are not terribly delayed, since they can pass through their booth<br />
without stopping.<br />
• Along the top, we see the cars without electronic passes. The distribution of<br />
their wait times looks like the graph of their generation rate shifted over by
Lane Changes and Close Following 327<br />
Figure 5. Delay vs. number of tollbooths—no trucks or electronic passes.<br />
Figure 6. Travel time vs. arrival time.
328 The UMAP Journal 26.3 (2005)<br />
about 10 min. One can even see the graph split into several “lanes,” which<br />
shows the difference between the slower truck lanes (manual tollbooths) and<br />
the normal cars (automatic tollbooths).<br />
We are also interested in what configurations lead to potential accidents. We<br />
ran setups under the default parameters of normal traffic load, 50% electronic<br />
passes, and 10% trucks. Figure 7 shows the number of occurrences of several<br />
types of these behaviors, out of about 3000 cars total.<br />
Figure 7. Incidents of dangerous behavior.<br />
We see in the leftmost configuration that having only one manual lane leads<br />
to trucks stuck in the wrong booth. Trucks joining the wrong booth also seems to<br />
lead to an increase in hard braking; this appears to be an artifact of cars traveling<br />
at speeds of 1 or 2 not decelerating properly when nearing a tollbooth. In<br />
our experiments, this phenomenon tends to be correlated with inefficient lanechanging<br />
schemes. The second configuration from the left is our recommended<br />
configuration. The third and fourth configurations show the difference that<br />
barriers make: They cause fewer tollbooth mistakes but lead to dangerous<br />
turns and hard braking, which are probably related.<br />
Sensitivity to Parameters<br />
Changing the length of the lane-expansion and -contraction regions did<br />
not have a statistically significant effect on either wait times or logs of bad<br />
behaviors. The percentages of cars with electronic passes and trucks can be<br />
changed by a fair amount before they affect anything. For a general number<br />
n of highway lanes and rigid barriers, the marginal return of adding a new<br />
tollbooth after 2n or 2n +1is small unless the traffic load is exceptionally large.
Strengths and Weaknesses<br />
Strengths<br />
Lane Changes and Close Following 329<br />
Can handle a wide variety of possible setups. It is hard to add new tollbooths<br />
but easier to change the type of tollbooth or set up barriers.<br />
Captures important features of the actual situation.<br />
Behavior based on simple procedures meant to accomplish natural goals. We<br />
avoid introducing artificial effects by basing drivers’ behaviors on simple<br />
methods of accomplishing natural goals, such as avoiding collisions and<br />
getting into a better lane.<br />
Weaknesses<br />
Need to obtain real-world parameters. If we were acting as consultants for a<br />
particular highway, we should collect data.<br />
More complicated than simple models in literature. Our model may introduce<br />
some artificial behavior. Cellular automaton models are supposed to have<br />
complex behavior emerge from simple assumptions, not the other way<br />
around.<br />
Infinite speed of information propagation. Due to the order in which cars are<br />
updated in our model, information about obstacles can propagate backwards<br />
at infinite speed, an effect which can lead to inaccuracies.<br />
Conclusion<br />
Cellular-automaton models are one effective means of studying traffic simulations.<br />
Other approaches use partial differential equations motivated by<br />
kinetics or fluid mechanics [Chowdhury et al. 1997, 213–225].<br />
Our cellular automaton model gives us valuable insight into the tollbooth<br />
traffic problem. We can see cars flowing through the tollbooths and piling up<br />
during rush hour. We can follow the motions of individual cars and collect<br />
statistics on their behaviors. From our experiments, we make the following<br />
recommendations:<br />
Tollbooths should be ordered based on encouraged behavior. Safety considerations<br />
should take precedence; putting faster booths on the left and slower<br />
booths on the right accomplishes this.<br />
No barriers. Barriers prevent drivers getting to lanes that they need to use.
330 The UMAP Journal 26.3 (2005)<br />
The distribution of types of cars should determine how many tollbooths. Traffic<br />
density has little effect on the number of tollbooths needed to minimize delay;<br />
the distribution of types of cars has a much larger effect.<br />
An effective ratio of tollbooths is 1 electronic: 2 automatic : 1 manual.<br />
References<br />
Chowdhury, Debashish, Ludger Santen, and Andreas Schadschneider. 2000.<br />
Statistical physics of vehicular traffic and some related systems. Physics<br />
Reports 329: 199–329.<br />
Chowdhury, Debashish, Dietrich E. Wolf, and Michael Schreckenberg. 1997.<br />
Particle hopping models for two-lane traffic with two kinds of vehicles:<br />
Effects of lane-changing rules. Physica A 235: 417–439.<br />
Haberman, Richard. 1977. Mathematical Models: Mechanical Vibrations, Population<br />
Dynamics, and Traffic Flow. Englewood Cliffs, NJ: Prentice Hall. 1998.<br />
Reprint. Philadelphia: SIAM.<br />
Hall, Fred L., Brian L. Allen, and Margot A. Gunter. 1986. Empirical analysis of<br />
freeway flow-density relationships. Transportation Research Part A: General<br />
20 (3): 197–210.<br />
Huang, Ding-wei, and Wei-neng Huang. 2002. The influence of tollbooths on<br />
highway traffic. Physica A 312: 597–608.<br />
Klodzinski, Jack, and Haitham Al-Deek. 2002. New methodology for defining<br />
level of service at toll plazas. Journal of Transportation Engineering 128 (2):<br />
173–181.<br />
Nagel, Kai, and Michael Schreckenberg. 1992. A cellular automaton model for<br />
freeway traffic. Journal de Physique I 2 (12): 2221–2229.<br />
Rickert, M., K. Nagel, M. Schreckenberg, and A. Latour. 1996. Two lane traffic<br />
simulations using cellular automata. Physica A 231: 534–550.<br />
Martin Bazant (advisor), Daniel Kane, Andrew Spann, and Daniel Gulotta.
A Quasi-Sequential Cellular Automaton Approach 331<br />
A Quasi-Sequential<br />
Cellular-Automaton Approach<br />
to Traffic Modeling<br />
John Evans<br />
Meral Reyhan<br />
<strong>Rensselaer</strong> <strong>Polytechnic</strong> <strong>Institute</strong><br />
Troy,NY<br />
Advisor: Peter Kramer<br />
<strong>Summary</strong><br />
The most popular discrete models to simulate traffic flow are cellular automata,<br />
discrete dynamical systems whose behavior is completely specified in<br />
terms of its local region. Space is represented as a grid, with each cell containing<br />
some data, and these cells act in accordance to some set of rules at each<br />
temporal step. Of particular interest to this problem are sequential cellular<br />
automata (SCA), where the cells are updated in a sequential manner at each<br />
temporal step.<br />
We develop a discrete model with a grid to represent the area around a toll<br />
plaza and cells to hold cars. The cars are modeled as 5-dimensional vectors,<br />
with each dimension representing a different characteristic (e.g., speed). By<br />
discretizing the grid into different regimes (transition from highway, tollbooth,<br />
etc.), we develop rules for cars to follow in their movement. Finally, we model<br />
incoming traffic flow using a negative exponential distribution.<br />
We plot the average time for a car to move through the grid vs. incoming<br />
traffic flow rate for three different cases: 4 incoming lanes and tollbooths, 4<br />
incoming lanes and 4, 5, and 6 tollbooths. In each plots, we noted at certain<br />
values for the flow rate, there is a boundary layer in our solution. As we increase<br />
the ratio of tollbooths to incoming lanes, this boundary layer shifts to the right.<br />
Hence, the optimum solution is to pick the minimum number of tollbooths for<br />
which the maximum flow rate expected is located to the left of the boundary<br />
layer.<br />
The UMAP Journal 26 (3) (2005) 331–344. c○Copyright 2005 by COMAP, Inc. All rights reserved.<br />
Permission to make digital or hard copies of part or all of this work for personal or classroom use<br />
is granted without fee provided that copies are not made or distributed for profit or commercial<br />
advantage and that copies bear this notice. Abstracting with credit is permitted, but copyrights<br />
for components of this work owned by others than COMAP must be honored. To copy otherwise,<br />
to republish, to post on servers, or to redistribute to lists requires prior permission from COMAP.
332 The UMAP Journal 26.3 (2005)<br />
Introduction<br />
Figure 1. The New Jersey Turnpike (I-95) at night.<br />
Models for traffic flow can be broken down into two basic types.<br />
• The first type treats space and time as a continuum; both cars and time are<br />
continuous in nature.<br />
• The second type, discrete models, treats space as a lattice and time discretely.<br />
A common discrete model is a cellular automaton, where space is modeled<br />
by a lattice and each lattice site represents a state of the system. The lattice<br />
sites are updated and their states change. For traffic flow, the states of the<br />
lattice sites represent whether a car is present at that spatial location or not.<br />
Near a tollbooth, cars must stop to pay before moving on. Since each car<br />
affects the other cars in its direct neighborhood, it is not reasonable to model<br />
cars as a continuum. Discrete time also allows us to control the movement of<br />
the cars at each individual time step. Finally, discrete models in general are<br />
much easier to understand and to implement on modern computing resources.<br />
Assumptions<br />
• Upon nearing a toll plaza, a driver maneuvers based on local congestion to<br />
minimize travel time.<br />
• Within 100 ft of the toll plaza, a driver remains in a lane and slows down<br />
to an average speed of about 5–10 mph. We base the speed of the cars on<br />
what is suggested in most driver’s manuals: Car separation should be one<br />
car length for every 10 mph of speed.<br />
• Once a driver pays the toll, they maneuver to a highway lane and accelerate<br />
to highway speeds.
A Quasi-Sequential Cellular Automaton Approach 333<br />
• Drivers do not cooperate. While the drivers are not directly competing<br />
against one other, they are affecting each other and are hence fierce indirect<br />
obstacles/opponents.<br />
• Vehicles are of constant length (17.5 ft).<br />
• It takes about4sfor a tollbooth employee to process a motorist [Chao n.d.].<br />
A Quasi-SCA Model of Toll Plaza Dynamics<br />
Case 1: Equal Numbers of Lanes and Booths<br />
Preliminaries<br />
Cellular automata (CA) are discrete dynamical systems whose behavior<br />
is completely specified locally. Space is represented as a uniform grid, with<br />
each cell containing data. Time advances in discrete steps, and the laws of the<br />
universe are expressed in a look-up table relating each cell to nearby cells to<br />
compute its new state. The system’s laws are local and uniform.<br />
The basic one-dimensional cellular automata model for highway traffic flow<br />
is the CA rule 184, as classified by Wolfram [Nagel et al. 1998; Jiang n.d.; Wolfram<br />
2002]. CA 184 is a discrete time process with state space η ∈{0, 1} Z and<br />
the following evolution rule: If η ∈{0, 1} Z is the state of at time n, then the<br />
state η ′ at time n +1is defined by<br />
η ′ ⎧<br />
⎨ 1, if η(x) =η(x +1)=1;<br />
:=<br />
⎩<br />
1,<br />
0,<br />
if η(x) =1− η(x +1)=0;<br />
otherwise,<br />
where η(x) denotes the value of η : Z→{0, 1} at the coordinate x.<br />
In this model, cars march to the right in a rather uniform manner, and all<br />
nodes execute their moves in parallel.<br />
Toll plaza dynamics, while similar to traffic dynamics, are quite different.<br />
• Toll plazas cannot be approximated as covering an infinite domain.<br />
• Drivers must make decisions based on who moves in front of them. In this<br />
sense, we use ideas from Sequential Cellular Automata (SCA) [Tosic and<br />
Agha n.d.] instead of the classical schemes.<br />
• Cells are updated in a slightly different manner than in classical cellular<br />
automata. To model car movement properly, “cars” are moved through<br />
cells one at a time.<br />
Our model is like a board game. For these reasons, we dub our model a<br />
“Quasi-SCA Model of Toll Plaza Dynamics.”
334 The UMAP Journal 26.3 (2005)<br />
We divide a multilane highway into equally partitioned lanes. Each cell<br />
is approximately 25 ft long and contains information on whether it contains a<br />
car and, if it does, certain information about the car. Furthermore, there are<br />
specialized cell characteristics for different regimes, as shown in Figure 2. In<br />
our model, we also move forward in discrete time steps. For convenience, this<br />
time step is set to be2sinlength.<br />
Figure 2. Possible regimes.<br />
To implement our model, we exploit the object-oriented features of C++. We<br />
create a car class, with certain variables associated with it, as shown in Table 1.<br />
Table 1.<br />
Car class variables in C++.<br />
The highway is represented as a large 50 × n array of car variables, where<br />
n is the number of lanes. When initialized, this array contains empty grid<br />
spaces. As cars enter in from the left, grid spaces are activated and infused<br />
with information about the cars. Then, with this information, the state of the<br />
system at the next time step can be determined.<br />
Vehicle Speed<br />
The speeds of cars not in the tollbooth regime are dictated by car separation<br />
having to be one car length for every 10 mph of speed. Since our model is<br />
discrete in both space and time, this criterion must be quantized. Moving one<br />
grid space ahead in one temporal step corresponds to a speed of about 8.5 mph.<br />
If we approximate one grid space as one car length and 8.5 mph ∼ 10 mph, we
A Quasi-Sequential Cellular Automaton Approach 335<br />
can generalize the speeds of the cars in the following manner:<br />
⎧<br />
⎪⎨<br />
0, if minx>i{x | o(x, j, t) =1} = i +1;<br />
1, if minx>i{x | o(x, j, t) =1} = i +2;<br />
s(i, j, t) :=<br />
⎪⎩<br />
2, if minx>i{x | o(x, j, t) =1} = i +3;<br />
3, otherwise.<br />
We enforce 25.6 mph as an upper limit to speed, since the vehicles must<br />
slow down as they approach the toll. At each time step, the speed for a car is<br />
updated just before it initiates movement.<br />
Congestion<br />
Since a driver is far more forward-focused than rearward-focused, we consider<br />
congestion to be determined only by the cars immediately in front—in<br />
particular, the nearest five cars. We write congestion for the car located in grid<br />
cell η(i, j, t) as<br />
where<br />
Sequencing<br />
c(i, j, t) := 1<br />
5<br />
5<br />
o(i + k, j),<br />
k=1<br />
<br />
1, if grid cell (i, j) contains a car;<br />
o(i, j, t) :=<br />
0, otherwise<br />
Cells are updated sequentially as opposed to simultaneously, because cars<br />
make decisions based on the cars in front. Furthermore, in a given column of<br />
our array, that is, one spatial location across four lanes, the car with the largest<br />
speed has the first initiative; the car with the second largest speed moves second,<br />
etc. In the case of a tie, the car closer to the top of the grid moves first.<br />
Movement<br />
Transition Regimes<br />
Transition regimes are regions where traffic comes in from the highway<br />
or leaves to the highway. In these regimes, drivers maneuver in a manner<br />
such that they can optimize travel time but minimize effort. Thus, movement<br />
possibilities in the transition regimes can be described by Figure 3.<br />
The optimal maneuver is to move forward, but a driver will enter a lane to<br />
the right or left if the move minimizes congestion.<br />
In two locations of the transition regimes, there are special considerations.
336 The UMAP Journal 26.3 (2005)<br />
Figure 3. Movement in transition regimes: Center lane, far left lane, far right lane<br />
• The transition from highway regime: There must be some way to depict the<br />
arrival of traffic from the highway. We discuss later how we do this.<br />
• The tail end of the transition-to-highway regime: Provided a car has sufficient<br />
speed, we eliminate the car from the grid. We also record its TotalTime-<br />
OnGrid variable.<br />
Tollbooth Regime<br />
In the tollbooth regime, drivers no longer veer to the right or left. Instead,<br />
they move forward in line until they reach the tollbooth. In this region, spanning<br />
the 100 ft in front of the tollbooth, cars move at a maximum rate of one<br />
grid space per temporal element. Once in the tollbooth, they wait two entire<br />
temporal elements solely in the booth (about 4 s) until they move on to the transition<br />
regime. This is implemented by incrementing a car’s TotalTimeInToll<br />
variable (initialized to zero when a vehicle enters the map) every temporal step<br />
that a car is in the booth (for the entire step) and checking if it is greater than 2.<br />
Often in this region, lines will form. As soon as a car emerges from the tollbooth,<br />
all of the cars behind move forward immediately. The dynamics of this<br />
regime are quite a bit different and simpler than the dynamics of the transition<br />
regime.<br />
We illustrate this situation in Figure 4. The red cars in lanes one and four<br />
are stopped, waiting behind cars located in the booth. The green cars ahead<br />
of the toll are transitioning to the highway regime. The yellow car is moving<br />
into the tollbooth, and the blue car is moving further inside the region. The<br />
green car before the toll is just now moving into the tollbooth region. While its<br />
current speed is 25.6 mph, once inside the region, it decelerates to 8.5 mph.
A Quasi-Sequential Cellular Automaton Approach 337<br />
Figure 4. Movement in the tollbooth regime<br />
Modeling the Incoming Traffic Flow<br />
To make our model more accurate, we use a statistical distribution to predict<br />
incoming flow. Two commonly-used distributions are the Poisson and the<br />
negative exponential. However, the Poisson distribution fits well only for light<br />
traffic [Aston 1966]. The negative exponential distribution is a good fit for<br />
heavy traffic; it is used to model the variations of gap length in a traffic stream<br />
over distance and random arrivals. It has probability density function<br />
f(t) =qe −qt ,<br />
where t is the time (s) between arrivals and q is the rate of arrival (cars/s), and<br />
cumulative distribution function<br />
F (t) =1− e −qt . (1)<br />
To implement this arrival time into our simulation, we assign it to a site of<br />
entry (a space) into the grid. A random number generator creates a random<br />
fraction F ; using (1), wesolve for t = − ln R/q. The value t is assigned to a<br />
“spawn site,” a place where “cars” are created. We use a counter to keep track<br />
of the time between different spawnings of cars. If this counter is greater than<br />
F and the “spawn site” is empty (contains a null car), then a car is created at<br />
the spawning site. Otherwise, the counter is incremented until one of these<br />
two conditions are met. Cars “arrive” in each lane of the simulation using this<br />
method. We use a modified q such in units of car per 2sper lane.<br />
Results<br />
We simulate for varying values of q, the flow rate of cars per 2sper lane,<br />
for a 4-lane highway with 4 tollbooths. We let q vary from 0.01 cars/s/lane<br />
(0.02 cars/s overall) to 1 car/s/ lane (2 cars/s overall. Figure 6 outlines a given<br />
time evolution for a small value of q.<br />
The time through which the cars move through the grid (or toll plaza) is an<br />
appropriate measure of congestion. Thus, we plot in Figure 7 the average time
338 The UMAP Journal 26.3 (2005)<br />
Figure 6.Time evolution of a simulation, four temporal steps.<br />
getting through the grid versus the flow rate. The average time is obtained<br />
from a simulation accounting for one hour of traffic. We also plot for each flow<br />
value the maximum amount of time that anyone spent getting through the grid.<br />
For q in [0.01,0.37] cars/(2 s)/lane (0.02–0.74 cars/s overall), drivers enjoy<br />
an average time through the grid below 50 s. We consider this an optimal<br />
situation. However, at around a q =0.36 cars/(2 s)/lane, there appears to be a<br />
boundary layer. For q>0.37, ittakes drivers an average of 2 min or more to<br />
get through the quarter-mile long grid, corresponding to less than 10 mph. We<br />
demonstrate later that by adding more tollbooths, we shift the boundary layer<br />
and lower the average time for larger q. Thus, a good strategy to determine<br />
the number of tollbooths is to estimate the anticipated maximum flow rate and<br />
choose a number of lanes for which q is never beyond the boundary layer.<br />
Congestion is at its worst during rush hour, when toll plazas serve as bottlenecks.<br />
But what do these congestion levels mean in total time through the<br />
plaza? Is the number of tollbooths optimal?<br />
The Hiawassee M/L Toll Plaza in Florida uses a 4-tollbooth plaza. In<br />
October 2003, the Eastbound car count 7–8 a.m. was 3403 cars [Orlando–<br />
Orange County Expressway Authority 2003], so cars arrived at a rate of 0.945<br />
cars/s/lane. With our assumption that a car is 17.5 ft long, clearly, four tollbooths<br />
are not enough to handle this heavy demand.<br />
However, EZPass and other such programs allow one to minimize the time<br />
at a tollbooth. If even a small portion of the cars use the EZPass system, the<br />
value of q for which the boundary layer results grows vastly. If we were to<br />
accurately determine an optimal value of tollbooths for a certain value of q for<br />
a highway using such a system, we would have to approach the problem in a
A Quasi-Sequential Cellular Automaton Approach 339<br />
Figure 7. Average time through grid vs. flow rate.<br />
Figure 8. Maximum time through grid vs. flow rate.<br />
slightly different fashion. In particular, we would have to vary the time drivers<br />
spend at the booth and designate certain lanes as having a quick pass system.<br />
Case 2: More Tollbooths than Lanes<br />
Preliminaries<br />
The situation changes quite a bit if there are more tollbooths than incoming<br />
lanes. Drivers in the far left and right lanes start moving into the new tollbooth<br />
lanes. Hence, we introduce a new scheme, as presented in Figure 9.
340 The UMAP Journal 26.3 (2005)<br />
Figure 9. Possible regimes.<br />
Movement in the Expansion Regime<br />
The expansion regime is where the incoming traffic lanes fan out to a greater<br />
number of tollbooth lanes. For the center lanes, movement is identical to the<br />
transition regimes. On the outer lanes, however, movement is slightly different.<br />
The movement possibilities are outlined in Figure 10.<br />
Figure 10. Movement in the expansion regime.<br />
For a driver in the outside lane, the optimal maneuver is to move into one<br />
of the newly-created tollbooth lanes, unless the congestion is less in the current<br />
lane. Another new addition is that the driver will not try to move into one of the<br />
inner lanes—more for psychological reasons than practical reasons. According<br />
to the model, the driver assumes that the outside lanes are the least dense (and<br />
fastest), since they did not exist on the highway. Drivers on the newly created<br />
lanes are allowed to move only forward in our model. While a driver may<br />
move to an outside lane just to move back again, we consider the chance of this<br />
occurring as very slim.<br />
Movement in the Compression Regime<br />
The compression regime is where a greater number of tollbooth lanes collapse<br />
onto a smaller number of highway lanes. We have the movement possibilities<br />
presented in Figure 11.
A Quasi-Sequential Cellular Automaton Approach 341<br />
Figure 11. Movement in the compression regime.<br />
A driver in a tollbooth lane that is a highway lane follows the same rules as<br />
in the earlier tollbooth regime. A driver not in a highway lane, however, tries<br />
to move back onto a highway lanes; if this is not possible, they keep driving<br />
forward and trying again until they are forced to stop at the end of the tollbooth<br />
lane. This protocol can provide for some hectic situations.<br />
Results<br />
We simulate our second model for varying values of q for 4 highway lanes<br />
with 5 and 6 tollbooths. The range for q is the same as our first model. Figures<br />
12–13 show the results for these two cases, for which we take the expansion<br />
and compression regimes to be 125 ft long.<br />
Figure 12. Average time through grid vs. flow rate, for 6 lanes.<br />
The boundary layer is moved to the right as the number of toll lanes increases.<br />
Furthermore, the value for q on the right side of the boundary layer<br />
decreases with more toll lanes. Thus, as suggested, one should choose a sufficient<br />
number of lanes that correlates to this behavior. If the maximum flow rate<br />
one expects is a certain value, one can run a simulation for a certain number of
342 The UMAP Journal 26.3 (2005)<br />
Figure 13. Average time through grid vs. flow rate, for 6 lanes.<br />
tollbooths and choose the least number of tollbooths such that the maximum<br />
flow is to the left of the boundary layer.<br />
However, with an increased number of lanes comes an increased maximum<br />
individual travel time: At times, people become stuck in the toll lanes and have<br />
to wait for an opportune moment to move over. In our model, this is reflected<br />
in the fact that while the four-tollbooth case results in a maximum travel time of<br />
about 3.4 min, the 5- and 6-lane cases sometimes have a maximum individual<br />
travel time near 4 min.<br />
Model Improvements and Discussion<br />
Drivers do not always move in a predictable manner. A probabilistic model<br />
taking into account the unpredictable nature of humans could further improve<br />
our model.<br />
Our model also does not take into account the possibility of accidents. An<br />
accident model would surely improve our model.<br />
While we do take into account the random nature of incoming traffic flow,<br />
we could develop an even better model to approximate the flow rate.<br />
Lastly, our model could include a probabilistic model for the time that a car<br />
waits at a tollbooth.<br />
Conclusion<br />
We develop a quasi-SCA model for toll plaza dynamics that treats time and<br />
space in a discrete manner to capture the motivation and actions of drivers. We<br />
use a negative exponential distribution for the incoming flow rate of cars. We<br />
compute the average waiting time for different traffic flow rates.
A Quasi-Sequential Cellular Automaton Approach 343<br />
At a certain flow rate, there is a boundary layer at which travel time increases<br />
sharply with flow rate. Thus, an optimal solution to the tollbooth problem is<br />
to choose the minimum number of tollbooths such that the expected rate of<br />
incoming flow corresponds to a point before the boundary layer.<br />
References<br />
Aston, Winifred. The Theory of Traffic Flow. 1966. New York: John Wiley & Sons<br />
Inc.<br />
Campbell, Paul (ed.). 1999. Special Issue: The 1999 Mathematical Contest in<br />
Modeling. The UMAP Journal 20 (3). Lexington, MA: COMAP.<br />
. 2000. Special Issue: The 2000 Mathematical Contest in Modeling.<br />
The UMAP Journal 21 (3). Lexington, MA: COMAP.<br />
Chao, Xiuli. n.d. Design and evaluation of toll plaza systems. http://www.<br />
transportation.njit.edu/nctip/finalreport/TollPlazaDesign.htm .<br />
TranSafety Inc. 1997. Designing traffic signals to accommodate pedestrian<br />
travel. http://www.usroads.com/journals/p/rej/9710/re971002.htm .<br />
Drew, Donald. 1968. Traffic Flow Theory and Control. New York: McGraw-Hill.<br />
Edie, A.C. 1954. Traffic delays at tollbooths. Journal of Operations Research Society<br />
of America 2: 107–138.<br />
Hristova, Hristina. n.d. Lecture Notes. MIT OpenCourseWare. http://ocw.<br />
mit.edu/OcwWeb/Mathematics/18-306Spring2004/LectureNotes/ .<br />
Jiang, Henry. 2003. Traffic flow with cellular automata. NKS SJSU (A New<br />
Kind of Science at San Jose State University). http://sjsu.rudyrucker.<br />
com/~han.jiang/paper/ .<br />
Nagel, Kai, Dietrich Wolf, Peter Wagner, and Patrice Simon. 1998. Twolane<br />
traffic rules for cellular automata: A systematic approach. Physical<br />
Review E 58-2 (August 1998). http://www.sim.inf.ethz.ch/papers/<br />
nagel-etc-2lane/nagel-etc-2lane.pdf .<br />
Orlando–Orange County Expressway Authority. 2003. Mainline plaza characteristics.<br />
http://www.expresswayauthority.com/assets/<br />
STD&Stats%20Manual/Mainline%20Toll%20Plazas.pdf .<br />
Rauch, Erik. 1996. Locality. http://www.swiss.ai.mit.edu/~rauch/dapm/<br />
node1.html .<br />
Sveshnikov, A.A. 1968. Problems in Probability Theory, Mathematical Statistics,<br />
and Theory of Random Functions. New York: Dover Publications.<br />
Tosic, Predrag and Gul Agha. n.d. Concurrency vs. sequential interleavings<br />
in 1-D threshold cellular automata. http://osl.cs.uiuc.edu/docs/<br />
ipdps04/ipdps.pdf .
344 The UMAP Journal 26.3 (2005)<br />
Traffic simulations with cellular automaton model. April 30, 2000. http://<br />
www.newmedialab.cuny.edu/traffic/gridCA1/sld001.htm .<br />
Wainer, Gabriel, and Norbert Giambiasi. n.d. Timed cell-DEVS: Modeling<br />
and simulation of cell spaces. http://www.sce.carleton.ca/faculty/<br />
wainer/papers/timcd.PDF .<br />
Wikipedia. 2005. Toll roads. http://en.wikipedia.org/wiki/Tollroad .<br />
Accessed 2 February 2005.<br />
. 2005. Traffic congestion.<br />
http://www.answers.com/traffic+congestion\&r=67 .<br />
Accessed 2 February 2005.<br />
Wolfram, Steven. 2002. A New Kind of Science. Canada: Wolfram Media Inc.<br />
John Evans, Peter Kramer (advisor), and Meral Reyhan.
The Multiple Single Server Queueing System 345<br />
The Multiple Single Server<br />
Queueing System<br />
Azra Panjwani<br />
Yang Liu<br />
HuanHuan Qi<br />
University of California, Berkeley<br />
Berkeley, CA<br />
Advisor: Jim Pitman<br />
<strong>Summary</strong><br />
Our model determines the optimal number of tollbooths at a toll plaza in<br />
terms of that minimizing the time that a car spends in the plaza.<br />
We treat the toll collection process as a network of two exponential queueing<br />
systems, the Toll Collection system and the Lane Merge System. The random,<br />
memoryless nature of successive car interarrival and service times allows us to<br />
conclude that the two are exponentially distributed.<br />
We use properties of single server and multiple server queuing systems to<br />
develop our Multiple Single Server Queuing System. We simulate our network<br />
in Matlab, analyzing the model’s performance in light, medium, and heavy<br />
traffic for tollways with 3 to 6 lanes. The optimal number of tollbooths is<br />
roughly double the number of lanes.<br />
We also evaluate a single tollbooth vs. multiple tollbooths per lane. The<br />
optimal number of booths improves the processing time by 22% in light traffic<br />
and 61% in medium traffic. In heavy traffic, one tollbooth per lane results in<br />
infinite queues.<br />
Our model produces consistent results for all traffic situations, and its flexibility<br />
allows us to apply it to a wide range of toll-plaza systems. However,<br />
the minimum time predicted is an average value, hence it does not reflect the<br />
maximum time that an individual may spend in the network.<br />
The UMAP Journal 26 (3) (2005) 345–354. c○Copyright 2005 by COMAP, Inc. All rights reserved.<br />
Permission to make digital or hard copies of part or all of this work for personal or classroom use<br />
is granted without fee provided that copies are not made or distributed for profit or commercial<br />
advantage and that copies bear this notice. Abstracting with credit is permitted, but copyrights<br />
for components of this work owned by others than COMAP must be honored. To copy otherwise,<br />
to republish, to post on servers, or to redistribute to lists requires prior permission from COMAP.
346 The UMAP Journal 26.3 (2005)<br />
General Definitions<br />
The Network: The point at which the car enters the queue for toll collection to<br />
the point at which the car is able to drive off with current traffic speed. It<br />
consists of two systems of queues.<br />
Toll-Collection System: The point at which cars arrive at the toll-plaza and<br />
form queues to the point at which they exit the booth after toll collection.<br />
Lane Merge System: The point at which cars leave the tollbooth to enter the<br />
queue to merge back into the tollway lanes, to the point at which they can<br />
drive off with current speed.<br />
Single Server Queueing System: A system with one queue and one server.<br />
Multiple Server System: A system with one queue and multiple servers such<br />
that a customer has the freedom to choose any server available.<br />
Arrival rate: The number of cars per minute per lane that arrive to a network<br />
or system.<br />
Departure rate: The number of cars per minute per lane that depart from a<br />
network or system.<br />
Service or processing: The act of toll collection.<br />
Service rate: The number of cars per minute per booth being served.<br />
Merge rate: The number of cars per minute per lane that merge back into the<br />
tollway lanes.<br />
Total time: The time for a car to pass through the network.<br />
Optimal time: The minimum feasible total time.<br />
Idle time: The time interval during which the attendant is not serving anyone.<br />
General Assumptions<br />
• Car arrival times are independent, identically distributed non-negative random<br />
variables.<br />
• Cars are served first-come-first-served.<br />
• The service times for individual cars are independent, identically distributed<br />
nonnegative random variables with no correlation to the arrival process.<br />
• In the long run, the rate at which cars are served is greater than the rate at<br />
which cars enter the network; otherwise, there would be infinite queues.
The Multiple Single Server Queueing System 347<br />
• There is no limit to the number of cars that can enter the network, because<br />
from the point of view of the network, the road length is arbitrarily large.<br />
• Motorists tend to join the shortest queue in vicinity; hence, in the long run,<br />
the queue length is about the same at every tollbooth.<br />
Variable Descriptions<br />
Table 1.<br />
Table of variables.<br />
S The network of the Toll Collection System and the Lane Merge System<br />
S1 The Toll Collection System<br />
S2 The Lane Merge System<br />
λ1 Average car arrival rate per lane to the S1 queue<br />
λ2 Average car arrival rate per lane to the S2 queue<br />
µ1 Average service rate per lane in S1<br />
µ2 Average merge rate per lane in S2<br />
W Total expected time spent by a car in S<br />
W1 Expected time spent by a car in S1<br />
W2 Expected time spent by a car in S2<br />
ℓ Average length of a vehicle and the safety distance in front of it<br />
ν Traffic speed on the road, independent of tollbooth collection<br />
n The number of lanes in a tollway before the toll plaza<br />
m Number of tollbooths in a toll plaza<br />
k Number of lanes in a tollway after the toll plaza<br />
Our Approach<br />
We assume that the cars arrive according to a Poisson process. The arrival<br />
of a car at a time t does not affect the probability distribution of what occurred<br />
prior to t; hence the system is memoryless [Pitman 1993]. A driver’s decision to<br />
drive on a road at a particular time is independent from that of any other driver;<br />
so the time periods between successive arrivals of vehicles are independent<br />
exponential random variables. If the tollbooth attendant is idle, the driver<br />
“goes into service”; otherwise, the car joins the queue to be served.<br />
Similarly, the server processes cars with successive service times also being<br />
independent exponential random variables. From probability theory, we know<br />
that the sum of two exponential random variables with rates λ and µ is another<br />
exponential random variable, with rate λ + µ.<br />
We apply the theory of exponential queueing systems to develop a model<br />
that predicts the value of m that minimizes W .
348 The UMAP Journal 26.3 (2005)<br />
General Model<br />
A queueing system often consists of “customers” arriving at random times<br />
to some facility where they receive service. They depart from the facility at the<br />
same rate at which they arrive. The network S consists of two systems, the tollcollection<br />
system, S1, where cars arrive and join the queue and the lane-merge<br />
system, S2, where people join the queue to receive the “service” of merging.<br />
Multiple Single Server Queueing System<br />
We employ queueing theory together with continuous-time Markov chains<br />
to build our Multiple Single Server Queueing System, based on the following<br />
reasoning.<br />
When cars get to a toll barrier, they determine which queue to join. In<br />
theory, they can join the shortest queue. In practice, however, they are unlikely<br />
to change too many lanes to join a shorter queue if there are other cars on the<br />
road. In most cases, they are limited to entering the queue directly in front<br />
of them, or a queue to their immediate left and right. Furthermore, under<br />
the assumption that the queue lengths are approximately the same for all the<br />
queues, they are most likely to join the queue directly ahead.<br />
The process is similar to a single-server queueing system, but the fact that<br />
they have somewhat of a choice in choosing the tollbooth also gives this process<br />
properties of a multiple server queueing system. However, multiple-server<br />
queueing systems allow for only one queue and the freedom to choose any<br />
server that is not occupied. Our system does not fall exactly under either<br />
one of the two categories; hence, we coin the name “Multiple Single-Server<br />
Queueing System” for the systems in our network, which has the following<br />
properties:<br />
• It consists of several parallel single-service queues.<br />
• Each queue has a “super server” that has a processing rate of µ1 × m/n.<br />
In Figure 1, each colored box represents the probability that a car in a lane<br />
uses a tollbooth of that color. The bigger the box, the higher the chance of choosing<br />
that tollbooth. Most drivers use the tollbooth right ahead of them, though<br />
a few would choose the tollbooth to the left or right (with equal probability).<br />
The probability that a car uses a tollbooth that farther away is negligible. As<br />
we can see from Figure 1, the total areas of all the colored boxes representing<br />
the probabilities of going through the tollbooths are eventually the same from<br />
lane to lane. This implies that the service rate is the same for every tollbooth.<br />
Hence, in the long run, each lane is processed at the rate µ1 × m/n.<br />
Similarly, the process of waiting in a queue to merge back into the k lanes<br />
of the tollway after paying the toll can also be considered as a Multiple Single-<br />
Server Queueing System with processing rate µ2 × k/m. To allow for more<br />
flexibility in our model, k may or may not equal n.
Model Development<br />
The Multiple Single Server Queueing System 349<br />
Figure 1. Each lane has equal probability over all cars.<br />
First Choice<br />
Second choice<br />
Tollbooth<br />
Probability<br />
The total waiting W is the sum of the times to pass through the two systems,<br />
i.e., W = W1 + W2.<br />
Based on the queueing theory equation [Ross 2003]<br />
W = 1<br />
µ − λ ,<br />
and the discussion of service rates, we find<br />
1<br />
W = W1 + W2 = mµ1<br />
+<br />
− λ1<br />
n<br />
Derivation of the Service Rates<br />
kµ2<br />
m<br />
1<br />
− λ2<br />
We assume that on average each tollbooth attendant takes a fixed amount<br />
of time t to collect a toll, so µ1 =1/t.<br />
For heavy traffic situations, we also take into account driver reaction time<br />
r before stepping on the gas and moving up to the booth. We incorporate this<br />
delay into the service time to get<br />
µ1 = 1<br />
t + r .<br />
We estimate t ≈ 5.5 s and r ≈ 2.5 s.<br />
Calculating µ2 is a little trickier. We take into account ν, which we consider<br />
to be determined independently from the toll plaza system. This is justifiable,<br />
since whether a toll plaza interrupts a tollway or not, ν varies considerably<br />
depending on different traffic situations. Since ν is in miles per hour, and we’re<br />
interested in cars per minute, we first transform the velocity into meters per<br />
minute. We also consider the fact that the car is going from 0 mph to get up to<br />
.
350 The UMAP Journal 26.3 (2005)<br />
ν, hence we use the average speed of the car during the time that it must catch<br />
up to the tollway traffic. We then divide the velocity by ℓ, which depends on ν,<br />
because the safety distance needed for cars at high speed is much greater than<br />
that for low speeds. Thus, we obtain<br />
µ2 = ν<br />
2ℓ .<br />
Since cars from the m lanes of the toll plaza must merge back into the k<br />
lanes of the highway, we calculate the overall merge rate per lane, µ2 × k/m,<br />
as described earlier, to be<br />
k ν<br />
m 2ℓ .<br />
Derivation of the Second Arrival Rate<br />
Since drivers join S2 as soon as they depart S1, the rate λ2 is the same as the<br />
departure rate from S1. Now, consider the departure rate from S1. Ifthere are<br />
n lanes in the system and nλ1 ≥ mµ1, then all m servers are busy. Since each<br />
server works at rate µ1, the total departure rate is mµ1. Onthe other hand, if<br />
nλ1 λ1 and<br />
n ν<br />
m 2ℓ >λ1.
The Multiple Single Server Queueing System 351<br />
Hence the feasible range for the number of tollbooths is<br />
<br />
λ1n<br />
, nν<br />
<br />
.<br />
2λ1ℓ<br />
µ1<br />
For a single tollbooth per lane, we set m = n; the resulting W is<br />
W = W1 + W2 =<br />
1<br />
µ1 − λ1<br />
1<br />
= ν .<br />
− λ1<br />
2ℓ<br />
The model is still a system of two queues. Though the merge factor n/m is<br />
diminished, the cars must still catch up to traffic speed and may have to wait<br />
in a queue to do so.<br />
Data Analysis<br />
We implement our algorithm for W in Matlab using n = 3, 4, 5, and 6,<br />
corresponding to most tollways. We vary λ1 from 0.5 to 5 cars/minute for<br />
light traffic, from 5 to 10 cars/minute for medium traffic, and from 10 to 15<br />
cars/minute for heavy traffic. We establish the range of feasibility for m for<br />
each traffic situation. We then determine the number that gives minimal W .<br />
Parameter Values<br />
We set µ1 =11cars/min for the light and medium traffic; we set µ1 =<br />
7.5 cars/min for heavy traffic, to account for the service time plus the reaction<br />
time of the cars waiting in queue.<br />
To determine µ2, weset ν =60mph for light traffic situations, since most<br />
heavily trafficked tollways have speed limits between 50 and 70 mph. We set<br />
ν =46mph for medium traffic and ν =32mph for heavy traffic. The average<br />
car length is between 3.5 and 5.5 m [Edwards and Hamson 1990], hence we<br />
set car length in our model to 4 m. We set the safety distance to 20 m for light<br />
traffic, 14 m for medium traffic, and8mfor heavy traffic. The optimal number<br />
of tollbooths for the different levels of traffic and numbers of highway lanes<br />
are shown in Table 2.<br />
Table 2.<br />
Optimal numbers of tollbooths.<br />
Traffic Number of lanes<br />
3 4 5 6<br />
Light 5 7 9 10<br />
Medium 5 9 9 11<br />
Heavy 9 9 11 13
352 The UMAP Journal 26.3 (2005)<br />
Regardless of the traffic level, the optimal number of tollbooths is always<br />
greater than the number of highway lanes. However, for light traffic, the difference<br />
between the average wait for optimal number of tollbooths vs. the average<br />
wait for m = n is only about 2 s.<br />
For medium traffic, though, the differences (≈15 s) are large enough to<br />
conclude that having extra tollbooths would be a wise decision.<br />
For heavy traffic, setting single tollbooth per lane would result in infinite<br />
waiting queues for all situations examined.<br />
Detailed Analysis of a Six-Lane Tollway<br />
We conduct a detailed study for a six-lane tollway. The general trends<br />
observed for this dataset are typical for any number of lanes. We generate<br />
plots for the three traffic levels with number m of tollbooths as independent<br />
variable and W as dependent variable. We keep λ constant for each curve;<br />
hence we produce a set of level curves that show the optimal value for m based<br />
on the λs.<br />
As the traffic gets heavier, the region of feasibility for m gets smaller. This is<br />
because having too few tollbooths causes an infinite waiting time at S1, while<br />
having too many tollbooths causes an infinite wait at S2, due to the influx of<br />
cars processed in S1.<br />
For light traffic, the difference in Wave for m =5and m =18is merely 2 s.<br />
For medium traffic, a shift from the optimal number m =10causes a more<br />
dramatic increase in the time spent in the network. For heavy traffic, the range<br />
of feasibility reduces to a small region centered around the optimal number<br />
m =13—namely 12, 13, or 14 (Figure 2). The onset of heavy traffic both before<br />
and after the tollbooth excludes more extreme values of m from the feasible<br />
range. The beauty of the results is that the optimal number of tollbooths is the<br />
same for varying arrival rates.<br />
Conclusion<br />
It is better to have more than one tollbooth per lane. But having too many<br />
tollbooths per lane is just as bad. We recommend that for frequently traveled<br />
roads, the number of tollbooths available should be the maximum of all the<br />
optimal tollbooth numbers generated by our algorithm. The number of booths<br />
open can then vary for different traffic flows during the day.<br />
For toll roads that usually have light traffic, having a single tollbooth per<br />
lane reduces the cost of building and running the toll plaza; reduction in waiting<br />
time does not justify more tollbooths.
The Multiple Single Server Queueing System 353<br />
Figure 2. Wait vs. number of tollbooths for heavy traffic on a 6-lane tollway, for various arrival<br />
rates.<br />
Strengths of Our Model<br />
• Our model withstands many variations in parameters.<br />
• Given reasonable values for the parameters, the algorithm generates realistic<br />
results for the optimal number of tollbooths.<br />
• When we vary within the range of a specific traffic situation, the optimal<br />
solution is consistent for each in each situation.<br />
• The optimal number of tollbooths differs among traffic levels, reflecting the<br />
fact that varying the number of tollbooths has a significant impact on waiting<br />
time.<br />
• The algorithm, though rich in theory, is very easy to implement and test.<br />
Weaknesses<br />
• We assume that the arrival rate is less than the service rate at each system.<br />
In the long run, this assumption must hold in order to avoid infinite queues;<br />
but there can be intervals during when arrivals overwhelm the service rate.
354 The UMAP Journal 26.3 (2005)<br />
Hence, though the average waiting time for the optimal solution may be<br />
small, the maximum waiting time for some cars may be rather large.<br />
• Our model’s range of feasibility is limited by the rates at which the cars are<br />
served at the two systems.<br />
• Our model predicts the optimal tollbooth numbers based on the minimal<br />
time, but this may not be the most cost-effective solution.<br />
• We don’t incorporate the electronic payment passes that many toll systems<br />
use to minimize waiting time.<br />
References<br />
Edwards, Dilwyn, and Mike Hamson. 1990. Guide to Mathematical Modeling.<br />
Boca Raton, FL: CRC Press.<br />
Pitman, Jim. 1993. Probability. New York: Springer-Verlag.<br />
Ross, Sheldon M. 2003. Introduction to Probability Models. San Diego, CA: Academic<br />
Press.<br />
Azra Panjwani, Jim Pitman (advisor), HuanHuan Qi, and Yang Liu.
TwoTools for Tollbooth<br />
Optimization<br />
Ephrat Bitton<br />
Anand Kulkarni<br />
Mark Shlimovich<br />
University of California, Berkeley<br />
Berkeley, CA<br />
Advisor: L. Craig Evans<br />
<strong>Summary</strong><br />
TwoTools for Tollbooth Optimization 355<br />
We determine the optimal number of lanes in a toll plaza to maximize the<br />
transit rate of vehicles through the system. We use two different approaches,<br />
one macroscopic and one discrete, to model traffic through the toll plaza.<br />
In our first approach, we derive results about flows through a sequence of<br />
bottlenecks and demonstrate that maximum flow occurs when the flow rate<br />
through all bottlenecks is equal. We apply these results to the toll-plaza system<br />
to determine the optimal number of toll lanes. At high densities, the optimal<br />
number of tollbooths exhibits a linear relationship with the number of toll lanes.<br />
We then construct a discrete traffic simulation based on stochastic cellular<br />
automata, a microscopic approach to traffic modeling, which we use to validate<br />
the optimality of our model. Furthermore, we demonstrate that the simulation<br />
generates flow rates very close to those of toll plazas on the Garden State Parkway<br />
in New Jersey, which further confirms the accuracy of our predictions.<br />
Having the number of toll lanes equal the number of highway lanes is<br />
optimal only when a highway has consistently low density and is suboptimal<br />
otherwise. For medium- to high-density traffic, the optimal number of toll lanes<br />
is three to four times the number of highway lanes. Both models demonstrate<br />
that if a tollway has lanes in excess of the optimal, flow will not increase or<br />
abate.<br />
Finally, we examine how well our models can be generalized and comment<br />
on their applicability to the real world.<br />
The UMAP Journal 26 (3) (2005) 355–371. c○Copyright 2005 by COMAP, Inc. All rights reserved.<br />
Permission to make digital or hard copies of part or all of this work for personal or classroom use<br />
is granted without fee provided that copies are not made or distributed for profit or commercial<br />
advantage and that copies bear this notice. Abstracting with credit is permitted, but copyrights<br />
for components of this work owned by others than COMAP must be honored. To copy otherwise,<br />
to republish, to post on servers, or to redistribute to lists requires prior permission from COMAP.
356 The UMAP Journal 26.3 (2005)<br />
Statement of Problem<br />
We are asked for a model that determines the optimal number of tollbooths<br />
in a toll plaza located on an n-lane tollway. The two criteria that we use for<br />
evaluating optimality are total throughput in number of cars and average transit<br />
time for individual cars to pass through the plaza.<br />
Definitions<br />
Number of highway lanes, n: The number of lanes on the highway entering<br />
and leaving the plaza.<br />
Number of transit lanes, m: The number of tollbooths and lanes in the toll<br />
plaza.<br />
Entry zone: The m-lane region of the toll plaza between the entry tollway and<br />
the tollbooths.<br />
Merge zone: The m-lane region of the toll plaza between the tollbooths and<br />
the exit tollway.<br />
Flow or throughput, q: Number of cars per second which pass through a given<br />
point x in our system.<br />
Backlog B: Number of queued cars waiting to enter the tollbooths or exit the<br />
plaza.<br />
Tollbooth processing time, τi: The number of seconds required, on average,<br />
for a car to pull into, pay, and exit a tollbooth i.<br />
Density ρ(x): number of vehicles per square meter in a given region.<br />
m ∗ : the optimal number of tollbooth lanes.<br />
Bottleneck capacity, qb: the maximum number of cars per second that can pass<br />
through a given bottleneck b.<br />
Assumptions<br />
• A toll plaza consists of n highway lanes diverging into m toll lanes and<br />
converging back into n highhway lanes. The toll plaza is sufficiently long to<br />
permit cars to reach all of the m tollbooths.<br />
• Each tollbooth controls one lane and can serve at most one car at a time.<br />
• Exit from the tollbooths is not metered.
TwoTools for Tollbooth Optimization 357<br />
• Drivers seek to move through the toll plaza as quickly as possible while<br />
maintaining safety.<br />
• Within the toll plaza, all vehicles move at the safest possible maximum speed<br />
for a given density, since drivers seek to avoid accidents.<br />
Model Development<br />
Motivations<br />
There are two general approaches to modeling traffic motion:<br />
Macroscopic approaches begin with some observations about aggregate traffic<br />
behavior and attempt to approximate traffic behavior as a continuous flow<br />
over some large region or large time period.<br />
Microscopic approaches attempt to model driver and car behavior and use this<br />
information in aggregate as the basis for modeling the large-scale behavior<br />
of traffic.<br />
The microscopic approach often hinges on a large number of parameters<br />
that may be difficult to model accurately. For example, driver decision-making<br />
strategies, driving styles, preferred following distances, and the physical parameters<br />
of individual vehicles are highly variable.<br />
We first pursue the macroscopic approach. Such approaches are traditionally<br />
used for modeling traffic behavior over long stretches of highway, and to<br />
model traffic jams, so it may seem that such an approach is inapplicable to a<br />
setting where highway length is not large. However, there are two advantages:<br />
• Properties that vary significantly between drivers and vehicles are averaged<br />
out if we let the system run for a sufficiently long time and it approaches a<br />
steady-state equilibrium.<br />
• At equilibrium, we can use the total throughput of cars through the toll plaza<br />
over a given duration as a metric for the disruption it causes.<br />
We construct a theoretical flow model of the tollbooth plaza to determine<br />
the effect of varying numbers of tollbooth lanes for given numbers of transit<br />
lanes, and use this to predict optimal conditions.<br />
The downside of the macroscopic approach is that traffic flow is not necessarily<br />
continuous, so approximations made in the model may not reflect reality.<br />
The best way to check them is to contrast them with real traffic data. As a result,<br />
we eventually construct a full microscopic approach to generate realistic<br />
data to test our continuous model: We design a cellular-automata simulation,<br />
constructed with an independent set of driver behaviors, to verify our macroscopic<br />
model. To represent the effect of unknown variables, we introduce a<br />
small random component to the simulation.
358 The UMAP Journal 26.3 (2005)<br />
Flow in the Plaza<br />
Initial Observations and Conservation of Flow<br />
We begin by defining the flow q of traffic as the number of cars per second<br />
to pass through a perpendicular cross-section across all lanes of the highway,<br />
dx. Bydefinition, flow follows the equation<br />
q = ρv,<br />
where v is the average vehicle speed and ρ is the average vehicle density.<br />
Two bottlenecks limit the flow in every toll plaza: the first is at the tollbooths,<br />
caused by the time required for cars to stop and pay the toll, and the second<br />
occurs when the lanes exiting the tollgates merge back into the highway.<br />
All traffic that enters the plaza must eventually exit the plaza. Treating the<br />
motion of vehicles through the plaza as a continuous flow of traffic, we can<br />
represent this fact with the following lemma.<br />
Lemma. Forany given cross-sectional slice dx of the system,<br />
<br />
all time (qout − qin) dx =0.<br />
Using the relation q = ρv, wecan arrive at the following relationship, following<br />
the method of Kuhne and Michalopoulos [2002, Ch. 5, 5–8]:<br />
∂ρ<br />
∂t<br />
+ ∂q<br />
∂x<br />
=0. (1)<br />
This is the conservation of traffic flow equation given by Kuhne and Michalopoulos<br />
[2002, Ch. 5, 5–8], among others.<br />
Bottlenecking Constraints on Flow<br />
Bottlenecks along the highway restrict the maximum rate of traffic flow, as<br />
described in the following theorem:<br />
Bottleneck Theorem. The flow of vehicles through any system void of sources<br />
and sinks is bounded by the minimum of the bottleneck capacities along the<br />
path.<br />
Proof: Suppose that the flow at some point dx along the highway is in excess<br />
of the maximum of all bottleneck capacities ahead of it, i.e.<br />
q(x) > max{qbottleneck1 ,... ,qbottlenecki },<br />
where i is the number of bottlenecks ahead of dx. Since in the steady-state model<br />
all points flow at the same rate, this would mean that max{qbottleneck} = q(x),<br />
which is a contradiction.<br />
This result is used several times in the construction of our model.
A Queueing Model Based on Flow<br />
TwoTools for Tollbooth Optimization 359<br />
Since the rate of flow is constrained by the bottleneck of minimum capacity, it<br />
follows that the throughput is determined by the relative rates of the bottleneck<br />
at the tollbooths and at the point where the highway retreats back to its original<br />
size (i.e., the “merge point”).<br />
This observation reduces the problem to examining throughput solely at<br />
the endpoints of the “problem zone,” without need to consider the behavior of<br />
traffic flow between those points. Thus, we can proceed simply by modeling<br />
the behavior of traffic at these two points.<br />
Calculating Backlogs<br />
We find the number of cars at each of these bottlenecks at any given time, so<br />
as to determine when a backlog occurs. For an arbitrary segment of the m-lane<br />
section of the toll plaza, we integrate the conservation of flow equation (1) with<br />
respect to x over the length of the road segment (with m lanes). This gives the<br />
instantaneous number of vehicles within the segment, B(t):<br />
<br />
B(t) = mρ(x, t)dx.<br />
x<br />
From this we obtain the rate at which the backlog or pileup in the merge zone<br />
is growing:<br />
dB(t)<br />
dt =<br />
<br />
qarrival − qdeparture, if qarrival >qdeparture;<br />
(2)<br />
0, otherwise,<br />
where qarrival is the rate (in cars/s) at which cars enter the segment and qdeparture<br />
is the rate at which they are exit. It then follows that:<br />
Theorem (Flow Equilibrium). To prevent congestion from building at a bottleneck<br />
(i.e., to keep B(t) =0)while maintaining maximum system throughput,<br />
it must be that<br />
where qdeparturemax<br />
throughput.<br />
qarrival ≤ qdeparturemax ,<br />
is the bottleneck capacity and thus the maximum system<br />
Proof : Consider the following three possible cases:<br />
Case 1: Let qarrival >qdeparture max . Then by (2), the number of cars building up<br />
in the system will increase at a rate of qarrival − qdeparture > 0.<br />
Case 2: Let qarrival
360 The UMAP Journal 26.3 (2005)<br />
Case 3: Let qarrival = qdeparture max . Similar to Case 2, a backlog does not grow,<br />
and the system throughput is qarrival. Note that, however, qarrival, and thus<br />
system throughput, is at a maximum while preventing congestion at the<br />
bottleneck; therefore, this is clearly the optimal case.<br />
Applications to Toll Plaza System<br />
qini<br />
qtollsi<br />
Adapting this general result to our model, we define<br />
to be the flow in cars/second entering the system in lane i,<br />
to be the flow or turnover rate of tollbooth i, and<br />
qouti to be the flow leaving the system (at or after the merge point) in lane i.<br />
Our model considers the interaction between the two bottlenecks. Upon<br />
investigation, two observations become apparent:<br />
1. The maximum flow, qmax through a cross-sectional slice of the highway dx<br />
is independent of the road structure before that point. In other words, the<br />
maximum flow capacity is fixed solely by the number of lanes at that point<br />
and not the number of lanes merging or diverging into it.<br />
2. The only cross-sectional slice dx at which the maximal flow can be varied<br />
(by the model) is at the tollbooths; this is done by changing the number of<br />
tollbooths, which directly results in a change in the number of cars that can<br />
be processed per unit time.<br />
With this in mind we apply the Flow Equilibrium Theorem. We divide<br />
the system into two segments, the first from (−∞,xtolls) and the second from<br />
(xtolls,xmerge), where xtolls is the point x along the highway where the tollbooths<br />
are and xmerge is the point where the m lanes of the toll plaza merge into the n<br />
lanes of the highway.<br />
The qarrival of the first segment (into the tollbooths) is simply qin, and qdeparture =<br />
qtolls. For the second segment, qarrival = qtolls and qdeparture = qout.<br />
Since qtolls = m/τ, only the number of tollbooths and their individual<br />
turnover rates τ determine the flow entering the merge zone. By observation<br />
(1), we note that the bottleneck capacity of the merge point, qoutmax ,is<br />
independent of m and qtolls;itismerely a property of an n-lane highway.<br />
We are therefore interested in how qtolls affects the flow of cars through the<br />
merge zone. By observation (2), when qtolls >qout the backlog increases at a<br />
rate of<br />
dB(t)<br />
dt = qtolls − qout.<br />
The backlog continues to grow until the entire merge zone is filled, and then it<br />
spills out into the segment before the tolls. This buildup does not fully dissipate<br />
until qin reduces to below qoutmax ,orinother words, until the incoming flow
TwoTools for Tollbooth Optimization 361<br />
rate is below the bottleneck capacity of the tightest bottleneck (such as at the<br />
end of rush hour).<br />
To prevent the occurrence of this effect, let qtolls ≤ qout, which allows traffic<br />
to flow through the merge zone without causing backlog. However, when<br />
qtolls < qout, the merge point is not operating at maximum flow; therefore,<br />
letting qtolls = qout is optimal. Surprisingly, however, we show later that this is<br />
actually a lower bound on qtolls.<br />
From this result, we get<br />
qout = nqoutmax = qtolls = m∗<br />
τ ,<br />
where m ∗ is the optimal number of tollbooths for an n-lane highway. Solving<br />
for m ∗ ,weget<br />
m ∗ = nτqoutmax .<br />
Performance When the Number of Tollbooths Exceeds m ∗<br />
We now consider toll plaza performance when the number of tollbooths<br />
m exceeds the predicted optimum m ∗ . This investigation is necessary. For<br />
example, if our model were to predict m ∗ slightly above the actual value, a<br />
backlog would build within the merge zone, but it might build so slowly that<br />
by the time its size became critical, the rush-hour mass of vehicles would already<br />
have dissipated.<br />
As previously shown, when m>m∗ and qin >qtollsmax ,abacklog builds in<br />
the merge zone at a rate of (qtollsmax −qout). Until the merge zone fills completely<br />
with vehicles (when vehicle density is at a maximum), the tollbooths continue<br />
to process vehicles at their maximum rate, qtollsmax = m/τ. In this case, the<br />
backlog at the tolls grows at a rate of (qin − qtollsmax ).<br />
As a result, the effective backlog growth is the sum of the backlog growth<br />
rates at each bottleneck:<br />
d<br />
dt backlogeffective = d<br />
dt backlogtolls + d<br />
dt backlogmerge<br />
=(qin − qtollsmax )+(qtollsmax − qout)<br />
=(qin − qout).<br />
Interestingly, this result implies that the total backlog of the system is entirely<br />
dependent on the rate at which vehicles enter and the maximum rate at which<br />
they can leave (i.e., the bottleneck capacity of the tightest bottleneck). Therefore,<br />
as long as the tollbooths do not limit the total flow capacity of the system, the<br />
exact rate at which the tollbooths process vehicles does not affect the system<br />
flow. This line of reasoning leads us to the following theorem:<br />
Theorem (Lower bound on m ∗ ). The optimal number of tollbooths for an<br />
arbitrary n-lane highway is greater than or equal to m ∗ = nτqoutmax.
362 The UMAP Journal 26.3 (2005)<br />
Maximum Flow on an n-Lane Highway<br />
Garber and Hoel [1999] observe empirically an inverse relationship between<br />
ρ and v, and several models have been proposed to describe this behavior. It is<br />
generally accepted that any such model must exhibit the following properties:<br />
• Flow is zero when density is zero.<br />
• As density increases to some critical value, so does flow.<br />
• Past this critical density the flow begins to decrease.<br />
• Flow cannot decrease beyond some minimum value.<br />
Let vmax be the maximum velocity of cars traveling freely on the highway<br />
(generally the speed limit), and let ρmax be the maximum number of cars (i.e.,<br />
jam-packed) per unit area of highway (a constant).<br />
One of the more popular models, proposed by Greenshield [Garber and<br />
Hoel 1999], establishes a linear relationship between the two:<br />
<br />
v = vmax 1 − ρ<br />
<br />
⇒<br />
<br />
q = ρvmax 1 − ρ<br />
ρmax<br />
ρmax<br />
where vmax is the maximum speed at which cars tend to travel when flowing<br />
undisrupted along the highway, generally taken as the speed limit.<br />
A second popular model, introduced by Greenberg [Garber and Hoel 1999],<br />
proposes a logarithmic relationship:<br />
<br />
<br />
ρ<br />
ρ<br />
v = vmax ln<br />
⇒ q = ρvmax ln . (3)<br />
ρmax<br />
ρmax<br />
While accurate in certain cases, these models do not seem to represent effectively<br />
the motion of cars through toll plazas, because they both model the flow<br />
as zero when density has reached its maximum. Although density will tend to<br />
some maximum, flow will asymptotically approach but never reach zero, since<br />
some number of cars will still flow out of the system over a long enough time<br />
interval. This discrepancy is a direct result of the limitations inherent in treating<br />
traffic as a continuous flow. Determining the precise relationship between<br />
ρ and v is a relatively complex modeling task beyond the scope of this paper,<br />
so we accept Greenberg’s model with the restriction that if ρ = ρmax, flow will<br />
approach some low constant value instead.<br />
To determine a rough estimate of the maximum flow through the merge<br />
point (or any n-lane highway for that matter), we use Greenberg’s model. To<br />
find the maximum flow qmax,wedifferentiate (3):<br />
d<br />
dρ q(ρ) =vmax<br />
<br />
ρmax<br />
log − vmax =0<br />
ρ<br />
Solving for ρ, weget ρ = ρmax/2. Therefore, flow is maximized for density<br />
ρmax/2, which gives<br />
qmax = ρmaxvmax<br />
.<br />
2<br />
<br />
,
Streamlined Flow Model<br />
TwoTools for Tollbooth Optimization 363<br />
We made the assumption in the previous section that flow is distributed<br />
uniformly among all lanes—that is, an equal number of cars pass through each<br />
lane per second. However, in real toll plaza systems there are conditions when<br />
this does not apply. For example, on New Jersey’s Garden State Parkway users<br />
are restricted to movement between sets of individual highway lanes, before<br />
and after the tollbooths, by lane dividers. As a result, sets of lanes operate<br />
independently of each other. Moreover, one or more lanes may be reserved for<br />
low-speed vehicles (recreational vehicles or large trucks) or high-speed traffic<br />
(electronic toll collection, motorcycles, buses, or carpools).<br />
To generalize our model, we relax this assumption to account for varying<br />
flows between lanes of traffic. We divide the total flow through the tollbooths,<br />
and the total outgoing flow through the exit, into individual lane flows, so that<br />
m<br />
qtolls = qtollsi , qout<br />
n<br />
= qexitj .<br />
i=1<br />
As observed in the Bottleneck Theorem, nolane can flow faster than qmax.<br />
However, by conservation of traffic flow (1), total traffic flow through the system<br />
remains the same, even though streams of traffic may move at different rates.<br />
We must also consider what happens when lanes merge towards the exit<br />
of the toll plaza. Whereas in the queueing theory model we were allowed to<br />
consider only the flow at two points—qexit and qtoll—we must now also consider<br />
the flow rate at all points where two or more lanes merge into one.<br />
The flow rate at a merge point can never exceed qmax, the maximum flow<br />
for a single lane. According to the results derived earlier in the basic model,<br />
the rate of flow through each lane equals the rate of the slowest bottleneck<br />
ahead. However, it is the combined rate of two merging lanes that exceeds the<br />
lane bottleneck, not each individual lane, so naively setting qin = qmax would<br />
incorrectly increase the rate of the premerged lane to match the bottleneck.<br />
As a result, each lane can contribute at most a decreased quantity such<br />
that the sum of the two lanes equals the bottleneck capacity. A simple way<br />
to represent this behavior is to allow each to contribute a proportion of flow<br />
relative to their combined size:<br />
q1<br />
q2<br />
q1reduced = qmax , q2reduced = qmax .<br />
q1 + q2<br />
q1 + q2<br />
Thus, when both flows would normally overfill the lane into which they<br />
merge, each lane’s contribution to that lane’s flow, qout, will be proportional to<br />
its percentage of the total amount of flow present, without ever exceeding qmax.<br />
This observation lends itself to a simple recursive function in modeling toll<br />
plaza traffic as an aggregate of independent flows. Therefore, predictions of<br />
system behavior with introduction of electronic toll collection lanes and other<br />
flow-monitored lanes are significantly simplified, by applying this model at all<br />
steps of the merging process (i.e., by first merging every set of two lanes, and<br />
then merging the following two, etc.).<br />
j=1
364 The UMAP Journal 26.3 (2005)<br />
Simulation<br />
Motivations for a Discrete Simulation<br />
To validate the continuous model, we create a discrete simulation using<br />
cellular automata to generate traffic behavior. Whereas our earlier models<br />
approximate car flux as continuous, the cellular automata simulation treats<br />
individual vehicles as distinct entities that behave according to well-defined<br />
simple rules. Since the discrete model is based on an independent set of intuitions<br />
about the system and how it behaves, any agreement between the two<br />
models will suggest a high degree of accuracy in our modeling efforts.<br />
Overview<br />
The simulation runs on a two-dimensional grid of points, each of which<br />
corresponds to a width and length slightly greater than the average car size.<br />
The simulation takes in parameters that determine the geometry of the toll plaza<br />
as well as a probability, p, that a car enters the toll plaza in a given lane. When<br />
populating the grid, each cell can be one of four types and behaves according<br />
to its corresponding set of rules:<br />
Free: a transient place holder when block is unoccupied.<br />
Barrier: a boundary point of the toll plaza; this cell never changes.<br />
Toll block: a tollbooth.<br />
Car: a cell occupied by a vehicle.<br />
Rules of State Evolution<br />
The rules that create the next generation of cells (next state of the grid) from<br />
time t to t +1are:<br />
• All cars travel at a constant speed of 1 forward cell per time step.<br />
• A car can change lanes and move forward on the next step if there is an open<br />
adjacent cell to its side and an open cell along the appropriate diagonal.<br />
• A car can stay in the same lane if the cell ahead is free, if the car in front of<br />
it moves forward on that step, or if it is in front of the toll and its toll delay<br />
has expired.<br />
• As the cells in the entry of the toll plaza are freed by the evolution of the grid,<br />
at each time step new cars arrive in these with probability p, the density of<br />
incoming cars.
Stochastic State Evolution<br />
TwoTools for Tollbooth Optimization 365<br />
We use random variables to make the system nondeterministic. This more<br />
closely represents real-world simulations where exact car path is unpredictable<br />
and also attempts to account for the wide range of parameters relating to driver<br />
psychology, variations in vehicles, and variations in service time in paying the<br />
toll. To generate this effect, we implement the following rules:<br />
1. Each toll processes a car at a random rate each time, with distribution centered<br />
at τ =3:<br />
<br />
0.25, x ∈{2, 4};<br />
p(x) =<br />
0.5, x ∈{3}.<br />
2. Cars switch lanes at random with some assigned probability, but their decision<br />
is influenced by the desirability of the target lane.<br />
3. The arrival of cars into a lane is a Poisson process with rate λ, aparameter<br />
to the simulation.<br />
Reporting<br />
We run the simulation for 1,000 time steps. It returns total car throughput,<br />
total waiting time, average waiting time, total transit time, and the density of<br />
cars in each section of the system (i.e., before, within, and after the toll plaza).<br />
Sample simulation run<br />
Cars are released at t =0and proceed toward the tollbooths. Upon entering<br />
the diverge zone, cars change lanes and spread out to minimize their total wait<br />
time at the tolls.<br />
Depending on the number n of highway lanes and the number m of tollbooths,<br />
traffic eventually reaches an equilibrium flow, or else flow is reduced<br />
by the bottlenecks and backlog begins to grow. In our figures, the color of the<br />
vehicle designates the amount of time spent waiting in the system, with bright<br />
green the least, dark green moderate time, and bright red the most.<br />
The model supports varying traffic density over time; we ran our simulations<br />
with arrival densities of 15%, 50%, and 85% percent.<br />
Simulation Sample Images<br />
Simulation sample activity is illustrated in Figure 1.
366 The UMAP Journal 26.3 (2005)<br />
(a)<br />
m=5<br />
(b)<br />
m=11<br />
(c) m=13 (d) m=15 (e) m=17 (f) m=19<br />
(g) m=21 (h) m=23<br />
Figure 1. Simulation at step 1000 for n=5.
Running the Simulation<br />
TwoTools for Tollbooth Optimization 367<br />
We ran the simulation for t = 1000 timesteps, with τ =3steps, for all possible<br />
tollway sizes from n =1to n =8, and for m = n to 4n (for small n)orto3n (for<br />
large n). For each highway size, we ran the simulation at 85%, 50%, and 15%<br />
density. We repeated this process 5 times for the sake of statistical significance.<br />
For a timestep of 1 s, a single run of the simulation corresponds to about 17 min<br />
of traffic.<br />
Over each set of conditions, we track the total throughput of cars. We then<br />
compare the throughput achieved using m tollbooth lanes on a given n-lane<br />
tollway over the entire 1000-s period.<br />
Results and Analysis<br />
Model Predictions vs. Simulation Results<br />
To compare further the accuracy of our theoretical model and our discrete<br />
simulation, we compare experimental data collected from the simulation with<br />
our model’s predictions for the corresponding number of highway lanes n. To<br />
do this, we must make the following parameter assumptions.<br />
• The average vehicle length plus its separation distance from the vehicle<br />
ahead of it is approximately 15 ft.<br />
• At high density, vehicles travel in the merge zone on average at 15 mph.<br />
• In correspondence with the simulation, the average processing time at the<br />
tolls is τ =3s/car.<br />
Computing the model’s predictions based on these parameters and running the<br />
simulation for from one to seven highway lanes yields the results in Table 1.<br />
The values for m ∗ are the minimum values for which adding additional lanes<br />
does not alter performance significantly. [EDITOR’S NOTE: The experimental<br />
graphs used to derive these values are omitted here.]<br />
Figure 3 shows that our flow model is validated as an accurate long-term<br />
predictor of traffic behavior for high density scenarios (p = .85). We believe<br />
that the difference between the continuous model prediction and the observed<br />
value in the simulation stems from uncertainty in the value of the parameter<br />
qmax. Our prediction of qmax =4was accurate only for the high-density case.<br />
For the low-density case, we almost never experience the conditions caused<br />
by qmax—clogging at the merge points—and so our model does not apply.<br />
The continuous flow model does not apply when traffic flow has significant<br />
variations in speed, when density cannot be considered a regular flow.<br />
Our flow model accurately predicts the observed optimum to within 3 lanes<br />
for high-density traffic. From this, we see a high level of agreement between
368 The UMAP Journal 26.3 (2005)<br />
Table 1.<br />
Experimentally observed optimal number of lanes for various traffic densities vs. predicted<br />
optimal number ⌊m ∗ ⌋ of lanes. There is a rough one-to-four relationship between the number of<br />
highway lanes and the optimal number of tollbooths.<br />
Highway lanes Simulation density ρ ⌊m ∗ ⌋<br />
.15 .50 .85<br />
1 1 4 5 4<br />
2 2 6 10 8<br />
3 3 9 13 12<br />
4 4 10 16 16<br />
5 5 13 18 20<br />
6 6 14 21 24<br />
7 7 16 25 28<br />
Figure 3. Observed optimal number m ∗ of toll lanes for given number n of highway lanes.
TwoTools for Tollbooth Optimization 369<br />
the two models, even though they operated on completely independent assumptions.<br />
These results suggest that our model predicts the optimal number<br />
of tollbooths for an arbitrary n-lane tollway fairly accurately.<br />
Total Throughput vs. Average Wait Time<br />
For every simulation that we ran, whenever throughput is higher or lower<br />
for a given pair of (m, n, ρ), average transit time is correspondingly higher or<br />
lower. We conclude that total throughput and average wait time are highly<br />
correlated. As a result, optimizing either of them results in good performance<br />
relative to the other criterion.<br />
Accuracy of Simulation<br />
Sensitivity of Parameters<br />
We examine the effect of changing parameters. Altering the processing<br />
time τ, length of the tollway, length of the merging area, and the probability<br />
distribution for random behavior all affect the absolute throughputs achieved<br />
for different numbers of tollbooths—but do not affect the optimal number of<br />
lanes.<br />
The only parameter with a significant effect on the optimal number of lanes<br />
is length of the merging area when set to an extremely low value, so that cars<br />
couldn’t switch lanes in time to utilize all of the lanes. However, this condition<br />
contradicts an initial assumptions of our model and condition is unlikely to<br />
occur in the real world.<br />
Our simulation is therefore very robust with respect to parameter variation.<br />
Faithfulness to Real-World Behavior<br />
We use the cellular automata simulation to validate the effectiveness of the<br />
flow model; however, this verification is only accurate to the extent that the<br />
cellular automata is a realistic description of real-world traffic flow through<br />
tollbooths.<br />
To validate our simulation, we examine real-world flow rates of the Union<br />
toll plaza of the Garden State Parkway at several peak flow times, where n =5<br />
and m =13[New Jersey <strong>Institute</strong> of Technology 2001, 11]. Examining the seven<br />
hours of data, we arrive at a throughput of 2393 cars/hr; our model predicts<br />
2530 cars/hr. Our simulation matches the empirical results surprisingly well<br />
for peak density.<br />
According to our simulation, the Garden State Parkway’s performance is<br />
fairly suboptimal. The best results, according to the simulation, are obtained
370 The UMAP Journal 26.3 (2005)<br />
for m =20tollbooth lanes, enabling an increase in average throughput by<br />
almost a factor of two.<br />
Extensions of Base Model<br />
Electronic Toll Collection<br />
Under electronic fare payment systems such as Fastrack and EZ-Pass, drivers<br />
attach an electronic device to their vehicles, which is scanned automatically as<br />
they pass through a special tollbooth lane with little or no reduction in speed.<br />
Both our model and simulation can analyze inclusion of special “fastlanes.”<br />
In the streamlined-flow model, fastlanes are simply lanes with a much higher<br />
rate of flow qtolli<br />
through the tollbooth. Since congestion still occurs later as<br />
aresult of the narrow bottleneck caused by merges and qmax, fast progress<br />
may still be impeded by slow merging. This possibility explains the common<br />
practice of having separate fastlane toll lanes running alongside the outside of<br />
the toll plaza, so that merging happens far enough down the road.<br />
Because merge rates are proportional to ratio of the rates of the lanes merging<br />
and the maximum possible rate, we have that<br />
<br />
<br />
qfastlane<br />
.<br />
qfastlane-at-mergepoint = qmax<br />
qfastlane + qother<br />
Since qfastlane is potentially much greater than qother, cars in the fastlane flow at a<br />
rate close to the maximum. As a result, users who choose a fastlane still move<br />
through the toll plaza faster than other cars, even when forced to merge with<br />
slower traffic. The more use of fastlanes, the higher overall average throughput,<br />
and the recommended number of toll lanes for regular use can drop.<br />
Final Recommendations<br />
• Our model predicts that the findings in Table 1 provide the best results for<br />
high-density situations. For traffic density at or above 85% of the maximum<br />
bumper-to-bumper density, our model should be used. Lanes can be closed<br />
when density is lower.<br />
• Our model provides a lower bound on the recommended number of tollbooth<br />
lanes. Running more tollbooth lanes than the optimal predicted value<br />
does not hinder throughput.<br />
• The case m = n suffices exactly when a road has consistently low-density<br />
traffic. For medium- and high-density traffic, this case causes suboptimal<br />
performance.
Model Assessment<br />
Model Strengths<br />
TwoTools for Tollbooth Optimization 371<br />
• The discrete and continuous models agree well at peak densities.<br />
• We generate plausible traffic behavior through partially random behavior in<br />
our models. In particular, our models match well effects we observe in the<br />
Union toll plaza of the Garden State Parkway.<br />
• Our model can scale successfully to represent the impact of electronic tolltaking<br />
and variable tollbooth speeds.<br />
Model Weaknesses<br />
• The primary shortcoming of the theoretical model is the assumption that car<br />
flux is continuous. Fractional values of car flux do not realistically represent<br />
low-density traffic.<br />
• Our model is too sensitive to variations in the average amount of time to<br />
process a car at the tolls.<br />
• The simulation accounts for many unknown factors with random choices.<br />
Validation of our model is accurate only insofar as this randomness accurate<br />
reflects driver behavior.<br />
• We don’t consider cost as a component of our solution.<br />
References<br />
Garber, Nicholas J., and Lester A. Hoel. 1999. Traffic and Highway Engineering.<br />
Pacific Grove, CA: Brady/Cole Publishing Company.<br />
Jiang, Rui, and Qing-Song Nu. 2003. Cellular automata for synchronized traffic<br />
flow. Journal of Physics A: Mathematical and General.<br />
Kuhne, R.D., and Panos Michalopoulos. 2002. Revised Monograph on Traffic Flow<br />
Theory: Flow Models.Turner-Fairbank Highway Research Center.<br />
Mihaylova, Lyudmila, and Rene Boel. 2003. Hybrid stochastic framework for<br />
freeway traffic flow modeling. ACM Proceedings of the 1st International Symposium<br />
on Information and Communication Technologies.<br />
New Jersey <strong>Institute</strong> of Technology. 2001. TenYear Plan to Remove Toll Barriers<br />
on the Garden State Parkway.<br />
Rastorfer, Robert L., Jr. 2004. Toll plaza concepts. ASCE Fall Conference, Houston,<br />
TX.
372 The UMAP Journal 26.3 (2005)<br />
L. Craig Evans (advisor), Anand Kulkarni, Ephrat Bitton, and Mark Shlimovich.
For Whom the Booth Tolls<br />
Brian Camley<br />
Bradley Klingenberg<br />
Pascal Getreuer<br />
University of Colorado<br />
Boulder, CO<br />
Advisor: Anne Dougherty<br />
<strong>Summary</strong><br />
For Whom the Booth Tolls 373<br />
We model traffic near a toll plaza with a combination of queueing theory<br />
and cellular automata in order to determine the optimum number of tollbooths.<br />
We assume that cars arrive at the toll plaza in a Poisson process, and that the<br />
probability of leaving the tollbooth is memoryless. This allows us to completely<br />
and analytically describe the accumulation of cars waiting for open tollbooths<br />
as an M|M|n queue. We then use a modified Nagel-Schreckenberg (NS) cellular<br />
automata scheme to model both the cars waiting for tollbooths and the cars<br />
merging onto the highway. The models offer results that are strikingly consistent,<br />
which serves to validate the conclusions drawn from the simulation.<br />
We use our NS model to measure the average wait time at the toll plaza.<br />
From this we demonstrate a general method for choosing the number of tollbooths<br />
to minimize the wait time. For a 2-lane highway, the optimal number of<br />
booths is 4; for a 3-lane highway, it is 6. For larger numbers of lanes, the result<br />
depends on the arrival rate of the traffic.<br />
The consistency of our model with a variety of theory and experiment suggests<br />
that it is accurate and robust. There is a high degree of agreement between<br />
the queueing theory results and the corresponding NS results. Special cases of<br />
our NS results are confirmed by empirical data from the literature. In addition,<br />
changing the distribution of the tollbooth wait time and changing the probability<br />
of random braking does not significantly alter the recommendations. This<br />
presents a compelling validation of our models and general approach.<br />
The UMAP Journal 26 (3) (2005) 373–389. c○Copyright 2005 by COMAP, Inc. All rights reserved.<br />
Permission to make digital or hard copies of part or all of this work for personal or classroom use<br />
is granted without fee provided that copies are not made or distributed for profit or commercial<br />
advantage and that copies bear this notice. Abstracting with credit is permitted, but copyrights<br />
for components of this work owned by others than COMAP must be honored. To copy otherwise,<br />
to republish, to post on servers, or to redistribute to lists requires prior permission from COMAP.
374 The UMAP Journal 26.3 (2005)<br />
Introduction<br />
A toll plaza creates slowdowns in two ways:<br />
• If there are not enough tollbooths, queues form.<br />
• If there are too many tollbooths, a traffic jam ensues when cars merge back<br />
onto the narrower highway.<br />
We use queueing theory to predict how long vehicles will have to wait before<br />
they can be served by a tollbooth. Using cellular automata to model individual<br />
cars, we confirm this prediction of wait time. This vehicle-level model is used<br />
to predict how traffic merges after leaving the toll plaza.<br />
Initial Assumptions<br />
• The optimal system minimizes average wait time. We do not consider the<br />
cost of operating tollbooths.<br />
• Cars arrive at the toll plaza uniformly in time (the interarrival distribution<br />
is exponential with rate λ). We can consider rush hour by varying the arrival<br />
rate λ.<br />
• Cars have a wait time at the tollbooth that is memoryless (exponential<br />
distribution with rate µ). This assumption is confirmed by the study of<br />
tollbooths by Hare [1963].<br />
• Cars are indistinguishable. All cars have the same length and the same<br />
maximum speed.<br />
• The toll plazas are not near on-ramps or exits. We do not consider the<br />
possibility of additional cars merging, only those that were already on the<br />
main road.<br />
• Two-way highways are equivalent to two independent highways. We<br />
consider only divided highways.<br />
Delays Due to Too Few Tollbooths<br />
Tollbooths As an M|M|n Queue<br />
As a vehicle approaches the toll plaza, it has a choice of n tollbooths for<br />
service. Cars tend toward the shortest queue available. We simplify this behavior<br />
by supposing that all vehicles form a single queue, and that the next car<br />
in line enters a tollbooth as soon as one of the n booths becomes available. A
For Whom the Booth Tolls 375<br />
real system would be less efficient, and therefore we expect longer times in a<br />
more detailed simulation.<br />
We assume that vehicles arrive uniformly distributed in time. We additionally<br />
suppose that the length of service time is exponentially distributed as<br />
in Hare [1963]. This class of model is called a memoryless arrivals, memoryless<br />
service times, n-server or “M|M|n” queue (Figure 1).<br />
Figure 1. The M|M|n queue. Vehicles arrive at rate λ and are serviced at rate µ.<br />
We define X(t) as the number of vehicles either in the queue or at a tollbooth<br />
at time t. We also define the stationary probabilities pk such that, in steady<br />
state, the probability that the queue has length k is pk. From the input-output<br />
relationship of the M|M|n queue, the stationary probabilities must satisfy<br />
0=−λp0 + µp1;<br />
0=λpk−1 − (λ + kµ)pk +(k +1)µpk+1, k =1,... ,n;<br />
0=λpk−1 − (λ + nµ)pk + nµpk+1, k = n +1,n+2,... .<br />
The solution to this system is [Medhi 2003]:<br />
⎡<br />
n−1 <br />
p0 = ⎣<br />
ρ<br />
j=0<br />
j<br />
j! +<br />
ρn n!(1 − ρ<br />
n )<br />
⎤<br />
⎧<br />
−1 ⎪⎨<br />
ρ<br />
⎦ , pk =<br />
⎪⎩<br />
k<br />
k! p0, k =0,... ,n;<br />
ρk−npn, k = n +1,n+2,... ,<br />
where ρ = λ/µ.<br />
Let the random variable W be the time that a vehicle spends in the system<br />
(time in the queue + time in the tollbooth). From Medhi [2003], the distribution<br />
and expected value of W are<br />
P (W = w) =<br />
n−1 <br />
k=0<br />
E[W ]= 1<br />
µ +<br />
k λ<br />
µ<br />
p0 µe<br />
k!<br />
−µw +<br />
pn<br />
.<br />
nµ(1 − ρ) 2<br />
n λ<br />
µ<br />
p0<br />
n!<br />
nµ 2 <br />
e<br />
(n − 1)µ − λ<br />
−µw − e −(1−ρ)nµw<br />
,<br />
This result describes the first part of the general problem: how the cars line up<br />
depending on the number n of tollbooths.<br />
To model the traffic merging after the tollbooths, it is important to describe<br />
how vehicles leave the M|M|n queue. For an M|M|n queue, the interdeparture
376 The UMAP Journal 26.3 (2005)<br />
times of the output of the queue are exponentially distributed with rate λ, and<br />
the output process has the same distribution as the input process. Because of<br />
the memoryless nature, interdeparture intervals are mutually independent (see<br />
Medhi [2003] or Bocharov et al. [2004] for proofs of these statements).<br />
We define D as the number of cars departing the tollbooth during an interval<br />
∆t. Then the probability that d cars leave in that time is:<br />
,<br />
d!<br />
where λ is the mean number of cars that arrive at the toll plaza in a time step.<br />
The M|M|n queue provides a simple and well-developed model of the tollbooth<br />
plaza. In particular, the average wait time and the output process are<br />
known, allowing us to verify simulation results.<br />
P (D = d) = e−λ∆t (λ∆t) d<br />
Limitations of the M|M|n Queue<br />
Though useful, the M|M|n queue is incomplete and oversimplifies the problem.<br />
Even though the M|M|n queue allows us to find the distribution of departures<br />
simply, its assumptions prevent it from being a complete solution. By<br />
using a single-queue theory, we assume that any car can go to any open server.<br />
This is overly optimistic, especially when the density is high. We would expect<br />
our predictions to be more valid for low density. Perhaps most importantly,<br />
the M|M|n queue only simulates half of the problem—the waiting times due to<br />
back-ups in front of the tollbooths.<br />
Modeling Traffic with Cellular Automata<br />
Overview<br />
The complex system of traffic can be modeled by the simple rules of automata.<br />
We use cellular automata to model the traffic flow on a “microscopic”<br />
scale. In this scheme, we discretize space and time and introduce cars that each<br />
behave according to a small set of rules.<br />
Cellular automata are well-suited for simulating our specific problem, since<br />
there are a large number of individual vehicles in the toll plaza, all of which<br />
are interacting. Continuous or macroscopic models could not capture this<br />
interaction and its role in causing jams that spontaneously form both before<br />
and after the toll plaza.<br />
We first create a one-lane highway model and then add a delay for the time<br />
to pay the toll. As a one-lane simulation can allow no passing, cars accumulate<br />
behind the stopped car, creating a queue. We then extend this model into a<br />
multiple lane system, and then to a multiple lane system where the number of<br />
lanes is not constant, that is, where the road enters or leaves a toll plaza.
Single-lane Nagel-Schreckenberg Traffic<br />
For Whom the Booth Tolls 377<br />
Most automata used to simulate traffic are generalizations of the Nagel-<br />
Schreckenberg cellular automata model (NS) [Chowdhury et al. 2000]. The NS<br />
model is a standard tool used to simulate traffic flow and has been shown to<br />
correspond to empirical results [Brilon et al. 1991; Chowdhury et al. 2000; Gray<br />
and Griffeath 2001; Knopse et al. 2004; Rickert et al. 1996; Schreckenberg et al.<br />
1995].<br />
We use this automaton to create a numerical model to confirm the queueing<br />
theory predictions.<br />
In the NS model, a car is represented by an integer position xn and an integer<br />
speed vn. The vehicles are deterministically moved by their velocities, xn →<br />
xn + vn. The system evolves by applying the following procedure (Figure 2)<br />
simultaneously to all (xn,vn).<br />
NS Algorithm<br />
Figure 2. Rules of the NS algorithm.<br />
1. Acceleration. Ifthe vehicle can speed up without exceeding the speed limit<br />
vmax, itadds one to its speed, vn → vn +1. Otherwise, the vehicle has<br />
constant speed, vn → vn.<br />
2. Collision prevention. Ifthe distance between the vehicle and the car ahead<br />
of it, dn, isless than or equal to vn, that is, the nth vehicle will collide if it<br />
doesn’t slow down, then vn → dn − 1.<br />
3. Random slowing. Vehicles often slow for nontraffic reasons (cell phones,<br />
coffee mugs, even laptops) and drivers occasionally make irrational choices.<br />
With some probability pbrake, wehave vn → vn − 1, presuming vn > 0.<br />
We choose the cell size to be 7.5 m to match Nagel and many others [Brilon<br />
et al. 1991; Chowdhury et al. 2000]. Since a typical maximum speed for cars is<br />
30–35 m/s, choosing vmax =5makes a single time step close to 1 s. We also use<br />
periodic boundary conditions for simplicity. (We later abandon these boundary<br />
conditions, since open boundary conditions—a Poisson generator and a sink—<br />
are consistent with the M|M|n model.) In addition, research results indicate<br />
that the periodic boundary may oversimplify the distribution of vehicles [Yang<br />
et al. 2004].
378 The UMAP Journal 26.3 (2005)<br />
We apply the above algorithm to a random initial state with a given density.<br />
This system was created by assigning each cell a probability of occupation c,<br />
which is the vehicle density parameter. This matches Gray and Griffeath’s<br />
approach [2001].<br />
The NS model produces results similar to those cited as typical by Chowdhury<br />
[2000]. In Figure 3, the state of the system at time step i is drawn in the ith<br />
column, with a white pixel where there is a vehicle and a black pixel for open<br />
space. Both images show generally smooth flow interrupted by congestion.<br />
Time (s)<br />
50<br />
100<br />
150<br />
200<br />
250<br />
300<br />
350<br />
400<br />
450<br />
500<br />
50 100 150 200 250<br />
Cell Position<br />
300 350 400 450 500<br />
a. Results from the NS model, c =0.2, p =0.25. b. Results from Chowdhury et al. [2000].<br />
Figure 3. Typical results from two models.<br />
Properties of and Support for the NS Model<br />
The one-lane NS model is self-consistent, flexible, and matches known empirical<br />
data.<br />
Some of the properties of the NS model can be predicted analytically [Nagel<br />
and Herrmann 1993]. We use this information as well as experimental results<br />
to test our model. In the limiting case where the random braking probability<br />
is zero, it is possible for vehicles to “cruise,” moving at their maximum speed<br />
at all times, corresponding to a flux of J = cvmax. This is possible only if there<br />
is sufficient space. Once the “hole density” or the remaining spaces, given by<br />
(1 − c), issmaller than this flux, the lack of free space limits the speed of the<br />
vehicles. This relationship between flux and density is given by:<br />
J(c) =min{cvmax, 1 − c}, (1)<br />
where J is the flux of cars, the number of cars passing a cell in unit time, and<br />
c is the density of cars. We ran our NS automaton with pbrake =0for 20 trials<br />
with excellent agreement between our mean and the theory, as seen in Figure 4.<br />
As pretty as this graph is, it indicates only that the model is self-consistent<br />
and can be approximated; it does not show that it actually represents a real
For Whom the Booth Tolls 379<br />
Figure 4. The flux equation (1) predicts the results of the NS model with very good accuracy.<br />
system. We consult empirical data on vehicle flux (Figure 5b). Clearly, the NS<br />
model is an accurate approximation of the known data.<br />
It is also possible to use mean field theory to describe the NS model. Even<br />
if pbrake = 0, the case of vmax =1can be solved analytically with this technique<br />
[Schadschneider and Schreckenberg 1997]. For our system, with vmax =5, this<br />
becomes computationally difficult.<br />
Adding Delays<br />
Delays prevent the use of periodic boundary conditions.<br />
To simulate an encounter with a tollbooth, we must add a delay to the<br />
unobstructed system. Simon and Nagel model the NS automaton for a blockage<br />
but only with a fixed delay probability [1998]. We assume that the service time<br />
is exponentially distributed, with a probability of 1 − exp(−µ∆t) that any one<br />
tollbooth completes service in ∆t, and so we use this assumption to describe<br />
the delay in our NS model as well.<br />
Introducing this delay creates an asymmetry in the problem; particles to<br />
the right of the barrier have to loop around to reach the “tollbooth,” whereas<br />
particles on the left will impact it immediately. Because of this, we measure the<br />
flux at both the one-quarter and three-quarter points of the lane (Figure 6).<br />
The fundamental diagrams in Figure 6 confirm our intuition regarding the<br />
interaction of flux and a bottleneck (the tollbooth). The flux at the quarter<br />
point experiences a decline due to congestion at a relatively low vehicle density<br />
compared with the three-quarter point, which is beyond the bottleneck. The
J (flux in vehicles/time)<br />
380 The UMAP Journal 26.3 (2005)<br />
a. NS model with theory.<br />
Figure 5. Comparison of model with data.<br />
b. Empirical data from Canadian highway<br />
[Chowdhury et al. 2000].<br />
heavy incoming traffic therefore affects the accumulating queue faster than the<br />
vehicles past the tollbooth.<br />
These fundamental diagrams show that the periodic boundary conditions<br />
are inappropriate for this calculation; with periodic boundaries, the input rate<br />
to the queue is limited by the (smaller) flux of vehicles wrapping around from<br />
the right. This is not representative of a true traffic jam; without periodic<br />
boundary conditions, jams cannot affect the flux upstream from them.<br />
0.45<br />
0.4<br />
0.35<br />
0.3<br />
0.25<br />
0.2<br />
0.15<br />
0.1<br />
0.05<br />
0<br />
0 0.1 0.2 0.3 0.4 0.5 0.6 0.7 0.8 0.9 1<br />
c (density in vehicles/cell)<br />
a. Fundamental diagram at one-quarter<br />
point, p =0.<br />
0.35<br />
0.3<br />
0.25<br />
0.2<br />
0.15<br />
0.1<br />
0.05<br />
Figure 6. Fundamental diagrams.<br />
J (flux in vehicles/time)<br />
0<br />
0 0.1 0.2 0.3 0.4 0.5 0.6 0.7 0.8 0.9 1<br />
c (density in vehicles/cell)<br />
b. Fundamental diagram at three-quarters<br />
point, p =0.
Simulating the Complete System<br />
Multiple Lanes<br />
For Whom the Booth Tolls 381<br />
By adding a new rule to the one-lane automaton, we can model multilane<br />
highways. We use a single-lane model to ensure that our automaton is a proper<br />
representation of the real world, but the actual problem is a multiple-lane one.<br />
Two-lane system studies are less common than single-lane studies, and higherlane<br />
models even rarer [Chowdhury et al. 2000; Nagel et al. 1998; Rickert et al.<br />
1996]. We extend the rule set of the automaton to describe lane changes, using<br />
the one-lane NS rules with a single additional rule for lane changing (Figure 7).<br />
Figure 7. The multi-lane automaton rule.<br />
4. Merge to avoid obstacles. The vehicle attempts to merge if its forward path<br />
is obstructed (dn =0). The vehicle randomly chooses an intended direction,<br />
right or left. If that intended direction is blocked, the car moves in the other<br />
direction unless both directions are blocked (the car is surrounded). This<br />
is consistent with the boundaries and tailgating rules proposed by Rickert<br />
et al. [1996].<br />
Changing the Highway Shape<br />
By using the multilane automaton, we can model a multilane highway that<br />
has realistic lane-changing behavior. This still does not, however, model a<br />
transition between highway and a number of tollbooths.<br />
To create the toll plaza, we introduce borders that force the automata to<br />
change lanes to avoid hitting the boundary. The borders outline the edge of<br />
a ramp that moves from the highway onto a wider toll plaza and back again<br />
(Figure 8). This is the only aspect of this model that is not general; by imposing<br />
different boundaries, we could easily model a different problem. To simulate<br />
the wait at the tollbooth, we also add a delay at the center, as in the one-lane<br />
case.<br />
The previous models [Gray and Griffeath 2001; Nagel et al. 1998; Rickert<br />
et al. 1996] assume a roadway of constant width—the number of lanes does<br />
not change. By restricting the geometry of our roadway to represent the toll<br />
plaza (note the “diamond” shape in Figure 8 and introducing the behavior of
382 The UMAP Journal 26.3 (2005)<br />
Figure 8. We introduce imaginary borders into the system to narrow and widen traffic.<br />
merging away from obstacles, we have increased the flexibility of the model<br />
without making additional assumptions.<br />
Consistency of M|M|n Queue and NS Model<br />
The M|M|n queue is an idealized system. It predicts a shorter wait time<br />
than a real toll plaza, because it fails to account for inefficiencies in the queue<br />
(Figure 9). The M|M|n queue does, however, predict the correct distribution.<br />
In addition, the stability of the queue is very different from the stability of the<br />
NS model. An M|M|n queue achieves a steady state if λ/µ < n, with λ the<br />
arrival rate, µ the service rate, and n the number of servers [Gross and Harris<br />
1974]. We observe in the NS simulation that traffic in front of the tollbooths<br />
could create a growing backlog even when the corresponding M|M|n queue<br />
would be stable.<br />
Despite these apparent inconsistencies, there is a very strong agreement between<br />
the queueing theory predictions and the observed results. From queueing<br />
theory analysis, we know the probability distribution of the number of cars<br />
leaving the tollbooths:<br />
P (D = d) = e−λ∆t (λ∆t) d<br />
.<br />
d!<br />
This equation provides a good deal of information about the queue, and this<br />
probability can easily be measured in the cellular automata model. We compare<br />
the simulated and theoretical probability distribution in Figure 10, and the two<br />
distributions are very similar: The difference in their means is decreasingly<br />
small and is less than 2% after 10 4 iterations of the NS model.
For Whom the Booth Tolls 383<br />
Figure 9. The M|M|n distribution and NS distribution are similar, but the M|M|n has a smaller<br />
mean wait time due to its optimistic assumptions.<br />
Figure 10. The simulated distribution of leaving vehicles is very close to that predicted by queueing<br />
theory.
384 The UMAP Journal 26.3 (2005)<br />
Time Predictions of the Automata Model<br />
The Optimal Number of Tollbooths<br />
The optimal configuration minimizes the wait time; so to determine the<br />
correct number of tollbooths, we need to measure the average time for a vehicle<br />
to enter the toll plaza, wait in line, and then exit out onto the main road again.<br />
We do this by tracking automata and averaging the time that passes between<br />
entering and leaving the system.<br />
Calculating Average Times<br />
The average time required to pass through our system depends on the arrival<br />
rate (which controls congestion), the number of lanes, and the number of<br />
tollbooths. We consider the mean service rate to be fixed, at 5 s; Hare uses 9 s<br />
[1963]. However, though changing the service rate does change the average<br />
time, this change does not affect which value of n is optimal.<br />
We fix the number l of incoming lanes and search over the number n of<br />
tollbooths and the arrival rate λ. Wecalculate the average wait time for a range<br />
of n and λ by using our cellular automata model and averaging over a long<br />
period of time to eliminate transient effects.<br />
What, though, should these ranges be? We presume that n is not larger than<br />
three or four times the number of lanes. We placed this restriction after noticing<br />
that the wait time increases sharply when n is much larger than l. The range of<br />
λ is determined by commonsense restrictions. If λ is the mean number of cars<br />
arriving in a time step, then λ should be no more than the number of lanes of<br />
incoming traffic as this is the physical capacity of the road.<br />
Optimal Results for 2 Lanes<br />
We allow n to range from 2 to 8 and λ from 0 to 2. We plot the average time<br />
against n and λ in Figure 11.<br />
The clear minimum in this graph lies along the line n =4, even for different<br />
values of λ. This indicates that even for different arrival rates, the optimal<br />
number of tollbooths is 4. This is a very stable solution that does not require<br />
changes with traffic rates, at least for typical values.<br />
Though 4 is the optimal number of booths, 2 is very near optimal and 3 is<br />
very bad. For n =3, the additional lane adds more traffic jam than throughput.<br />
For small n, when there is one more booth than lanes of traffic, the wait time is<br />
a local maximum.<br />
Optimal Results for 3 Lanes<br />
By varying λ from 0.6 to 2.7 and n from 3 to 9, we find that the minimum<br />
occurs, once again independent of λ, atn =6(Figure 12).
For Whom the Booth Tolls 385<br />
Figure 11. For a 2-lane system, the minimum time occurs for 4 tollbooths.<br />
Figure 12. For a three-lane system, the minimum time occurs when there are six tollbooths.
386 The UMAP Journal 26.3 (2005)<br />
Higher Numbers of Lanes<br />
The results so far would suggest the naive solution of always having twice<br />
as many tollbooths as incoming lanes. Unfortunately, the 4-lane case disproves<br />
this guess. For different values of the arrival rate λ, the optimal number of<br />
tollbooths changes, from a low of 6 for small λ. The tollbooth owners could<br />
measure traffic flow, estimate λ, and open or close tollbooths as needed.<br />
Generalizing These Results<br />
To determine the stability of these results, we made calculations with the<br />
probability of random braking changed to 0.1 rather than 0. For each λ, even<br />
though the wait times change, the optimal numbers of tollbooths do not.<br />
This process could be repeated for any required setup; we have illustrated<br />
a general technique for determining the optimal number of tollbooths.<br />
One Tollbooth per Lane<br />
If cars were not allowed to change lanes, the case with one tollbooth per<br />
lane of traffic would just reduce to l independent one-lane models, and this<br />
would be equivalent to our single-lane highway. We know that this is not the<br />
case. Cars move into the lane with the shortest queue.<br />
In our results, the n = l case is typically nonoptimal. The one exception<br />
to is the two-lane highway; here, the time for n =2is only barely longer than<br />
for n =4. However, this is not because n = l is always “bad,” but because<br />
there is usually a better case. As the number of lanes increases, the number of<br />
tollbooths increase significantly. If we consider cost, the n = l case could be<br />
very important, since for low l (l
For Whom the Booth Tolls 387<br />
• Changing the service rate and service distribution of the tollbooths does not<br />
significantly alter the recommendations for the optimal number of booths<br />
• We establish a general technique for determining the optimal number of<br />
tollbooths to put on a given highway.<br />
• Though in general the optimal tollbooth results are complex and depend<br />
on the arrival rate, there are simple cases: a 2-lane highway should have 4<br />
tollbooths and a 3-lane highway should have 6, independent of the amount<br />
of traffic.<br />
• In general, the case of as many tollbooths as lanes is suboptimal.<br />
Strengths and Weaknesses<br />
Strengths<br />
• Consistency. Our queueing theory model and the cellular automata model<br />
agree on the distribution of cars leaving the booths. Both models match theoretical<br />
results and past empirical results. In addition, under small changes,<br />
like adjusting the probability of braking, the recommendations of the model<br />
do not change significantly.<br />
• Minimal assumptions required. By using the automata, we reduce the<br />
number of parameters and assumptions. For our queueing theory, we assume<br />
that the probability of leaving the tollbooth is exponential, but altering<br />
this distribution does not affect the recommendations.<br />
• Flexibility. Our model easily adapts to problems with different geometries,<br />
such as different numbers of lanes or even different boundaries.<br />
• Ease of implementation. A complex problem is simulated using very simple<br />
rules.<br />
Weaknesses<br />
• No closed-form solution. For the complete model, we must actually calculate<br />
the simulation.<br />
• Calculation time. To get an accurate average time for vehicles, we need to<br />
average over a number of time steps on the order of 10,000. As the number<br />
of lanes increases, computation slows.
388 The UMAP Journal 26.3 (2005)<br />
References<br />
Bocharov, P., C. D’Apice, A. Pechenkin, and S. Salerno. 2004. Modern Probability<br />
and Statistics: Queueing Theory. Utrecht, The Netherlands: Brill Academic<br />
Publishers.<br />
Brilon, W., F. Huber, M. Schreckenberg, and H. Wallentowitz (eds.). 1991. Traffic<br />
and Mobility. Springer-Verlag.<br />
Chowdhury, Debashish, Ludger Santen, and Andreas Schadschneider. 2000.<br />
Statistical physics of vehicular traffic and some related systems. Physics Reports<br />
329 (199). http://arxiv.org/pdf/cond-mat/0007053 .<br />
Gray, Lawrence, and David Griffeath. 2001. The ergodic theory of traffic jams.<br />
Journal of Statistical Physics 105 (3/4).<br />
Gross, D., and C. Harris. 1974. Fundamentals of Queueing Theory. New York:<br />
John Wiley and Sons.<br />
Hare, Robert R., Jr. 1963. Contribution of mathematical concepts to management.<br />
Industrial College of the Armed Forces http://www.ndu.edu/library/<br />
ic4/L64-015.pdf .<br />
Knopse, Wolfgang, Ludger Santen, Andreas Schadschneider, and Michael<br />
Schreckenberg. 2004. Empirical test for cellular automaton models of traffic<br />
flow. Physical Review E 70.<br />
Medhi, J.. 2003. Stochastic Models in Queueing Theory. 2nd ed. New York: Academic<br />
Press, Elsevier Science.<br />
Nagel, Kai, and Hans J. Herrmann. 1993. Deterministic models for traffic jams.<br />
Physica A 199 (2).<br />
Nagel, Kai, Dietrich Wolf, Peter Wagner, and Patrice Simon. 1998. Two-lane<br />
traffic rules for cellular automata: A systematic approach. Physical Review E<br />
58 (2).<br />
Rickert, M., K. Nagel, M. Schreckenberg, and A. Latour. 1996. Two lane traffic<br />
simulations using cellular automats. Physica A 231 (4): 534–550. citeseer.<br />
ist.psu.edu/rickert95two.html .<br />
Schadschneider, Andreas, and Michael Schreckenberg. 1997. Car-oriented<br />
mean field theory for traffic flow models. Journal of Physics A: Mathematical<br />
and General 30.<br />
Schreckenberg, M., A. Schadschneider, K. Nagel, and N. Ito. 1995. Discrete<br />
stochastic models for traffic flow. Physical Review E 51 (4): 2939. citeseer.<br />
ist.psu.edu/schreckenberg94discrete.html .
For Whom the Booth Tolls 389<br />
Simon, P.M., and Kai Nagel. 1998. A simplified cellular automaton model for<br />
city traffic. Physical Review E 58 (2).<br />
Yang, X., Y. Ma, and Y. Zhao. 2004. Boundary effects on car accidents in a<br />
cellular automaton model. Journal of Physics A: Mathematical and General 37.<br />
Brian Camley, Pascal Getreuer, and Bradley Klingenberg.
390 The UMAP Journal 26.3 (2005)
Judge’s Commentary 391<br />
Judge’s Commentary:<br />
The Outstanding Tollbooths Papers<br />
Kelly Black<br />
Dept. of Mathematics<br />
Union College<br />
Schenectady, NY 12308<br />
blackk@union.edu<br />
Overview of the Problem<br />
The teams were asked to examine the flow of traffic through a toll plaza. One<br />
of the difficulties in this problem is that the traffic flow through a toll plaza is not<br />
actively managed; rather, the traffic through the system is passively managed<br />
by the careful design of the roadway and the toll-collection system. On most<br />
roadways, a toll plaza consists of a long transition to an increased number of<br />
lanes, the collection system (the tollbooths), and a long transition back to the<br />
original number of lanes. Interestingly, only a very small number of entries<br />
suggested adding an active management component to the toll plaza, such as<br />
ways to restrict the way that drivers can change lanes.<br />
In the last paragraph of the problem statement three tasks/questions were<br />
given:<br />
• “Make a model to help determine the optimal number of tollbooths to deploy<br />
in a barrier-toll plaza.”<br />
• “Explicitly consider the scenario where there is exactly one tollbooth per<br />
incoming lane.”<br />
• “Under what conditions is this more or less effective than the current practice?”<br />
At first glance, it would seem that the considerable power of queueing theory<br />
would be readily available for this problem. Unfortunately, this is only true<br />
to a certain extent. The nature of a toll plaza is that multiple lanes expand into<br />
even more lanes into which people can change if they feel it is advantageous.<br />
Once again, people get in the way of good mathematics.<br />
The UMAP Journal 26 (3) (2005) 391–399. c○Copyright 2005 by COMAP, Inc. All rights reserved.<br />
Permission to make digital or hard copies of part or all of this work for personal or classroom use<br />
is granted without fee provided that copies are not made or distributed for profit or commercial<br />
advantage and that copies bear this notice. Abstracting with credit is permitted, but copyrights<br />
for components of this work owned by others than COMAP must be honored. To copy otherwise,<br />
to republish, to post on servers, or to redistribute to lists requires prior permission from COMAP.
392 The UMAP Journal 26.3 (2005)<br />
On second thought, however, the difficulty of the problem should not be a<br />
surprise. As far as we are aware, no state’s Dept. of Transportation has been<br />
able to get this problem right. Moreover, traffic designers often only have one<br />
chance to get it right. The cost of making changes to an existing toll plaza can<br />
be prohibitive.<br />
In the following section, we provide an overview of the kinds of solutions<br />
that were submitted, including some comments on the judges’ reactions. We<br />
also provide an overview of the judging process itself and the challenges that<br />
this particular problem represented to the judges. Finally, some tips and pointers<br />
are provided in reaction to some of the things that appeared in many of the<br />
team’s submissions.<br />
The Problem at Hand<br />
Modeling a Toll Plaza<br />
The first of the three questions required teams to create a mathematical<br />
model of a barrier-toll plaza. The most common mathematical model treated<br />
the toll plaza as a queue. Unfortunately, the complex nature of the toll plaza<br />
is not easily described as a simple queue. For example, the lanes diverge into<br />
more lanes at the entrance, and drivers are able to change lanes. Also, the<br />
lanes must combine again after the service area, and crowded traffic after the<br />
tollbooth can impact the traffic in the entrance of the toll plaza.<br />
Of the entries that modeled a toll plaza using queueing theory, what set<br />
them apart was how they handled the various subtleties of a toll plaza. For<br />
example, teams had to make decisions on how cars move in the entrance and<br />
exit sections of a toll plaza. Teams also had to decide on how each car is handled<br />
by the tollbooth attendants. For example, some teams assumed that each car<br />
could be handled in the same amount of time. Other teams assumed that the<br />
time required for each car was a random variable with a prescribed probability<br />
distribution. To make this decision even more difficult, the teams had to decide<br />
how to handle the various payment methods available, such as cash, EZ-Pass,<br />
or other remote rapid-payment methods.<br />
Of those teams that assumed that the service time required for each car<br />
varied, some treated the entrance section as a queue and the actual tollbooth<br />
as a separate queue. In this situation, the resulting chain of queues could be<br />
coupled and described if the two probability distributions were similar. For<br />
example, the majority of such entries assumed that the distributions of the<br />
cars entering the system and tollbooth service times were both Poisson with<br />
different parameters.<br />
While the more advanced entries were able to bring together the entrance<br />
and the tollbooths in the plaza, the exit represented a significant difficulty. The<br />
majority of entries briefly discussed the potential problems of the traffic after<br />
the service booths but did not include the effects of the exits in their models.
Judge’s Commentary 393<br />
In fact, the teams that did explicitly consider the exit areas usually only did so<br />
in the context of a simulation in a computational model.<br />
In addition to the queueing theory approach, a less common approach was<br />
to model the flow of traffic as a fluid. The resulting models were much more<br />
complex than those based on queueing theory. The process of matching the<br />
physical situation to a flow and then converting the results back to what is<br />
happening within a toll plaza represented a substantial difficulty for those<br />
taking this approach.<br />
Besides the construction of a mathematical model, the most popular approach<br />
to this problem made use of simulations based on a computational<br />
model. Such models were usually based on either a cellular automata model<br />
or a highly modified queue making use of a time-stepping scheme allowing for<br />
lane changes. The more advanced approaches also factored the exit areas into<br />
the simulation.<br />
A computational model required a much different approach to the analysis<br />
and discussion of the results. The results are a composite of many runs and<br />
take on a statistical nature. Furthermore, the large number of variables—the<br />
number of lanes before the plaza, the number of lanes in the plaza, the waiting<br />
time, the way cars enter the system, the length of the plaza, and a wide variety<br />
of other factors—make it difficult to reach concrete conclusions about the best<br />
design for a toll plaza. This is especially true given the short time available<br />
to develop the computational model, implement it, decide which situations to<br />
use, run it, and examine the results.<br />
The judges took this into consideration and did not expect a complete examination.<br />
This approach did require a more complete description of the computational<br />
model, though, since the number of assumptions that can be incorporated<br />
was significantly greater. There was also a heightened expectation of<br />
doing more in the way of a sensitivity analysis with respect to some of the<br />
various parameters.<br />
While many different approaches were submitted, the entries that received<br />
the higher ratings examined at least two different models. The most common<br />
combination by far was a simple queue and a computational model. The most<br />
striking aspect of this was that few teams explicitly stated a comparison of<br />
the two results under identical circumstances. Those that did stood out, and<br />
the results of the comparison helped to establish a good benchmark of the<br />
computational model.<br />
One Tollbooth Per Lane<br />
The second question in the problem statement required each team to use<br />
their models for a toll plaza that has one tollbooth for each lane of travel on<br />
the road. This established a sanity check that each team had to examine. Surprisingly,<br />
a number of teams did not examine this situation, which resulted in<br />
a penalty for ignoring one of the stated requirements.
394 The UMAP Journal 26.3 (2005)<br />
What Is “Best”<br />
The final question required the teams to determine best practice in designing<br />
a toll plaza—to define a way to compare different configurations of a toll plaza.<br />
Each team had to balance the competing costs of each driver’s time, the cost of<br />
operating the toll plaza, and the cost of construction.<br />
One of the most surprising aspects of this year’s competition is that few<br />
teams explicitly defined what they thought would be the cost of operating a toll<br />
plaza. The vast majority of teams simply compared the average waiting time<br />
for the drivers under various circumstances with little comment or justification.<br />
Those teams that looked at a nontrivial cost of operating the tollbooths based<br />
on the cost of lost productivity of the drivers and the cost of operating the<br />
tollbooths certainly stood apart from the others.<br />
The few teams that did examine this part of the problem reported some of<br />
the most interesting results. In fact, in some circumstances the option of not<br />
building a tollbooth is the most satisfactory option to almost everybody except<br />
maybe the tollbooth operators themselves!<br />
Overview of the Judging Process<br />
We give an overview of the judging process, including some general observations<br />
about some of the entries submitted for the competition. In the<br />
subsections that follow we try to provide some insight into what the judges<br />
discussed prior to the actual judging, first impressions of a paper, and some of<br />
the small details that help to make an entry stand out.<br />
First, we try to provide a broad overview of the judging process itself. The<br />
papers are examined in a two-step process. The first round, or triage round, is<br />
the first pass. In this round, judges are able to examine the papers for only a<br />
relatively short time. When a judge begins reading a paper in this first stage,<br />
the question is, “Should the paper be read in closer detail?” If the answer is<br />
“yes” or even “maybe,” then it is passed on to the second stage. Because we try<br />
to give each paper the benefit of the doubt, it is difficult to state what necessary<br />
essence is required to move past this round.<br />
At the most basic level, the quality of the writing and the consistency of the<br />
summary with the rest of the paper is vital in this first stage. It is a really bad<br />
idea to make a judge work too hard on a paper. The easier it is for a judge to<br />
determine how the students interpreted the problem, the approach used, and<br />
the results, the easier it is for the judges to determine the quality of the work.<br />
Entries that remain through the second stage are given much closer, detailed<br />
readings. For example, papers that remain on the final day of judging are read<br />
by as many as eight different judges for at least an hour per entry. During this<br />
time the judges sometimes confer with one another if they are not sure about<br />
an equation, result, or the wording in a section. For the most part, though, each<br />
judge tries to provide an independent review of the student’s work.
Discussion Before Judging Began<br />
Judge’s Commentary 395<br />
Before the judging began, the judges got together to discuss the problem.<br />
As usual, the problem was nontrivial, and we judges had to ensure that we understood<br />
what was being asked. The judges had to carefully parse the original<br />
question. For example, this year the problem included some very specific tasks<br />
that were given in the last paragraph of the problem, and whether or not an<br />
entry specifically addressed those questions was important.<br />
Additionally, each judge initially read through a set of randomly chosen<br />
papers. In the second stage of the process, this set of papers was adjusted to<br />
ensure that each judge viewed papers with a wide variety of initial scores. The<br />
purpose of this protocol is to make sure that we also took into consideration<br />
how the various teams interpreted the question and how they reacted to the<br />
problem.<br />
After these initial readings, the judges had to agree on what was important<br />
and how to provide a consistent mechanism for comparing different entries.<br />
Each year, the relative importances of the various aspects of a paper are tailored<br />
to the particular problem; but in general, the kinds of things that judges look<br />
for in a paper are relatively consistent. This year the judges decided that the<br />
following aspects were important:<br />
<strong>Summary</strong> This is the first thing that a judge sees. A summary should provide a<br />
brief overview of the problem, a brief review of the methodologies used, and<br />
an overview of the conclusions. It is a difficult challenge to include all these<br />
things on one page and do it well, but it does provide the first impression.<br />
Assumptions and Justifications In constructing a mathematical representation<br />
of a physical system some simplifications must be made and some subtleties<br />
must be left out. The parts of the problem deemed most important—as<br />
well as what is left out of the model—must be made explicit.<br />
Model/Analysis One of the novel aspects of this year’s problem was the close<br />
association between the mathematical model and the analysis of the problem.<br />
The stochastic nature of the problem, as well as the prevalence of entries<br />
making use of both queuing theory and simulation, made it difficult to separate<br />
these two aspects of the problem. In the end, the judges decided not<br />
to treat them separately, so that it would be easier to compare entries whose<br />
balance varied between the different approaches used.<br />
Results/Validation It is not unusual to see many papers that make use of a<br />
variety of approaches and techniques, but this problem resulted in more<br />
entries than usual that employed at least two solution techniques. It was<br />
more important than ever for the teams to be able to compare the different<br />
results as well as interpret the results.<br />
Sensitivity Between the stochastic nature of the problem and the wide use of<br />
simulation, the validation of the results had to include some way to test the<br />
robustness of the conclusions. One of the most important ways to do this
396 The UMAP Journal 26.3 (2005)<br />
is to examine what happens after changing the values of certain parameters<br />
or changing the assumptions on what kind of probability distributions to<br />
use. For example, some teams that used queuing theory examined their<br />
conclusions under a variety of assumptions about the time required by an<br />
individual tollbooth attendant to complete one transaction. If a small variation<br />
in the service time resulted in a large change in the average waiting<br />
times, that is an indication that the conclusions may be circumspect.<br />
Strength & Weakness Any mathematical model requires many assumptions<br />
and simplifications and is only good for a restricted situation. It is vital that<br />
the modeler identify the conditions under which the mathematical model<br />
is appropriate. Each team was expected to demonstrate explicitly that they<br />
had done some critical analysis of the model itself and to identify what they<br />
felt was good and bad about the model.<br />
Clarity/Communication One of the key aspects of any problem is to be able to<br />
share the results. The methods employed, the results that are delivered, and<br />
the analysis of both the methods and the results must be clearly described.<br />
This is the filter through which all mathematics is shared.<br />
Communicating Mathematics<br />
As mathematicians, we are engaged in a social exercise that absolutely requires<br />
us to share our work with one another, however sharing mathematical<br />
ideas can be extremely difficult. In fact, it is difficult enough that we often try<br />
very hard to avoid putting our students through the difficult learning process<br />
associated with writing and sharing mathematical ideas. We often have our students<br />
take part in writing proofs or problem solving, but putting it all together<br />
in a formal report or a paper the first time can be an excruciating process.<br />
There are many excellent books and other resources for students that offer a<br />
better introduction than can be expressed here. In fact, from the many excellent<br />
entries it is clear that those resources are being exploited. We focus on just a<br />
few general issues that stand out in this year’s event.<br />
• Some teams presented a narrative of the team’s activities. An entry that lists<br />
how the team approached the problem and chronicles what the team did (or<br />
tried to do) puts the team at a severe disadvantage. In contrast, an entry in the<br />
format of a self-contained report immediately stands out. In such a report,<br />
the problem is restated, including the results; the various methodologies that<br />
are used are clearly stated; the analyses are given; and the results are clearly<br />
stated, including a critical examination of the approach and the results.<br />
• One aspect of writing that even advanced writers struggle with is graphing.<br />
When a plot is provided, it should be clearly introduced and described in<br />
the text, including a proper reference to the figure number. It should be clear<br />
to the reader from the text of the report what to look for in the plot before
Judge’s Commentary 397<br />
turning to look at the plot. This year’s problem is an excellent example<br />
of the importance of describing plots and figures. Providing a graphical<br />
example of cars moving through a toll plaza over time is difficult and each<br />
team attempted to do this is in many different ways. Furthermore, some<br />
teams provided sequences of figures to demonstrate a particular transition,<br />
and there is a huge burden on the writers to explain what the reader should<br />
be looking for and what the implications are.<br />
In general, when a figure or plot is provided, the text should provide a<br />
detailed explanation of what is in the figure. Also, the caption and labels in<br />
the figure should succinctly describe what the figure is. Of course, the axes<br />
should be labeled and units should be provided. One thing that was different<br />
for this year, however, was that the judges gave teams more leeway in how<br />
discrete vs. continuous functions were displayed. Discrete data should be<br />
displayed as discrete and not with lines drawn between points. This year<br />
was different in that many figures represented the organization of the cars<br />
in a queue that might be discrete according to the model even though the<br />
domain (time) could be continuous.<br />
• Some of the entries included many tables. Almost everything said above for<br />
figures also applies to tables. Tables should be clearly labeled and explained<br />
in detail in the text of the report. The easier you make it for a judge to<br />
determine what is in a table and why it is important, the more likely the<br />
judge will be happy. A happy judge is a higher-scoring judge!<br />
• Finally, a small thing that is very likely to keep an otherwise good paper<br />
from being held back in the early rounds. Some teams have a difficult time<br />
integrating equations and citations within the text of the report. Equations<br />
and citations should be correctly integrated into each sentence using proper<br />
grammar. Some teams that do excellent work make it extremely difficult for<br />
themselves when the equations or citations are set apart from each sentence<br />
and not properly integrated into the flow of the text.<br />
The Little Things<br />
The vast majority of teams do great work, and it is always exciting to see<br />
what the teams are able to accomplish in such a short amount of time. It is also<br />
important to be able to share and express the ideas developed by each team<br />
in a formal report. This final product is the vehicle used to communicate the<br />
team’s ideas and techniques. It is not a narrative of what the team did but<br />
is an opportunity to educate and persuade others to follow up on the team’s<br />
excellent work.<br />
There are a number of simple things that can be done to make an entry easier<br />
to read. Some of these may appear to be trivial, but they make the judges task<br />
easier which in turn makes it easier for the judges to concentrate on the ideas<br />
rather than the way the ideas are expressed:
398 The UMAP Journal 26.3 (2005)<br />
Strengths & Weaknesses This aspect of an entry demonstrates whether or not<br />
a team has provided a critical inquiry into the methods and techniques developed.<br />
Including this aspect as a separate section of a report makes it<br />
much easier for the judges to identify easily this important aspect of the<br />
team’s efforts.<br />
Table of Contents Given the growing number of teams that use L ATEX, it is<br />
shocking how few entries provide a table of contents. This is a trivial step<br />
that can radically improve the readability of a report.<br />
Citations A paper that makes ample use of citations properly and consistently<br />
integrated into the text is guaranteed to stand out. For example, many papers<br />
included citations when providing the definitions of functions describing the<br />
way cars entered the toll plaza but failed to provide a citation when stating<br />
some of the results that happen to come directly from the relevant literature.<br />
Equation Numbers Number all equations even if they are not explicitly referred<br />
to in the text. This makes it easier for judges to confer when there is<br />
a question about a particular equation.<br />
Units Units are important. Always make sure that the definition of a variable,<br />
parameter, or function includes its units. Also, always check a result to make<br />
sure that the units are correct. This is one of the first checks judges make<br />
when confronted with a result that is not obvious. (Always keep in mind<br />
the difference between a quantity and its rate of change!)<br />
Conclusions<br />
Each year we are amazed at the high quality of the entries. The things that<br />
the teams can accomplish in a weekend are a testament to the quality of the<br />
team’s training and hard work. The teams receiving the higher honors should<br />
be proud to stand out in such an incredible field.<br />
This year the teams that submitted entries for the Tollbooth Problem focused<br />
their efforts on the optimal design of a toll plaza. They had to consider the<br />
number of lanes, the lengths of lane transitions, the times required to collect the<br />
fares, and a wide variety of other factors. Most of the teams made use of either<br />
queuing theory, comparisons to fluid flow, or simulation via a computational<br />
model. The teams that received higher recognition from the judges derived<br />
more than one model and made comparisons among their models.<br />
One aspect that set entries apart was the analysis and critical evaluation<br />
of their models and results. As usual, a sensitivity analysis of the models is<br />
important; but because of the nature of this year’s problem, an even higher<br />
value was placed on this important aspect of the modeling process.<br />
Finally, each team’s entry consists of a written report designed to educate<br />
and persuade. This is a difficult task in itself, but the teams are asked to do this<br />
without the benefit of an outside editing process; they must somehow build
Judge’s Commentary 399<br />
editing into their efforts themselves. Adding to the difficulties, good writing<br />
is most effective when it does not get in the way of the ideas that the writer is<br />
trying to convey and is not noticed until after the reader looks back and realizes<br />
what has been shared.<br />
About the Author<br />
Kelly Black is a faculty member in the Dept. of<br />
Mathematics at Union College. He received his undergraduate<br />
degree in Mathematics and Computer Science<br />
from Rose-Hulman <strong>Institute</strong> of Technology and<br />
his Master’s and Ph.D. from the Applied Mathematics<br />
program at Brown University. His research is in scientific<br />
computing and he has interests in computational<br />
fluid dynamics, laser simulations, and mathematical<br />
biology.

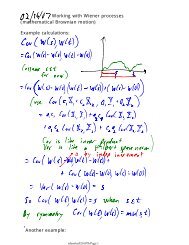

![MATH 1500 Sample Questions Exam 2 1. [3.7] A 10-ft plank is ...](https://img.yumpu.com/43861920/1/190x245/math-1500-sample-questions-exam-2-1-37-a-10-ft-plank-is-.jpg?quality=85)