Technical highlights - Department of Primary Industries ...
Technical highlights - Department of Primary Industries ...
Technical highlights - Department of Primary Industries ...

Create successful ePaper yourself
Turn your PDF publications into a flip-book with our unique Google optimized e-Paper software.
<strong>Department</strong> <strong>of</strong> Employment, Economic Development and Innovation<br />
Biosecurity Queensland<br />
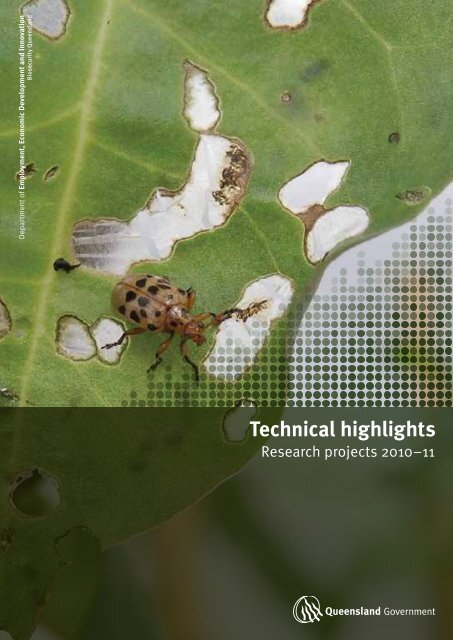
<strong>Technical</strong> <strong>highlights</strong><br />
Research projects 2010–11
CS0830 2/12<br />
ISSN 1838-6350<br />
© State <strong>of</strong> Queensland, <strong>Department</strong> <strong>of</strong> Employment, Economic Development and Innovation, 2012.<br />
The Queensland Government supports and encourages the dissemination and exchange <strong>of</strong> its information. The copyright<br />
in this publication is licensed under a Creative Commons Attribution 3.0 Australia (CC BY) licence.<br />
Under this licence you are free, without having to seek our permission, to use this publication in<br />
accordance with the licence terms.<br />
You must keep intact the copyright notice and attribute the State <strong>of</strong> Queensland, <strong>Department</strong> <strong>of</strong> Employment, Economic<br />
Development and Innovation as the source <strong>of</strong> the publication.<br />
Note: Some content in this publication may have different licence terms as indicated.<br />
For more information on this licence, visit http://creativecommons.org/licenses/by/3.0/au/deed.en
Contents<br />
Part 1 Integrated weed management 3<br />
1. Understanding grader grass (Themeda quadrivalvis) ecology for improved management 3<br />
2. Integrated management <strong>of</strong> bellyache bush (Jatropha gossypiifolia) in northern Queensland 6<br />
3. Ecology <strong>of</strong> Captain Cook tree (Cascabela thevetia) in northern Queensland 8<br />
4. Weed seed dynamics 11<br />
5. Controlling calotrope (Calotropis procera) in northern Australia 12<br />
6. Herbicide application research 14<br />
7. Evaluating the effectiveness <strong>of</strong> the EZ‑Ject herbicide lance 17<br />
8. Biological control <strong>of</strong> bellyache bush (Jatropha gossypiifolia) 19<br />
9. Biological control <strong>of</strong> parthenium (Parthenium hysterophorus) 21<br />
10. Biological control <strong>of</strong> prickly acacia (Acacia nilotica ssp. indica) 24<br />
11. Biological control <strong>of</strong> Hudson pear (Cylindropuntia rosea) 27<br />
12. Biological control <strong>of</strong> mother‑<strong>of</strong>‑millions (Bryophyllum spp.) 28<br />
Part 2 Landscape protection and restoration 29<br />
13. Biological control <strong>of</strong> cat’s claw creeper (Macfadyena unguis-cati) 29<br />
14. Biological control <strong>of</strong> Madeira vine (Anredera cordifolia) 31<br />
15. Biological control <strong>of</strong> lantana (Lantana camara) 33<br />
16. Biological control <strong>of</strong> mikania vine (Mikania micrantha) in Papua New Guinea and Fiji 35<br />
18. Ecology and control <strong>of</strong> national weed eradication targets 39<br />
19. Class 1 weed control packages 42<br />
20. Mimosa pigra research 44<br />
21. Ecology and control <strong>of</strong> wet tropics weeds 45<br />
22. Population viability analysis models for better management <strong>of</strong> lantana (Lantana camara) 48<br />
23. Impacts <strong>of</strong> environmental weeds on soil processes 51<br />
24. Cabomba (Cabomba caroliniana) ecology 55
Part 3 Pest animal management 58<br />
25. Livestock guardian dog/wild dog (Canis lupus familiaris and C. l. dingo) interaction study 58<br />
26. Assessing the role <strong>of</strong> harvesting in feral pig (Sus scr<strong>of</strong>a) management 62<br />
28. Non‑target impacts <strong>of</strong> 1080 meat baits for feral pigs (Sus scr<strong>of</strong>a) 66<br />
29. Feral pig (Sus scr<strong>of</strong>a) best practice research in northern Queensland 68<br />
30. Adaptive management <strong>of</strong> rabbits (Oryctolagus cuniculus) in south‑eastern Queensland 69<br />
31. Mapping the distribution and density <strong>of</strong> rabbits (Oryctolagus cuniculus) in Australia 71<br />
32. Resistance to rabbit haemorrhagic disease virus in Australian rabbits (Oryctolagus cuniculus) 73<br />
Part 4 Research services 75<br />
33. Pest management chemistry 75<br />
34. Chemical registration: providing tools for invasive pest control 76<br />
Appendixes 77<br />
1. Abbreviations 77<br />
2. Species 78<br />
2 <strong>Technical</strong> <strong>highlights</strong>: research projects 2010–11
Part 1 Integrated weed management<br />
1. Understanding grader grass (Themeda quadrivalvis) ecology for improved management<br />
Project dates<br />
July 2006 – June 2015<br />
Project leader<br />
Dr Wayne Vogler<br />
Tropical Weeds Research Centre<br />
Tel: (07) 4761 5707<br />
Email: wayne.vogler@deedi.qld.gov.au<br />
Other staff in 2010–11<br />
Laura Roden<br />
Objectives<br />
• Examine the effect <strong>of</strong> fire frequency<br />
and timing on grader grass biomass<br />
and overall pasture composition.<br />
• Quantify the seed longevity <strong>of</strong> grader<br />
grass.<br />
Rationale<br />
Management <strong>of</strong> invasive grasses has<br />
received little attention compared to<br />
research undertaken on other exotic<br />
weeds. There is a general lack <strong>of</strong><br />
understanding <strong>of</strong> appropriate control<br />
options, particularly ones that are<br />
economical to apply over large areas<br />
<strong>of</strong> low-value land and in areas <strong>of</strong> high<br />
conservation value.<br />
Grader grass (Themeda quadrivalvis)<br />
has the potential to change biodiversity,<br />
reduce conservation values and reduce<br />
grazing-animal production over large<br />
areas <strong>of</strong> the tropical savannas. The<br />
Queensland Government <strong>Department</strong> <strong>of</strong><br />
Environment and Resource Management<br />
(DERM) has identified this as a<br />
critical conservation issue threatening<br />
biodiversity in national parks. Also,<br />
the pest management plans <strong>of</strong> several<br />
local governments identify the weed as<br />
a significant threat both economically<br />
and environmentally; the Mitchell River<br />
Watershed Management Group classifies<br />
it as a significant weed species.<br />
This project aims to explain some basic<br />
ecological aspects <strong>of</strong> grader grass in<br />
response to management and natural<br />
conditions, so that management<br />
recommendations are based on science<br />
rather than anecdotal evidence.<br />
Methods<br />
Effect <strong>of</strong> fire frequency and timing<br />
In a replicated plot trial we impose each<br />
treatment (fire during dry season, fire<br />
at start <strong>of</strong> wet season, fire at end <strong>of</strong><br />
wet season) at yearly, two-yearly and<br />
four-yearly intervals. For comparison,<br />
we also apply the herbicide paraquat<br />
(concentration <strong>of</strong> 250 g L –1 ) at 2 L ha –1<br />
prior to seed set at yearly intervals.<br />
Changes in pasture species and biomass<br />
composition are measured using the<br />
Botanal methodology.<br />
Progress in 2010–11<br />
Seed longevity<br />
Artificial seed-bank trials were<br />
completed in 2010. For the final results,<br />
see <strong>Technical</strong> <strong>highlights</strong> 2009–10.<br />
Photo 1.1 Grader grass dominates a yearly burn plot at Undara National Park, 2011<br />
Photo 1.2 Perennial grass dominates a herbicide plot at Undara National Park, 2011<br />
Part 1 Integrated weed management 3
Effect <strong>of</strong> fire frequency and timing<br />
Grader grass biomass was generally<br />
maintained in yearly and two-yearly<br />
fire treatments applied at any time <strong>of</strong><br />
year (Figures 1.1 and 1.2), except for the<br />
two-yearly late wet-season fire treatments<br />
in 2009 and 2011, where biomass was<br />
similar to that <strong>of</strong> the control and herbicide<br />
treatments (Figure 1.2). It is unclear at<br />
this stage why these reductions in grader<br />
grass biomass occurred, but they may be<br />
caused by the previous late wet-season<br />
fires (applied in 2008 and 2010) killing<br />
a large proportion <strong>of</strong> grader grass seed,<br />
resulting in lower populations in 2009<br />
and 2011. Grader grass populations have<br />
then recovered in intervening years due<br />
to the disturbance caused by the 2008<br />
and 2010 fires (Figure 1.2). In contrast,<br />
where disturbance was minimal (such as<br />
in the control and herbicide treatments),<br />
grader grass biomass continued to decline<br />
following the fourth year <strong>of</strong> treatment.<br />
Where fire was excluded for four years<br />
following treatment, grader grass<br />
biomass declined to levels similar<br />
to those <strong>of</strong> the control and herbicide<br />
treatments in 2010 (Figure 1.3).<br />
Following application <strong>of</strong> the four-yearly<br />
fires in 2010, grader grass biomass in the<br />
late dry-season and early wet-season fire<br />
treatments in 2011 increased markedly;<br />
levels were similar to those in 2007<br />
following the application <strong>of</strong> the first fire<br />
treatments in 2006 (Figure 1.3). Grader<br />
grass biomass in the late wet-season fire<br />
treatment remained similar to that in the<br />
control and herbicide treatments, as the<br />
four-yearly fire in this treatment was<br />
applied only after biomass measurements<br />
were conducted in the late wet season.<br />
The effect <strong>of</strong> late wet-season fires will be<br />
seen in following years.<br />
These results continue to confirm that<br />
grader grass invasion and dominance<br />
is inherently related to the frequency<br />
<strong>of</strong> fire or other disturbances within<br />
pasture systems. They also suggest that<br />
minimising disturbance is a critical<br />
factor in reducing the presence and<br />
impact <strong>of</strong> this invasive grass.<br />
Grader grass (%)<br />
100<br />
90<br />
80<br />
70<br />
60<br />
50<br />
40<br />
30<br />
20<br />
10<br />
0<br />
late dry-season fires early wet-season fires<br />
late wet-season fires herbicide<br />
control<br />
2006 2007 2008 2009 2010 2011<br />
Year<br />
Figure 1.1 Grader grass response to yearly fires at Undara National Park<br />
Grader grass (%)<br />
100<br />
90<br />
80<br />
70<br />
60<br />
50<br />
40<br />
30<br />
20<br />
10<br />
0<br />
late dry-season fires early wet-season fires<br />
late wet-season fires herbicide<br />
control<br />
2006 2007 2008 2009 2010 2011<br />
4 <strong>Technical</strong> <strong>highlights</strong>: research projects 2010–11<br />
Year<br />
Figure 1.2 Grader grass response to two-yearly fires at Undara National Park<br />
Grader grass (%)<br />
100<br />
90<br />
80<br />
70<br />
60<br />
50<br />
40<br />
30<br />
20<br />
10<br />
0<br />
late dry-season fires early wet-season fires<br />
late wet-season fires herbicide<br />
control<br />
2006 2007 2008 2009 2010 2011<br />
Year<br />
Figure 1.3 Grader grass response to four-yearly fires at Undara National Park
Funding in 2010–11<br />
Queensland Government<br />
Collaborators<br />
• DERM, Undara National Park<br />
• Northern Gulf Resource Management<br />
Group<br />
• Southern Gulf Catchments<br />
• Landholders<br />
More information<br />
Key publications<br />
Vogler, WD 2009, Grader grass<br />
management guide, Burdekin Dry Tropics<br />
Natural Resource Management, Northern<br />
Gulf Resource Management Group,<br />
Southern Gulf Catchments, 8 pp.<br />
Vogler, WD & Owen, NA 2008,<br />
‘Grader grass (Themeda quadrivalvis):<br />
changing savannah ecosystems’, in<br />
RD van Klinken, VA Osten, FD Panetta<br />
& JC Scanlan (eds), Proceedings <strong>of</strong> the<br />
16th Australian Weeds Conference,<br />
Queensland Weeds Society, Brisbane,<br />
p. 213.<br />
Keir, AF & Vogler, WD 2006, ‘A review <strong>of</strong><br />
current knowledge <strong>of</strong> the weedy species<br />
Themeda quadrivalvis (grader grass)’,<br />
Tropical Grasslands 40(4): 193–201.<br />
For further information on this<br />
research project and access to key<br />
publications, visit the invasive plant<br />
and animal science pages on the<br />
Biosecurity Queensland website at<br />
www.biosecurity.qld.gov.au<br />
Part 1 Integrated weed management 5
2. Integrated management <strong>of</strong> bellyache bush (Jatropha gossypiifolia)<br />
in northern Queensland<br />
Project dates<br />
July 2000 – June 2011 (completed)<br />
Project leader<br />
Dr Faiz Bebawi<br />
Tropical Weeds Research Centre<br />
Tel: (07) 4761 5716<br />
Email: faiz.bebawi@deedi.qld.gov.au<br />
Other staff in 2010–11<br />
Chris Crowley<br />
Objectives<br />
• Develop an integrated management<br />
strategy for bellyache bush.<br />
• Evaluate the efficacy <strong>of</strong> combinations<br />
<strong>of</strong> fire, slashing and foliar herbicides<br />
on the mortality, seedling recruitment<br />
and survival <strong>of</strong> bellyache bush.<br />
• Better understand the ecology <strong>of</strong><br />
bellyache bush and its implications<br />
for timing and effectiveness <strong>of</strong><br />
control strategies.<br />
• Promote changes in management<br />
practices that will lead to sustainable<br />
levels <strong>of</strong> production.<br />
Rationale<br />
Bellyache bush (Jatropha gossypiifolia),<br />
a native <strong>of</strong> tropical America, is a major<br />
weed <strong>of</strong> the Burdekin and Palmer<br />
River catchments in Queensland. It is<br />
also starting to spread in the Fitzroy<br />
catchment and other areas <strong>of</strong> central and<br />
northern Queensland. Dense infestations<br />
generally form along river flats, creek<br />
banks and disturbed roadsides.<br />
This project helps to fill gaps in our<br />
knowledge about the seed ecology,<br />
competitive ability under different<br />
grazing pressures and population<br />
dynamics <strong>of</strong> bellyache bush. It also<br />
assesses the impact <strong>of</strong> integrated control<br />
techniques; this will help in developing<br />
strategies for best practice management.<br />
Methods<br />
This project includes two areas <strong>of</strong><br />
research—integrated weed control and<br />
weed ecology <strong>of</strong> bellyache bush.<br />
Integrated weed control<br />
We trial individual and integrated<br />
control techniques to determine the<br />
most effective combination <strong>of</strong> burning,<br />
slashing, stick-raking and chemical<br />
treatments for controlling bellyache bush.<br />
Weed ecology<br />
Seed longevity (initiated in<br />
March 2001)<br />
We bury two types <strong>of</strong> bellyache bush<br />
seeds (intact and ant-discarded) at six<br />
depths (0 cm on mulched ground; 0 cm<br />
on bare ground; depths <strong>of</strong> 5 cm, 10 cm,<br />
20 cm and 40 cm) under two rainfall<br />
regimes (natural rainfall and rainfallexcluded).<br />
Pasture management research<br />
(initiated in September 2002)<br />
In a competition trial we determine<br />
the impact <strong>of</strong> five simulated grazing<br />
regimes:<br />
1. no grazing (uncut pasture)<br />
2. low grazing (cut at 40 cm height)<br />
3. medium grazing (cut at 20 cm height)<br />
4. high grazing (cut at 10 cm height)<br />
5. no pasture (pasture removed).<br />
These are applied to four plant densities:<br />
1. control (no bellyache bush)<br />
2. low density (2 plants m –2 )<br />
3. medium density (6 plants m –2 )<br />
4. high density (12 plants m –2 ).<br />
Findings<br />
Integrated weed control<br />
Field trials were completed in June<br />
2006. For the final results, see <strong>Technical</strong><br />
<strong>highlights</strong> 2005–06. A scientific paper<br />
on the results has now been published in<br />
The Rangeland Journal.<br />
Weed ecology<br />
Seed longevity<br />
Under natural rainfall conditions, intact<br />
seeds exhumed were all expired after<br />
36 months, compared with 72 months<br />
for ant-discarded seeds. At the rainfallexcluded<br />
site, all intact seeds expired<br />
84 months after burial. However, antdiscarded<br />
seeds showed some signs <strong>of</strong><br />
viability (average 1%) even 120 months<br />
after burial (Figure 2.1). There were<br />
significant interactions between burial<br />
conditions, seed types and burial depths<br />
(Figure 2.2). Generally seed viability<br />
declined with burial depths except for<br />
ant-discarded seeds, where it remained<br />
nearly constant over all burial depths<br />
under natural conditions. Intact seeds<br />
appear to be more sensitive to burial<br />
conditions and burial depth than antdiscarded<br />
seeds.<br />
Pasture management research<br />
There were significant interactions<br />
between treatment duration and<br />
simulated grazing regimes impacting on<br />
bellyache bush mortality (Figure 2.3).<br />
After 9 years, 55% <strong>of</strong> original bellyache<br />
bush plants died in areas void <strong>of</strong> pasture.<br />
In contrast, 73%, 77%, 77% and 79%<br />
mortality occurred in simulated regimes<br />
with no grazing, low grazing, medium<br />
grazing and high grazing, respectively.<br />
Funding in 2010–11<br />
Queensland Government<br />
Collaborator<br />
Ralph Woodard (Branmore Station)<br />
More information<br />
Key publications<br />
Bebawi, FF, Vitelli, JS, Campbell, SD<br />
& Mayer, RJ 2011, ‘Impact <strong>of</strong> control<br />
strategies on bellyache bush (Jatropha<br />
gossypiifolia L.) mortality, seedling<br />
recruitment, population dynamics,<br />
pasture yield and cost analysis’, The<br />
Rangeland Journal 33(3): 277–86.<br />
Randall, A, Campbell, S, Vogler, W,<br />
Bebawi, F & Madigan, B 2009,<br />
Bellyache bush (Jatropha gossypiifolia)<br />
management manual: control options and<br />
management case studies from across<br />
Australia, <strong>Department</strong> <strong>of</strong> Employment,<br />
Economic Development and Innovation,<br />
Brisbane, 104 pp.<br />
Bebawi, FF, Vitelli, JS, Campbell, SD,<br />
Vogler, WD, Lockett, CJ, Grace, BS,<br />
Lukitsch, B & Heard, TA 2007, ‘The<br />
biology <strong>of</strong> Australian weeds 47. Jatropha<br />
gossypiifolia L.’, Plant Protection<br />
Quarterly 22(2): 42–58.<br />
Bebawi, FF, Cooper, AP, Brodie, GI,<br />
Madigan, BA, Vitelli, JS, Worsley, KJ &<br />
Davis, KM 2007, ‘Effect <strong>of</strong> microwave<br />
radiation on seed mortality <strong>of</strong> rubber<br />
vine (Cryptostegia grandiflora R Br.),<br />
parthenium (Parthenium<br />
hysterophorous L.) and bellyache<br />
6 <strong>Technical</strong> <strong>highlights</strong>: research projects 2010–11
ush (Jatropha gossypiifolia L.)’, Plant<br />
Protection Quarterly 22(4): 136–42.<br />
Bebawi, FF, Mayer, RJ & Campbell, SD<br />
2005, ‘Flowering and capsule<br />
production <strong>of</strong> bellyache bush (Jatropha<br />
gossypiifolia L.)’, Plant Protection<br />
Quarterly 20(4): 129–32.<br />
Bebawi, FF, Mayer, RJ & Campbell, SD<br />
2005, ‘Phenology <strong>of</strong> bellyache bush<br />
(Jatropha gossypiifolia L.) in northern<br />
Queensland’, Plant Protection Quarterly<br />
20(2): 46–51.<br />
Bebawi, FF & Campbell, SD 2004,<br />
‘Interactions between meat ants<br />
(Iridomyrmex spadius) and bellyache<br />
bush (Jatropha gossypiifolia)’, Australian<br />
Journal <strong>of</strong> Experimental Agriculture<br />
44(12): 1157–64.<br />
Bebawi, FF & Campbell, SD 2002, ‘Effects<br />
<strong>of</strong> fire on germination and viability <strong>of</strong><br />
bellyache bush (Jatropha gossypiifolia)<br />
seeds’, Australian Journal <strong>of</strong> Experimental<br />
Agriculture 42(8): 1063–9.<br />
Bebawi, FF & Campbell, SD 2002,<br />
‘Impact <strong>of</strong> fire on bellyache bush<br />
(Jatropha gossypiifolia) plant mortality<br />
and seedling recruitment’, Tropical<br />
Grasslands 36(3): 129–37.<br />
Bebawi, FF & Campbell, SD 2002, ‘The<br />
response <strong>of</strong> bellyache bush (Jatropha<br />
gossypiifolia) plants cut <strong>of</strong>f at different<br />
heights and seasonal times’, Tropical<br />
Grasslands 36(2): 65–8.<br />
For further information on this research<br />
project and access to key publications,<br />
visit the invasive plant and animal<br />
science pages on the Biosecurity<br />
Queensland website at<br />
www.biosecurity.qld.gov.au<br />
Seed viability (%)<br />
100<br />
90<br />
80<br />
70<br />
60<br />
50<br />
40<br />
30<br />
20<br />
10<br />
0<br />
natural rainfall<br />
rainfall-excluded<br />
standard error<br />
0 3 6 9 12 24 36 48 60 72 84 96 108 120 0 3 6 9 12 24 36 48 60 72 84 96 108 120<br />
Intact Ant-discarded<br />
Seed type and burial duration (months)<br />
Figure 2.1 Viability <strong>of</strong> intact and ant-discarded seeds as affected by burial duration and rainfall<br />
regime, averaged over all burial depths<br />
Seed viability (%)<br />
70<br />
60<br />
50<br />
40<br />
30<br />
20<br />
10<br />
0<br />
0 0 5 10 20 40 0 0 5 10 20 40<br />
(with (without<br />
mulch) mulch)<br />
Part 1 Integrated weed management 7<br />
Intact<br />
(with (without<br />
mulch) mulch)<br />
Seed type and burial depth (cm)<br />
Ant-discarded<br />
natural rainfall<br />
rainfall-excluded<br />
standard error<br />
Figure 2.2 Viability <strong>of</strong> intact and ant-discarded seeds as affected by burial depth and rainfall<br />
regime, averaged over all years<br />
Mortality (%)<br />
90<br />
80<br />
70<br />
60<br />
50<br />
40<br />
30<br />
20<br />
10<br />
0<br />
no pasture<br />
no grazing<br />
low grazing<br />
medium grazing<br />
high grazing<br />
standard error<br />
0 1 2 3 4 5 6 7 8 9<br />
Treatment duration (years)<br />
Figure 2.3 Mortality <strong>of</strong> bellyache bush plants as affected by simulated grazing regime and<br />
treatment duration, averaged over all plant densities
3. Ecology <strong>of</strong> Captain Cook tree (Cascabela thevetia) in northern Queensland<br />
Project dates<br />
July 2007 – June 2012<br />
Project leader<br />
Dr Faiz Bebawi<br />
Tropical Weeds Research Centre<br />
Tel: (07) 4761 5716<br />
Email: faiz.bebawi@deedi.qld.gov.au<br />
Other staff in 2010–11<br />
Chris Crowley<br />
Objective<br />
Better understand the ecology <strong>of</strong> Captain<br />
Cook tree and the implications for timing<br />
and effectiveness <strong>of</strong> control strategies.<br />
Rationale<br />
Captain Cook tree (Cascabela thevetia)<br />
is a Class 3 declared weed in<br />
Queensland. It is a garden escapee that<br />
has established some relatively large<br />
infestations in northern Queensland,<br />
particularly along banks <strong>of</strong> the Douglas<br />
River and major creeks <strong>of</strong> the lower and<br />
upper Burdekin catchment near Mingela<br />
and Ravenswood. Captain Cook tree is<br />
toxic to humans and animals. Dense<br />
infestations <strong>of</strong> this weed out-compete<br />
native pastures and reduce plant and<br />
animal biodiversity, as well as pasture<br />
productivity. It will continue to spread<br />
throughout its current range unless<br />
controlled. Understanding the ecology<br />
<strong>of</strong> Captain Cook tree is essential to<br />
developing effective management<br />
strategies and reducing its economic,<br />
environmental and social impacts.<br />
Methods<br />
This project entails six experiments,<br />
three <strong>of</strong> which are ongoing.<br />
Experiment 2 (initiated in<br />
December 2007)<br />
We determine the age to reproductive<br />
maturity <strong>of</strong> peach-flowering and yellowflowering<br />
plants under different light<br />
and plant density conditions at the<br />
Tropical Weeds Research Centre (TWRC).<br />
The experiment uses a 2 × 4 × 2 factorial<br />
replicated four times using a split-split<br />
plot design. Factor A comprises light<br />
regime (natural light and 70% shade)<br />
assigned to the main plots, factor B is<br />
planting density (1, 2, 4 and 8 plants<br />
per pot) assigned to the sub-plots, and<br />
factor C is flowering type (peach and<br />
yellow) assigned to the sub-sub-plots.<br />
We grow plants from seed in plastic pots<br />
(50 cm diameter × 40 cm depth) filled<br />
with river loam soil and we monitor<br />
growth rate (basal diameter and plant<br />
height), age to reproductive maturity,<br />
flowering density (number <strong>of</strong> flowering<br />
stalks) and seed production.<br />
Experiment 3 (initiated in<br />
January 2008)<br />
We determine growth, seedling survival<br />
and age to reproductive maturity <strong>of</strong><br />
peach-flowering plants growing in<br />
the field at Will Creek, Mingela, under<br />
either full shade or natural light.<br />
The experiment uses a completely<br />
randomised design with six replications.<br />
For the light treatment we cut-stump<br />
dense infestations <strong>of</strong> established Captain<br />
Cook tree plants. Cut-stumping involves<br />
cutting plants at 5 cm height with a<br />
brush-cutter and then immediately<br />
applying herbicide to the cut surface.<br />
The control treatment (shade treatment)<br />
is left uncut so that a fully closed<br />
canopy is present above the seedlings.<br />
We tag 25 seedlings (with cotyledons<br />
still attached to the hypocotyl) emerging<br />
after the first rainfall event in each plot<br />
and monitor their growth rate (basal<br />
diameter and plant height), survival rate<br />
and age to reproductive maturity.<br />
Experiment 6 (initiated in<br />
August 2009)<br />
We detail sap-flow velocity and wateruse<br />
efficiency <strong>of</strong> three size classes<br />
(60–90 mm, 91–130 mm and<br />
131–230 mm basal stem diameter) <strong>of</strong><br />
Captain Cook trees (peach-flowering<br />
type) growing under natural conditions<br />
at Will Creek, Mingela. We establish<br />
sap-flow sensors on 15 plants, including<br />
two natives (eucalypt and black tea tree)<br />
to collect data on sap-flow velocity and<br />
volume <strong>of</strong> water transpired on an hourly<br />
basis. Data is downloaded at monthly<br />
intervals from a Smart Logger TM .<br />
Processed data will provide information<br />
on the periodicity <strong>of</strong> physiological<br />
activity <strong>of</strong> Captain Cook trees, which<br />
will be used to refine the timing <strong>of</strong><br />
control activities to maximise mortality.<br />
Progress in 2010–11<br />
Experiments 1, 4 and 5 are completed.<br />
For key results, see <strong>Technical</strong> <strong>highlights</strong><br />
2008–09 and <strong>Technical</strong> <strong>highlights</strong><br />
2009–10.<br />
Experiment 2<br />
This experiment is now completed,<br />
following the collection <strong>of</strong> three years<br />
<strong>of</strong> pod production data. Results show<br />
that pod production was significantly<br />
affected by flowering types, light<br />
conditions, plant density, months<br />
and years. Both flowering biotypes<br />
produced pods all year round although<br />
there was great variation between<br />
months (Figure 3.1). Yellow-flowering<br />
plants consistently produced more<br />
pods than peach-flowering ones across<br />
all treatments (Figure 3.2). For both<br />
flowering types, average pod production<br />
per plant was higher under full sunlight<br />
than under shaded conditions. Increased<br />
plant density also caused a decline in<br />
pod production for both flowering types<br />
(Figure 3.2)<br />
Other key findings were reported in<br />
<strong>Technical</strong> <strong>highlights</strong> 2008–09 and<br />
<strong>Technical</strong> <strong>highlights</strong> 2009–10.<br />
8 <strong>Technical</strong> <strong>highlights</strong>: research projects 2010–11
.<br />
Pod production (pods per plant)<br />
25<br />
20<br />
15<br />
10<br />
5<br />
0<br />
peach in light<br />
peach in shade<br />
yellow in light<br />
yellow in shade<br />
standard error<br />
J F M A M J J A S O N D<br />
Month<br />
Figure 3.1 Pod production <strong>of</strong> the peach-flowering and yellow-flowering biotypes <strong>of</strong> Captain<br />
Cook tree as affected by months and light conditions<br />
Pod production (pods per plant)<br />
30<br />
25<br />
20<br />
15<br />
10<br />
5<br />
0<br />
peach in light<br />
peach in shade<br />
yellow in light<br />
yellow in shade<br />
standard error<br />
1 2 4 8<br />
Plant density (plants per pot)<br />
Figure 3.2 Pod production <strong>of</strong> the peach-flowering and yellow-flowering biotypes <strong>of</strong> Captain<br />
Cook tree as affected by plant densities and light conditions<br />
Podding plants (%)<br />
60<br />
50<br />
40<br />
30<br />
20<br />
10<br />
0<br />
0.5 1.0 1.5 2.0 2.5 3.0 3.5<br />
Years after germination<br />
light<br />
shade<br />
standard error<br />
Figure 3.3 Percentage <strong>of</strong> peach-flowering plants producing pods under light and shaded<br />
conditions at Mingela<br />
Experiment 3<br />
Approximately 3.3 years after<br />
germination, 81% <strong>of</strong> peach-flowering<br />
plants exposed to full sunlight conditions<br />
were alive. In contrast, 45% <strong>of</strong> plants<br />
growing under full shade had died.<br />
Those remaining alive were on average<br />
1.3 m and 0.4 m in height when grown<br />
under sunlight and shaded conditions,<br />
respectively. Furthermore, 44% <strong>of</strong><br />
the original plants exposed to full<br />
sunlight have started producing pods,<br />
compared with no plants in shaded areas<br />
(Figure 3.3). The experiment is ongoing.<br />
Part 1 Integrated weed management 9
Growing degree days<br />
6<br />
5<br />
4<br />
3<br />
2<br />
1<br />
0<br />
Experiment 6<br />
J F M A M J J A S O N D<br />
Month<br />
Mature, adult and old Captain Cook trees<br />
consumed an average <strong>of</strong> 1023, 908 and<br />
657 L <strong>of</strong> water per year, respectively.<br />
However, considerable variation in water<br />
consumption occurred on a monthly<br />
basis (Figure 3.4), and there was a strong<br />
correlation (R 2 = 0.70) between growing<br />
degree days and water consumption.<br />
Water consumption and the number <strong>of</strong><br />
growing degree days were lowest during<br />
winter and highest during the summer<br />
months.<br />
growing degree days<br />
water volume (L)<br />
Figure 3.4 Water consumption <strong>of</strong> Captain Cook tree (across all size classes) associated with<br />
growing degree days<br />
Funding in 2010–11<br />
Queensland Government<br />
Collaborators<br />
• John Ramsey, Landholder (Meadow<br />
Vale Cattle Station, Mingela)<br />
• Bob J. Mayer, Senior Biometrician<br />
[<strong>Department</strong> <strong>of</strong> Employment,<br />
Economic Development and<br />
Innovation (DEEDI), Oonoonba]<br />
• Carole Wright, Biometrician (DEEDI,<br />
Oonoonba)<br />
More information<br />
For further information on this<br />
research project, visit the invasive<br />
plant and animal science pages on the<br />
Biosecurity Queensland website at<br />
www.biosecurity.qld.gov.au<br />
10 <strong>Technical</strong> <strong>highlights</strong>: research projects 2010–11<br />
140<br />
120<br />
100<br />
80<br />
60<br />
40<br />
20<br />
0<br />
Water consumption (L)
4. Weed seed dynamics<br />
Project dates<br />
August 2007 – June 2020<br />
Project leader<br />
Dr Faiz Bebawi<br />
Tropical Weeds Research Centre<br />
Tel: (07) 4761 5716<br />
Email: faiz.bebawi@deedi.qld.gov.au<br />
Other staff in 2010–11<br />
Chris Crowley<br />
Objectives<br />
• Determine the seed longevity <strong>of</strong><br />
several priority weeds found in<br />
central and northern Queensland for<br />
which data is currently limited.<br />
• Develop germination and viability<br />
testing techniques for the<br />
abovementioned weeds if none<br />
are available.<br />
• Disseminate the results and<br />
implications <strong>of</strong> the research through<br />
scientific publications, media<br />
stories and presentations to relevant<br />
stakeholder groups.<br />
Rationale<br />
Currently there are many declared weeds<br />
for which we know very little about<br />
seed ecology, particularly germination<br />
requirements and longevity. Such<br />
information is important in control<br />
programs as it allows land managers<br />
to plan activities based on the length<br />
<strong>of</strong> time that will be required to deplete<br />
seed banks in the absence <strong>of</strong> any<br />
replenishment. This project will provide<br />
this information for priority species in<br />
central and northern Queensland.<br />
Methods<br />
A long-term experiment designed to<br />
determine the seed longevity <strong>of</strong> up to<br />
12 priority weed species is conducted on<br />
the grounds <strong>of</strong> TWRC. The experiment<br />
uses a 2 × 2 × 4 × 12 factorial design,<br />
with factor A comprising two soil types<br />
(alluvial and clay), factor B two levels <strong>of</strong><br />
grass cover (nil or full cover), factor C<br />
four burial depths (0, 2.5, 10 and 20 cm)<br />
and factor D ten sampling periods<br />
(0, 3 and 6 months; 1, 2, 4, 6, 8, 10 and<br />
13 years). Each treatment is replicated<br />
four times.<br />
Species buried so far include nine Class 2<br />
or Class 3 declared weeds—calotrope<br />
(Calotropis procera), yellow-flowering<br />
and peach-flowering Captain Cook<br />
tree (Cascabela thevetia), chinee apple<br />
(Ziziphus mauritiana), gamba grass<br />
(Andropogon gayanus), orange-flowering<br />
and pink-flowering lantana (Lantana<br />
camara), mesquite (Prosopis pallida),<br />
parthenium (Parthenium hysterophorus),<br />
prickly acacia (Acacia nilotica ssp.<br />
indica) and yellow bells (Tecoma stans),<br />
along with two other species—leucaena<br />
(Leucaena leucocephala ssp. glabrata)<br />
and neem (Azadirachta indica).<br />
Progress in 2010–11<br />
Preliminary results suggest that chinee<br />
apple, Captain Cook tree, calotrope,<br />
neem and yellow bells have short-lived<br />
seed banks, with no viable seed recorded<br />
after 24 months burial. To confirm this<br />
finding, we buried a fresh batch <strong>of</strong> seeds<br />
<strong>of</strong> chinee apple and the peach-flowering<br />
variety <strong>of</strong> Captain Cook tree in October<br />
2010 to expose them to another set <strong>of</strong><br />
environmental conditions. Fresh viable<br />
seed <strong>of</strong> calotrope are currently sourced<br />
for a repeat burial.<br />
Mesquite has also demonstrated a<br />
rapid loss <strong>of</strong> viable seed from the seed<br />
bank following burial (< 1% viability<br />
after 24 months burial). In contrast,<br />
prickly acacia, leucaena, lantana and<br />
parthenium are showing a greater level<br />
<strong>of</strong> persistence.<br />
Gamba grass from the Cape York region<br />
was added to the trial in June 2010.<br />
Funding in 2010–11<br />
• Land Protection Fund ($47 000)<br />
• Queensland Government<br />
Collaborators<br />
• Bob J. Mayer, Senior Biometrician<br />
(DEEDI, Oonoonba)<br />
• Carole Wright, Biometrician (DEEDI,<br />
Oonoonba)<br />
More information<br />
For further information on this<br />
research project, visit the invasive<br />
plant and animal science pages on the<br />
Biosecurity Queensland website at<br />
www.biosecurity.qld.gov.au<br />
Part 1 Integrated weed management 11
5. Controlling calotrope (Calotropis procera) in northern Australia<br />
Project dates<br />
June 2010 – June 2014<br />
Project leader<br />
Dr Shane Campbell<br />
Tropical Weeds Research Centre<br />
Tel: (07) 4761 5704<br />
Email: shane.campbell@deedi.qld.gov.au<br />
Other staff in 2010–11<br />
Chris O’Donnell, Laura Roden, Kelli<br />
Pukallus and Wayne Vogler<br />
Objective<br />
Develop improved control options for<br />
calotrope.<br />
Rationale<br />
Several prioritisation processes have<br />
listed calotrope (Calotropis procera) as<br />
an economic and environmental weed in<br />
northern Australia’s rangelands. Native<br />
to tropical Africa and Asia, calotrope<br />
has spread into areas <strong>of</strong> northern<br />
Queensland, the Northern Territory and<br />
the Kimberley in Western Australia, but<br />
this represents only a small portion <strong>of</strong> its<br />
potential range.<br />
A national literature review by Grace<br />
(2006) and a workshop sponsored by<br />
Meat and Livestock Australia (MLA)<br />
in 2007 identified key gaps in our<br />
understanding <strong>of</strong> the invasiveness and<br />
impacts <strong>of</strong> calotrope and our ability to<br />
manage it. These included distribution<br />
and rate <strong>of</strong> spread, reproductive biology,<br />
grazing effects and methods <strong>of</strong> control.<br />
This project is part <strong>of</strong> a larger<br />
collaborative MLA-funded research<br />
project aimed at addressing these<br />
knowledge gaps. Biosecurity Queensland<br />
is focusing on improving control<br />
options, while other aspects are being<br />
investigated primarily by Charles<br />
Darwin University and the Northern<br />
Territory Government <strong>Department</strong> <strong>of</strong><br />
Natural Resources, Environment, The<br />
Arts and Sport (NRETAS).<br />
Methods<br />
Establishment <strong>of</strong> an advisory<br />
committee<br />
An advisory committee, initially set up<br />
after the 2007 MLA workshop, has been<br />
re-established to oversee the project<br />
and ensure it achieves its objectives.<br />
An initial stakeholder workshop was<br />
held to present the proposed research<br />
program and ensure that it is appropriate<br />
to address critical information gaps on<br />
calotrope.<br />
Foliar herbicide control<br />
To compare new and unregistered foliar<br />
herbicides with currently available<br />
options, we conduct a split-plot<br />
experiment comprising 22 herbicide<br />
treatments (main plot) and two plant<br />
sizes (sub-plot) on a property in<br />
Queensland’s gulf country. Chemicals<br />
tested include metsulfuron-methyl,<br />
2,4-D, triclopyr, triclopyr + picloram,<br />
fluroxypr, aminopyralid + fluroxypr,<br />
2,4-D + picloram, triclopyr + picloram<br />
+ aminopyralid, 2,4-D + picloram,<br />
metsulfuron-methyl + 2,4-D, and four<br />
new unregistered formulations (one<br />
from DuPont Australia and three from<br />
Dow AgroSciences). The most effective<br />
herbicides will be further trialled to<br />
refine rates and test for seasonal effects.<br />
Practical options for control <strong>of</strong><br />
isolated plants<br />
We also aim to identify herbicide<br />
products and techniques that can be<br />
easily and practically used as part<br />
<strong>of</strong> day-to-day activities to control<br />
isolated calotrope plants without using<br />
excessive equipment. Firstly, we conduct<br />
an experiment at the same location<br />
as the foliar herbicide trial using two<br />
herbicides (Vigilant® gel and Roundup<br />
Powermax®) as either a cut stump or<br />
frill application. Secondly, we test the<br />
efficacy <strong>of</strong> tebuthiuron at a site near<br />
Charters Towers, with pellets applied<br />
either around the plant’s drip zone or at<br />
the base <strong>of</strong> the stem, to test the efficacy<br />
<strong>of</strong> a residual herbicide and determine if<br />
the placement location <strong>of</strong> the pellets is<br />
important.<br />
Mechanical control<br />
We explore in detail the efficacy <strong>of</strong><br />
mechanical control by first quantifying<br />
the level <strong>of</strong> damage required to<br />
cause mortality and then comparing<br />
the efficacy <strong>of</strong> a range <strong>of</strong> available<br />
equipment.<br />
Herbivory study<br />
To help quantify whether biological<br />
control agents could deleteriously<br />
affect the growth and development <strong>of</strong><br />
calotrope, we undertake a simulated<br />
herbivory study in the glasshouse<br />
at TWRC. Potted calotrope plants<br />
(C. procera and C. gigantea) are grown<br />
until they are 14 weeks old and are then<br />
subjected to one <strong>of</strong> seven damage levels<br />
(nil, leaf, stem, root, leaf + stem, leaf +<br />
root, stem + root) either once, twice or<br />
three times at eight-weekly intervals.<br />
We monitor their growth, development<br />
and reproductive status at each interval<br />
before destructively harvesting all plants<br />
eight weeks after the third treatment.<br />
Progress in 2010–11<br />
Establishment <strong>of</strong> an advisory<br />
committee<br />
The advisory committee—comprising<br />
representatives from state and territory<br />
governments, pastoral companies,<br />
natural resource management bodies,<br />
community groups and Charles Darwin<br />
University—had its inaugural meeting<br />
at Katherine in 2010. A stakeholder<br />
workshop was held afterwards to discuss<br />
the proposed research program.<br />
Foliar herbicide control<br />
We applied herbicides in April 2010, with<br />
several products showing good brownout<br />
soon after. Monitoring will continue for<br />
12–24 months, given calotrope’s ability<br />
to remain dormant and reshoot many<br />
months after treatment.<br />
Practical options for control <strong>of</strong><br />
isolated plants<br />
The cut stump or frill application and<br />
the tebuthiuron experiment commenced<br />
in June 2010 and February 2011<br />
respectively.<br />
12 <strong>Technical</strong> <strong>highlights</strong>: research projects 2010–11
Photo 5.1 Experimentalist Laura Roden (left) and scientific assistant Kirsty Gough inspect<br />
flowers on C. gigantea and C. procera during the simulated herbivory trial<br />
Herbivory study<br />
We have initiated the herbivory study<br />
in March 2011, with both the single and<br />
double treatments now imposed.<br />
Other activities<br />
A monitoring site was established on<br />
Helen Springs Station to assess the<br />
efficacy <strong>of</strong> basal bark and tebuthiuron<br />
control (undertaken by a commercial<br />
contractor). Data analysis is in progress.<br />
Collaborators at Charles Darwin<br />
University have recently commenced<br />
studies into the ecology <strong>of</strong> calotrope and<br />
identified a suitable PhD candidate to<br />
join their team.<br />
Reference<br />
Grace, BS 2006, ‘The biology <strong>of</strong><br />
Australian weeds 45. Calotropis procera<br />
(Aiton) W.T. Aiton’, Plant Protection<br />
Quarterly 21(4): 152–60.<br />
Funding in 2010–11<br />
• MLA ($90 000)<br />
• Queensland Government<br />
Collaborators<br />
• MLA<br />
• Charles Darwin University<br />
• NRETAS, Northern Territory<br />
• Barkly Landcare Association<br />
More information<br />
Key publication<br />
Vitelli, J, Madigan, B, Wilkinson, P<br />
& van Haaren, P 2008, ‘Calotrope<br />
(Calotropis procera) control’, The<br />
Rangeland Journal 30(3): 339–48.<br />
For further information on this research<br />
project and access to key publications,<br />
visit the invasive plant and animal science<br />
pages on the Biosecurity Queensland<br />
website at www.biosecurity.qld.gov.au<br />
Part 1 Integrated weed management 13
6. Herbicide application research<br />
Project dates<br />
June 2008 – ongoing<br />
Project leader<br />
John McKenzie<br />
Tropical Weeds Research Centre<br />
Tel: (07) 4761 5718<br />
Email: john.mckenzie@deedi.qld.gov.au<br />
Other staff in 2010–11<br />
Dannielle Brazier<br />
Objectives<br />
• Evaluate the effectiveness <strong>of</strong> chemical<br />
control techniques, including basal<br />
bark spraying, foliar spraying, cut<br />
stump, stem injection and splatter<br />
gun spraying, on Captain Cook tree.<br />
• Evaluate the effectiveness <strong>of</strong> stem<br />
injection on prickly acacia, chinee<br />
apple and calotrope.<br />
• Evaluate the effectiveness <strong>of</strong> splatter<br />
gun spraying on bellyache bush.<br />
Rationale<br />
Captain Cook tree (Cascabela thevetia)<br />
is a Class 3 weed. It is a garden escapee<br />
that has established some relatively large<br />
infestations in northern Queensland,<br />
particularly along the banks <strong>of</strong> the<br />
Douglas River and major creeks <strong>of</strong> the<br />
lower and upper Burdekin catchment near<br />
Mingela and Ravenswood. Developing<br />
effective control techniques is essential<br />
to stopping the continued spread <strong>of</strong> this<br />
weed. Presently, there is no registered<br />
chemical available for its control.<br />
There is a need to further explore waterbased<br />
herbicide applications that are<br />
suitable for sensitive environments and<br />
cheaper than those that use diesel as the<br />
carrier. We investigated stem injection as<br />
a possible method to reduce the amount<br />
<strong>of</strong> chemical required and to eliminate<br />
the diesel component for treating large,<br />
established trees along creek systems.<br />
There is also a need for a highly mobile<br />
control technique (such as splatter gun<br />
spraying) to control bellyache bush in<br />
inaccessible locations where it is not<br />
possible to use vehicle-mounted foliar<br />
spray equipment.<br />
Methods<br />
Captain Cook tree trials<br />
We conduct four experiments near<br />
Mingela to determine which herbicides<br />
and rates are most effective in<br />
controlling Captain Cook tree using<br />
basal bark spraying, foliar spraying,<br />
cut stump, stem injection and splatter<br />
gun spraying techniques. Experiments<br />
for each technique are completely<br />
randomised, incorporating three<br />
replications. We test the efficacy <strong>of</strong><br />
herbicides on three size classes (< 20,<br />
20–50 and > 50 mm basal diameter at<br />
20 cm above the ground). Each size class<br />
comprises 10 plants that are tagged and<br />
painted for future reference. We also<br />
record their reproductive status prior<br />
to treatment.<br />
Based on results from the screening<br />
trials, we undertake further trials to<br />
refine rates for the most promising<br />
herbicides. These are conducted at the<br />
same site and use a methodology similar<br />
to that <strong>of</strong> the screening trials.<br />
Stem injection trials<br />
We conduct stem injection trials<br />
on prickly acacia, chinee apple<br />
and calotrope using a completely<br />
randomised block design. Each<br />
treatment is replicated three times and<br />
individual plots comprise 20 plants.<br />
For the screening trial we apply 1 mL<br />
<strong>of</strong> herbicide mix from a Phillips TM<br />
tree injector gun into incisions with<br />
centres 7 cm apart. Incisions are cut<br />
with a tommyhawk axe at an angle <strong>of</strong><br />
approximately 10 degrees to the stem<br />
at a height that is comfortable to the<br />
applicator. We also record the number<br />
and height <strong>of</strong> incisions for each plant.<br />
Herbicides used for this trial are either<br />
registered for stem injection for other<br />
species or have active ingredients that<br />
have been effective in controlling these<br />
weeds when using other application<br />
methods.<br />
Based on results from the screening<br />
trials, we undertake further trials to<br />
refine rates for the most promising<br />
herbicides. These are conducted at the<br />
same site and use a methodology similar<br />
to that <strong>of</strong> the screening trials.<br />
Bellyache bush splatter gun trial<br />
We conduct a splatter gun screening<br />
trial on bellyache bush. Each treatment<br />
is replicated three times and individual<br />
plots comprise 20 plants. For this trial<br />
we use an NJ Phillips Powermaster<br />
Forestry TM applicator with a portable<br />
LPG power supply. Chemicals are<br />
applied at 4 mL for each 50 cm <strong>of</strong> plant<br />
height. Herbicides used in this trial have<br />
generally been found effective when<br />
using foliar application methods.<br />
Progress in 2010–11<br />
Captain Cook tree trials<br />
From the rate screening trials, we have<br />
identified chemicals and application<br />
rates that will provide high mortality<br />
<strong>of</strong> Captain Cook tree using basal bark<br />
spraying, foliar spraying, cut stump and<br />
stem injection techniques (Table 6.1).<br />
Fluroxypyr has proven most effective<br />
for basal bark spraying, foliar spraying<br />
and cut stump applications, while<br />
glyphosate caused the highest mortality<br />
using stem injection. Stem injection,<br />
cut stump and basal bark spraying can<br />
be applied at any time <strong>of</strong> the year with<br />
no variation in final results. However,<br />
plants that are treated when they are not<br />
actively growing tend to send out stem<br />
suckers in the first season. While they<br />
eventually succumb to the treatment<br />
in the next season, they take longer to<br />
die. Further work is required to finetune<br />
the methodology and rates used in the<br />
splatter gun trial.<br />
Stem injection trials<br />
Calotrope<br />
Herbicides, application rates and efficacy<br />
in the rate screening trial conducted near<br />
Georgetown (along the Gilbert River) are<br />
summarised in Table 6.2. Compared with<br />
the initial screening trial (reported in<br />
<strong>Technical</strong> <strong>highlights</strong> 2009–10), mortality<br />
in all treatments was low. The fact that<br />
plants at the Georgetown site had almost<br />
twice the cross-sectional area as plants<br />
at Greenvale may have contributed to<br />
these results.<br />
14 <strong>Technical</strong> <strong>highlights</strong>: research projects 2010–11
Table 6.1 Mortality <strong>of</strong> Captain Cook tree using various treatments and active ingredients in the rate screening trials<br />
Treatment a Active ingredient Rate and carrier Mortality (%) b<br />
Basal bark fluroxypyr (333 g L –1 ) 1:112 diesel 85*<br />
Basal bark c fluroxypyr (333 g L –1 ) 1:112 diesel 98†<br />
Basal bark control 1 diesel 0‡<br />
Basal bark c control 1 diesel 0‡<br />
Cut stump fluroxypyr (333 g L –1 ) 1:112 water + wetter 100†<br />
Cut stump fluroxypyr (333 g L –1 ) 1:55 water + wetter 100†<br />
Cut stump fluroxypyr (333 g L –1 ) 1:55 diesel 100†<br />
Cut stump control diesel 21*<br />
Cut stump control water + wetter 12*<br />
Foliar fluroxypyr (333 g L –1 ) 1:334 water + wetter 77†<br />
Foliar fluroxypyr (333 g L –1 ) 1:167 water + wetter 92†<br />
Foliar aminopyralid (10 g L –1 ) fluroxypyr (140 g L –1 ) 1:140 water + wetter 72†<br />
Foliar<br />
triclopyr (300 g L –1 ) + picloram (100 g L –1 ) +<br />
aminopyralid (8 g L –1 )<br />
1:300 water + wetter<br />
Foliar control water + wetter 5*<br />
Stem injection glyphosate (360 g L –1 ) 1:0 water 97†<br />
Stem injection glyphosate (360 g L -1 ) 1:0 97†<br />
Stem injection triclopyr (200 g L –1 ) + picloram (100 g L –1 ) 1:4 water + wetter 90†<br />
Stem injection triclopyr (200 g L –1 ) + picloram (100 g L –1 ) 1:4 water 96†<br />
Stem injection control water + wetter 0*<br />
Stem injection control water 0*<br />
Splatter gun fluroxypyr (333 g L –1 ) 1:9 water + wetter 91†<br />
Splatter gun aminopyralid (10 g L –1 ) fluroxypyr (140 g L –1 ) 1:3 water + wetter 93†<br />
Splatter gun glyphosate (360 g L –1 ) 1:9 water + wetter 61*<br />
Splatter gun control water + wetter 0‡<br />
a Stem injection treatments refer to the second rate screening trial; splatter gun treatments refer to the initial screening trial.<br />
b Mortality values followed by the same symbol are not significantly different, p < 0.05.<br />
c Double application height (1 m above ground) was used.<br />
Table 6.2 Mortality <strong>of</strong> calotrope in the stem injection rate screening trial<br />
Active ingredient Rate and carrier Mortality (%) a<br />
triclopyr (200 g L –1 ) + picloram (100 g L –1 ) 1:4 water + wetter 20*<br />
2,4-D (300 g L –1 )+ picloram (75 g L –1 ) 1:3 water + wetter 9*<br />
2,4-D (625 g L –1 ) 1:7 water + wetter 10*<br />
glyphosate (360 g L –1 ) 1:0 water + wetter 24*<br />
glyphosate (360 g L –1 ) 1:1 water + wetter 13*<br />
imazapyr (150 g L –1 ) + glyphosate (150 g L –1 ) 1:4 water + wetter 72†<br />
control water + wetter 0‡<br />
a Mortality values followed by the same symbol are not significantly different, p < 0.05.<br />
Part 1 Integrated weed management 15<br />
11*
Prickly acacia<br />
Herbicides, application rates and efficacy<br />
18 months after treatment in the rate<br />
screening trial are summarised in<br />
Table 6.3. Compared with the initial<br />
screening trial (reported in <strong>Technical</strong><br />
<strong>highlights</strong> 2009–10), mortality in all<br />
treatments was low. The presence <strong>of</strong> seed<br />
pods on test plants or particular choices<br />
in the way treatments were applied<br />
may have influenced overall efficacy.<br />
We have now established a second rate<br />
screening trial, using the same rates but<br />
different cut spacing (label-recommended<br />
and 7 cm) and adding a wetter to all<br />
treatments. Plants in this trial also do not<br />
have developing pods.<br />
Chinee apple<br />
Herbicides, application rates and efficacy<br />
two years after treatment in the initial<br />
screening trial are summarised in Table 6.4.<br />
Mortality in all treatments was low, with a<br />
maximum <strong>of</strong> only 16% recorded.<br />
Bellyache bush splatter gun trial<br />
Herbicides, application rates and efficacy<br />
two years after treatment in the initial<br />
screening trial are summarised in Table 6.5.<br />
Metsulfuron-methyl has proven highly<br />
effective and we will now undertake<br />
additional work to refine application rates.<br />
Funding in 2010–11<br />
• Land Protection Fund ($76 000)<br />
• Queensland Government<br />
More information<br />
Key publications<br />
Brazier, D, McKenzie, J, Owen, A,<br />
Campbell, SD, Vitelli, JS, Reid, A &<br />
Mayer, R 2010, ‘Evaluating herbicides for<br />
the control <strong>of</strong> the invasive weed florestina<br />
(Florestina tripteris DC.)’, in SM Zydenbos<br />
(ed.), Proceedings <strong>of</strong> the 17th Australasian<br />
Weeds Conference, New Zealand Plant<br />
Protection Society, Christchurch, New<br />
Zealand, pp. 421–3.<br />
McKenzie, J, Brazier, D, Owen, A,<br />
Vitelli, JS & Mayer, R 2010, ‘Stem<br />
injection: a control technique <strong>of</strong>ten<br />
overlooked for exotic woody weeds’, in<br />
SM Zydenbos (ed.), Proceedings <strong>of</strong> the<br />
17th Australasian Weeds Conference,<br />
New Zealand Plant Protection Society,<br />
Christchurch, New Zealand, pp. 459–61.<br />
Table 6.3 Mortality <strong>of</strong> prickly acacia in the stem injection rate screening trial<br />
Active ingredient Rate and carrier<br />
triclopyr (200 g L –1 ) + picloram<br />
(100 g L –1 )<br />
Mortality (%)<br />
18 months after<br />
treatment a<br />
1:4 water 22†<br />
2,4-D (300 g L –1 )+ picloram (75 g L –1 ) 1:1.5 water 9†<br />
glyphosate (360 g L –1 ) 1:0.5 water 0*<br />
control water 0*<br />
a Mortality values followed by the same symbol are not significantly different, p < 0.05.<br />
Table 6.4 Mortality <strong>of</strong> chinee apple in the stem injection screening trial<br />
Active ingredient Rate and carrier<br />
triclopyr (200 g L –1 ) + picloram<br />
(100 g L –1 )<br />
Mortality (%)<br />
24 months after<br />
treatment a<br />
1:4 water + wetter 16†<br />
2,4-D (300 g L –1 ) + picloram (75 g L –1 ) 1:1.5 water + wetter 14†<br />
2,4-D (625 g L –1 ) 1:6 water + wetter 0*<br />
imazapyr (150 g L –1 ) + glyphosate<br />
(150 g L –1 )<br />
1:4 water + wetter 1*<br />
glyphosate (360 g L –1 ) 1:2 water + wetter 0*<br />
hexazinone (250 g L –1 ) 1:2 water + wetter 0*<br />
control water + wetter 0*<br />
a Mortality values followed by the same symbol are not significantly different, p < 0.05.<br />
Table 6.5 Mortality <strong>of</strong> bellyache bush in the splatter gun screening trial<br />
Active ingredient Rate and carrier Mortality (%) a<br />
fluroxypyr (333 g L –1 ) 1:17 water + wetter 48*<br />
glyphosate (360 g L –1 ) 1:9 water + wetter 54*<br />
metsulfuron-methyl (600 g kg –1 ) 2 g L –1 water + wetter 99†<br />
control water + wetter 0‡<br />
a Mortality values followed by the same symbol are not significantly different, p < 0.05.<br />
For further information on this research project and access to key publications,<br />
visit the invasive plant and animal science pages on the Biosecurity Queensland website<br />
at www.biosecurity.qld.gov.au<br />
16 <strong>Technical</strong> <strong>highlights</strong>: research projects 2010–11
7. Evaluating the effectiveness <strong>of</strong> the EZ‑Ject herbicide lance<br />
Project dates<br />
December 2007 – December 2010<br />
(completed)<br />
Project leader<br />
Joseph Vitelli<br />
Ecosciences Precinct<br />
Tel: (07) 3255 4473<br />
Email: joseph.vitelli@deedi.qld.gov.au<br />
Other staff in 2010–11<br />
Barbara Madigan<br />
Objective<br />
Evaluate the effectiveness <strong>of</strong> the EZ-Ject TM<br />
herbicide lance in controlling woody weeds<br />
in Queensland using both glyphosate-filled<br />
and imazapyr-filled shells.<br />
Rationale<br />
Using the EZ-Ject herbicide lance is a<br />
relatively new technique for the control<br />
<strong>of</strong> woody plants by stem injection. The<br />
stainless steel lance has gripping teeth<br />
at the end and a spring-loaded assembly<br />
that injects .22 brass shells filled with<br />
water-soluble herbicide into the cambium<br />
layer <strong>of</strong> woody plants. No mixing <strong>of</strong>, or<br />
contact with, the herbicide is required<br />
by the operator. The longer version <strong>of</strong><br />
the lance (1.5 m) holds up to 100 shells<br />
in each <strong>of</strong> four separate shell chambers.<br />
The shells are implanted at a downward<br />
angle evenly around the circumference<br />
<strong>of</strong> the base <strong>of</strong> the plant. Two herbicides<br />
(glyphosate and imazapyr) are registered<br />
for use with the lance in the United<br />
States and Canada. Plants may be<br />
injected at any time <strong>of</strong> the year and may<br />
be standing in water or wetlands, though<br />
the injection site should be above the<br />
water level.<br />
To trial this control method, three<br />
woody weeds were chosen, each from<br />
a different family and each infesting a<br />
different area <strong>of</strong> Queensland. Captain<br />
Cook tree (Cascabela thevetia), family<br />
Apocynaceae, is a Class 3 weed that<br />
is highly toxic and invades native<br />
vegetation. Velvety tree pear (Opuntia<br />
tomentosa), family Cactaceae, is a<br />
Class 2 weed found predominantly in the<br />
brigalow belt <strong>of</strong> Queensland. Pond apple<br />
(Annona glabra), family Annonaceae, is<br />
a Weed <strong>of</strong> National Significance (WONS)<br />
and a Class 2 weed. It can grow in<br />
flooded areas <strong>of</strong> fresh, brackish or salt<br />
water, forming dense thickets capable <strong>of</strong><br />
replacing existing ecosystems.<br />
If effective and subsequently registered<br />
for use in Queensland, this tool would<br />
help the operator avoid direct contact<br />
with both the herbicide and any thorns<br />
or spines on the plant. The technique<br />
would be particularly useful in wetlands<br />
and other sensitive environments,<br />
allowing treatment <strong>of</strong> individual plants<br />
without affecting surrounding native<br />
vegetation or contaminating waterways.<br />
Methods<br />
Captain Cook tree near Mingela, velvety<br />
tree pear near Inglewood and pond<br />
apple near Babinda are treated with<br />
the EZ-Ject herbicide lance in split-plot<br />
design experiments with the herbicide as<br />
the main plot (glyphosate and imazapyr)<br />
and the number <strong>of</strong> cartridges as the subplot<br />
(0, 1, 2, 3 and 4 shells). We replicate<br />
each treatment four times and the<br />
experimental unit consists <strong>of</strong> 15 plants.<br />
All treated plants have a basal diameter<br />
<strong>of</strong> 10–15 cm. We assess plants 1, 6<br />
and 12 months after treatment using a<br />
damage-rating scale and determine plant<br />
mortality at the final assessment.<br />
Findings<br />
This study established that the EZ-Ject<br />
herbicide system is an effective tool for<br />
controlling individual woody plants,<br />
although the degree <strong>of</strong> control varied<br />
among species, with efficacy influenced<br />
by herbicide and number <strong>of</strong> cartridges<br />
injected.<br />
Cartridges filled with imazapyr were<br />
significantly more effective than those<br />
filled with glyphosate at controlling<br />
the three woody weed species. Injecting<br />
plants with three imazapyr cartridges<br />
resulted in mortalities <strong>of</strong> 93–100%,<br />
compared to mortalities <strong>of</strong> 17–100% for<br />
glyphosate cartridges. Pond apple was<br />
the most susceptible species, requiring<br />
one imazapyr cartridge to kill 97% or<br />
two glyphosate cartridges to kill 92% <strong>of</strong><br />
treated plants. Plant mortality increased<br />
as the number <strong>of</strong> cartridges injected<br />
increased. However, mortality did<br />
not differ significantly for treatments<br />
receiving three and four imazapyr<br />
cartridges, as the lower cartridge<br />
density already met the manufacturer’s<br />
recommendation <strong>of</strong> injecting one<br />
cartridge per 10 cm basal circumference<br />
when treating large plants (> 6.35 cm<br />
diameter at breast height).<br />
Photo 7.1 Bullets <strong>of</strong> water-soluble herbicide injected into the base <strong>of</strong> woody weeds<br />
Part 1 Integrated weed management 17
The cost <strong>of</strong> using three cartridges<br />
per tree to treat a weed infestation <strong>of</strong><br />
1500 plants ha –1 is $1070 ha –1 , with<br />
labour costs accounting for 16% <strong>of</strong> this.<br />
The high chemical costs would preclude<br />
this technique from broad-scale use, but<br />
it could be valuable for treating woody<br />
weeds in sensitive areas, including those<br />
with high conservation values.<br />
Agribusiness will be canvassed to<br />
identify businesses interested in<br />
importing and distributing the herbicide<br />
lance and capsules. Once an importer<br />
has been identified, a consent-to-import<br />
permit will be sought from the Australian<br />
Pesticides and Veterinary Medicines<br />
Authority (APVMA) so that land<br />
managers can purchase the equipment.<br />
Funding in 2010–11<br />
Queensland Government<br />
More information<br />
Key publication<br />
Vitelli, JS & Madigan, BA 2011,<br />
‘Evaluating the efficacy <strong>of</strong> the EZ-Ject<br />
herbicide system in Queensland,<br />
Australia’, The Rangeland Journal 33(3):<br />
299–305.<br />
18 <strong>Technical</strong> <strong>highlights</strong>: research projects 2010–11
8. Biological control <strong>of</strong> bellyache bush (Jatropha gossypiifolia)<br />
Project dates<br />
July 2007 – June 2012<br />
Project leader<br />
Dr K. Dhileepan<br />
Ecosciences Precinct<br />
Tel: (07) 3255 4449<br />
Email: k.dhileepan@deedi.qld.gov.au<br />
Other staff in 2010–11<br />
Mariano Treviño<br />
Objectives<br />
• Identify suitable biological control<br />
agents for host-specificity testing<br />
through review <strong>of</strong> earlier survey work<br />
and exploration (in collaboration with<br />
the CSIRO).<br />
• Conduct pathogenicity and host<br />
range testing <strong>of</strong> the Jatropha rust<br />
fungus (Phakopsora jatrophicola)<br />
as a potential biocontrol agent for<br />
bellyache bush.<br />
Rationale<br />
Bellyache bush (Jatropha gossypiifolia)<br />
is a serious and expanding weed<br />
<strong>of</strong> northern Queensland. It invades<br />
rangeland, particularly in riparian<br />
zones, and forms dense thickets that<br />
reduce productivity and biodiversity.<br />
All parts <strong>of</strong> the plant, especially the<br />
seeds, are toxic to grazing animals.<br />
Bellyache bush is a declared target<br />
for biological control and an effective<br />
biocontrol agent is needed to halt further<br />
spread and reduce its impact. The<br />
only biological control agent released<br />
to date, the bellyache bush jewel bug<br />
(Agonosoma trilineatum), is not known<br />
to be established in the field. Hence,<br />
the bellyache bush biological control<br />
program was recommenced in 2007 to<br />
further screen potential agents identified<br />
during earlier surveys in Central<br />
America and to conduct additional<br />
surveys in South America.<br />
Methods<br />
Staff from the CSIRO Mexican Field<br />
Station and CABI Europe – United<br />
Kingdom (CABI Europe–UK), through<br />
other collaborative links, collect fresh<br />
spore material <strong>of</strong> Phakopsora jatrophicola<br />
ex J. gossypiifolia from different<br />
geographic regions and send them to<br />
facilities at Egham, United Kingdom.<br />
In order to quantify the degree<br />
<strong>of</strong> susceptibility <strong>of</strong> individual<br />
J. gossypiifolia varieties towards<br />
particular P. jatrophicola strains, we<br />
inoculate rust strains from Brazil,<br />
Trinidad and the Pacific coast <strong>of</strong> Mexico<br />
on the three varieties Queensland<br />
Bronze, Queensland Green and<br />
Queensland Purple. The rust strain most<br />
virulent towards all Queensland varieties<br />
<strong>of</strong> J. gossypiifolia is then selected for full<br />
host-specificity tests conducted under<br />
quarantine by our collaborators at CABI<br />
Europe–UK.<br />
Virulence (pustules plant –1 )<br />
-<br />
250<br />
200<br />
150<br />
100<br />
Virulence<br />
50<br />
(pustules plant<br />
0<br />
Progress in 2010–11<br />
All three Queensland bellyache bush<br />
varieties were susceptible to all three<br />
rust strains, but the strain from Trinidad<br />
showed consistently high virulence on<br />
all three Queensland bellyache bush<br />
varieties (Figure 8.1). The strains from<br />
Brazil and Trinidad were also less virulent<br />
than the previously assessed rust strain<br />
from El Zapote, Mexico, towards the<br />
non-target plant J. curcas. Because <strong>of</strong> its<br />
comparatively high virulence towards all<br />
Queensland varieties <strong>of</strong> J. gossypiifolia<br />
and its low virulence towards J. curcas,<br />
the strain from Trinidad was selected for<br />
host-specificity testing.<br />
Full host-specificity testing <strong>of</strong> the rust<br />
strain from Trinidad has commenced.<br />
In March 2011, we exported a shipment<br />
<strong>of</strong> 13 test plant species (10 plants each) to<br />
CABI Europe–UK. The evaluation status<br />
and test results <strong>of</strong> the 13 non-target<br />
species are summarised in Table 8.1.<br />
The rust caused restricted sporulation on<br />
J. multifida as well as on one individual<br />
plant <strong>of</strong> J. integerrima with hirsute<br />
leaves. Other individuals <strong>of</strong> J. integerrima<br />
exhibiting non-hirsute, waxy leaves<br />
proved to be less susceptible. J. podagrica<br />
showed chlorotic and necrotic leaf spots,<br />
but no sporulation, following inoculation.<br />
No macroscopic symptoms or sporulation<br />
were evident on other test plant species.<br />
Pacific strain Trinidad strain El Zapote strain standard error<br />
Queensland Bronze Queensland Green Queensland Purple<br />
Bellyache bush variety<br />
Figure 8.1 Virulence <strong>of</strong> three strains <strong>of</strong> P. jatrophicola towards the three Queensland bellyache<br />
bush varieties<br />
Part 1 Integrated weed management 19
Table 8.1 Response <strong>of</strong> 13 non-target test plant species to inoculation with the P. jatrophicola strain from Trinidad<br />
Family Test plant species No‑choice host‑specificity test results<br />
Euphorbiaceae Jatropha integerrima Restricted sporulation in a plant with hirsute leaves and not on plants<br />
with normal leaves<br />
Jatropha multifida Restricted sporulation<br />
Jatropha podagrica Chlorotic and necrotic leaf spots; no sporulation<br />
Aleurites moluccana Necrotic leaf spots; no sporulation<br />
Manihot esculenta Some chlorotic leaf spots (not associated with the rust); no sporulation<br />
Euphorbia pulcherrima Occasionally protuberances (not associated with the rust); no sporulation<br />
Alchornea ilicifolia No macroscopic symptoms<br />
Macaranga tanarius No macroscopic symptoms<br />
Phyllanthaceae Cleistanthus dallachyanus Under evaluation<br />
Breynia oblongifolia Small pinhole-like necrotic leaf spotting; no sporulation<br />
Antidesma parvifolium Under evaluation<br />
Picrodendraceae Petalostigma pubescens Under evaluation<br />
Putranjivaceae Drypetes deplanchei Under evaluation<br />
Funding in 2010–11<br />
• Land Protection Fund ($47 000)<br />
• MLA ($30 000)<br />
• Queensland Government (Blueprint<br />
for the Bush)<br />
Collaborators<br />
• Marion Seier (CABI Europe–UK,<br />
United Kingdom)<br />
• Tim Heard (CSIRO Ecosystem<br />
Sciences, Brisbane)<br />
• Ricardo Segura (CSIRO Ecosystem<br />
Sciences, Mexican Field Station)<br />
• Tanya Scharaschkin (Queensland<br />
University <strong>of</strong> Technology, Science and<br />
Engineering Faculty)<br />
More information<br />
Key publications<br />
Heard, TA, Chan, RR, Senaratne, KADW,<br />
Palmer, WA, Lockett, CJ & Lukitsch, B<br />
2009, ‘Agonosoma trilineatum<br />
(Heteroptera: Scutelleridae) a<br />
biological control agent <strong>of</strong> the weed<br />
bellyache bush, Jatropha gossypiifolia<br />
(Euphorbiaceae)’, Biological Control<br />
48(2): 196–203.<br />
Bebawi, FF, Lockett, CJ, Davis, KM &<br />
Lukitsch, BV 2007, ‘Damage potential <strong>of</strong><br />
an introduced biological control agent<br />
Agonosoma trilineatum (F.) on bellyache<br />
bush (Jatropha gossypiifolia L.)’,<br />
Biological Control 41(3): 415–22.<br />
Bebawi, FF, Vitelli, JS, Campbell, SD,<br />
Vogler, WD, Lockett, CJ, Grace, BS,<br />
Lukitsch, B & Heard, TA 2007, ‘The<br />
biology <strong>of</strong> Australian weeds 47. Jatropha<br />
gossypiifolia L.’, Plant Protection<br />
Quarterly 22(2): 42–58.<br />
For further information on this research<br />
project and access to key publications,<br />
visit the invasive plant and animal science<br />
pages on the Biosecurity Queensland<br />
website at www.biosecurity.qld.gov.au<br />
20 <strong>Technical</strong> <strong>highlights</strong>: research projects 2010–11
9. Biological control <strong>of</strong> parthenium (Parthenium hysterophorus)<br />
Project dates<br />
May 2007 – June 2014<br />
Project leader<br />
Dr K. Dhileepan<br />
Ecosciences Precinct<br />
Tel: (07) 3255 4449<br />
Email: k.dhileepan@deedi.qld.gov.au<br />
Other staff in 2010–11<br />
Mariano Treviño and Kelli Pukallus<br />
Asad Shabbir and Ruey Toh (The<br />
University <strong>of</strong> Queensland PhD students)<br />
Objectives<br />
• Monitor the field persistence and<br />
abundance <strong>of</strong> parthenium biological<br />
control agents.<br />
• Evaluate the role <strong>of</strong> beneficial<br />
competitive plants to enhance the<br />
effectiveness <strong>of</strong> weed biological<br />
control agents.<br />
Rationale<br />
Parthenium (Parthenium hysterophorus)<br />
is a WONS and a Class 2 declared weed<br />
in Queensland. Biological control is one<br />
<strong>of</strong> the most effective and economically<br />
viable management options for this<br />
weed. Among the various biological<br />
control agents introduced against<br />
parthenium in Queensland, the summer<br />
rust (Puccinia xanthii var. partheniihysterophorae,<br />
previously reported<br />
as P. melampodii) is an agent suited<br />
to areas with hot and dry weather<br />
conditions. It was introduced from<br />
Mexico in 1999 and released at more<br />
than 50 infested sites in Queensland.<br />
The clear-wing moth (Carmenta ithacae),<br />
also native to Mexico, was released<br />
from 1998 to 2002. The stem-galling<br />
weevil (Conotrachelus albocinereus) from<br />
Argentina was released in Queensland<br />
from 1995 to 2000. Although all three<br />
agents have established in the field, their<br />
incidence and abundance in parthenium<br />
infestations in central and northern<br />
Queensland is not fully known.<br />
The role <strong>of</strong> competition from beneficial<br />
plants in managing parthenium is widely<br />
known. So far, however, no information<br />
is available on the potential role <strong>of</strong><br />
various native and introduced pasture<br />
plants in enhancing the effectiveness<br />
<strong>of</strong> parthenium biological control agents<br />
in Australia. Identification <strong>of</strong> beneficial<br />
plants exhibiting high competitive<br />
indices, in particular under changing<br />
climate—specifically elevated carbon<br />
dioxide (CO 2 )—would help to manage<br />
parthenium more effectively.<br />
Methods<br />
Biological control agent<br />
monitoring<br />
Parthenium sites in central and northern<br />
Queensland are monitored at the end<br />
<strong>of</strong> the parthenium growing season. At<br />
each site, we record the incidence and<br />
abundance <strong>of</strong> various biological control<br />
agents—the summer rust (P. xanthii var.<br />
parthenii-hysterophorae), the clearwing<br />
moth (C. ithacae) and the stemgalling<br />
weevil (C. albocinereus)—along<br />
with information on other established<br />
biological control agents and the<br />
abundance <strong>of</strong> parthenium.<br />
Biological control and competitive<br />
plants under elevated CO2 We conduct an experiment in controlledenvironment<br />
rooms to quantify the<br />
combined effect <strong>of</strong> a stem-galling<br />
biological control agent (Epiblema<br />
strenuana) and plant suppression<br />
by buffel grass (Cenchrus ciliaris)<br />
on parthenium’s vegetative and<br />
reproductive growth under ambient CO2<br />
levels <strong>of</strong> 380 parts per million by volume<br />
(ppmv) and under elevated CO2 levels<br />
(550 ppmv).<br />
Parthenium canopy architecture<br />
Parthenium canopy architecture is studied<br />
under three temperature (day/night<br />
22/15 °C, 27/20 °C, and 32/25 °C in thermal<br />
time 12/12 hours) and two CO2 (ambient<br />
and elevated) regimes in controlledenvironment<br />
rooms. Identical light<br />
(photoperiod 12 hours, ~ 250 μmol s –1 ) and<br />
relative humidity (65%) are maintained<br />
in all rooms. We track plant development<br />
from the ninth day after transplantation<br />
using three-dimensional digitising<br />
every third day with a sonic digitiser.<br />
The last measurement is made after<br />
about 550 growing degree days. From<br />
empirical data, we develop a virtual threedimensional<br />
canopy architecture model <strong>of</strong><br />
a parthenium plant using the modelling<br />
s<strong>of</strong>tware L-systems.<br />
Progress in 2010–11<br />
In central Queensland, we surveyed<br />
17 sites in March 2011. Surveys at three<br />
sites in northern Queensland were<br />
conducted in April 2011.<br />
Parthenium summer rust<br />
The summer rust was evident at all<br />
sites with parthenium infestations. The<br />
proportion <strong>of</strong> infected plants was high<br />
at all three sites in northern Queensland<br />
(Cardigan Station, Felspar and Plain<br />
Creek), but the proportion <strong>of</strong> leaves with<br />
rust infection remained low at all these<br />
sites (Figure 9.1). In central Queensland,<br />
parthenium was evident in only 7 <strong>of</strong><br />
the 17 sampling sites, but the summer<br />
rust was observed at all sites with<br />
parthenium infestations. The proportion<br />
<strong>of</strong> plants and leaves infected varied<br />
widely between sites (Figure 9.1).<br />
Parthenium clear-wing moth<br />
We have previously confirmed field<br />
establishment <strong>of</strong> the clear-wing moth at<br />
5 <strong>of</strong> the 13 release sites and 2 nearby nonrelease<br />
sites in central Queensland. In<br />
2011 the clear-wing moth was recovered<br />
from a non-release site near Carfax,<br />
confirming its continued persistence in<br />
the field. High summer rainfall resulting<br />
in flooding could have affected the rootboring<br />
larvae at many sites.<br />
Parthenium stem-galling weevil<br />
The stem-galling weevil was not<br />
recovered in any <strong>of</strong> the survey sites.<br />
Limited establishment <strong>of</strong> this agent<br />
could be due to the dominance <strong>of</strong> the<br />
stem-galling moth (E. strenuana) in all<br />
parthenium-infested areas. The stemgalling<br />
moth and the stem-galling<br />
weevil share a similar feeding niche.<br />
Part 1 Integrated weed management 21
Summer rust incidence (%)<br />
100<br />
90<br />
80<br />
70<br />
60<br />
50<br />
40<br />
30<br />
20<br />
10<br />
0<br />
Felspar<br />
Cardigan<br />
Plain Creek<br />
Northern Queensland<br />
Landsborough<br />
Nil parthenium<br />
Kemmis Creek<br />
proportion <strong>of</strong> plants infected<br />
proportion <strong>of</strong> leaves infected<br />
standard error<br />
Nil parthenium<br />
Carfax<br />
Nil parthenium<br />
Overflow<br />
Nil parthenium<br />
Morbridge<br />
Clermont<br />
Nil parthenium<br />
Oaky Creek<br />
Nil parthenium<br />
Hillside<br />
Monitoring site<br />
Figure 9.1 Incidence <strong>of</strong> P. xanthii var. parthenii-hysterophorae in Queensland<br />
Biological control and competitive<br />
plants under elevated CO2 The experiment was carried out from<br />
May to July 2011. With biological<br />
control (E. strenuana), parthenium grew<br />
much more vigorously and produced<br />
significantly more biomass and more<br />
flowers under elevated CO2 than under<br />
ambient CO2. In contrast, buffel grass<br />
became less competitive and produced<br />
fewer tillers and less biomass under<br />
elevated CO2 than under ambient CO2<br />
(Photo 9.1). This suggests that under<br />
climate change, biological control with<br />
E. strenuana and competition from<br />
buffel grass may not be effective.<br />
Parthenium canopy architecture<br />
A virtual three-dimensional canopy<br />
architecture model <strong>of</strong> a parthenium<br />
plant was developed. Both temperature<br />
and CO 2 regimes significantly affected<br />
parthenium canopy size and structure.<br />
We currently use the virtual plant model<br />
to study the implications <strong>of</strong> changes in<br />
the parthenium canopy due to climate<br />
change on parthenium summer rust<br />
infection levels.<br />
22 <strong>Technical</strong> <strong>highlights</strong>: research projects 2010–11<br />
Nil parthenium<br />
Emerald<br />
Wycarbah<br />
Central Queensland<br />
Photo 9.1 Impact <strong>of</strong> plant competition and biological control on parthenium growing under<br />
ambient (380 ppmv) and elevated (550 ppmv) CO 2 levels<br />
Nil parthenium<br />
Mount Hay<br />
Gracemere<br />
Nil parthenium<br />
Springsure<br />
Nil parthenium<br />
Albinia National Park<br />
Delargum<br />
Moleyamber Creek<br />
Hutton Creek
Funding in 2010–11<br />
• Queensland Government<br />
• AusAID ($8000)<br />
Collaborators<br />
Pr<strong>of</strong>. Steve Adkins (School <strong>of</strong> Land, Crop<br />
and Food Sciences, The University <strong>of</strong><br />
Queensland)<br />
More information<br />
Key publications<br />
Dhileepan, K & Strathie, L 2009,<br />
‘Parthenium hysterophorus L.<br />
(Asteraceae)’, in R Muniappan,<br />
GVP Reddy & A Raman (eds), Biological<br />
control <strong>of</strong> tropical weeds using<br />
arthropods, Cambridge University Press,<br />
Cambridge, pp. 272–316.<br />
Dhileepan, K 2007, ‘Biological control <strong>of</strong><br />
parthenium (Parthenium hysterophorus)<br />
in Australian rangeland translates<br />
to improved grass production’, Weed<br />
Science 55(5): 497–501.<br />
Dhileepan, K 2004, ‘The applicability <strong>of</strong><br />
the plant vigor and resource regulation<br />
hypotheses in explaining Epiblema gall<br />
moth – Parthenium weed interactions’,<br />
Entomologia Experimentalis et Applicata<br />
113(1): 63–70.<br />
Dhileepan, K 2003, ‘Current status <strong>of</strong><br />
the stem-boring weevil Listronotus<br />
setosipennis (Coleoptera: Curculionidae)<br />
introduced against the weed Parthenium<br />
hysterophorus (Asteraceae) in Australia’,<br />
Biocontrol Science and Technology<br />
13(1): 3–12.<br />
Dhileepan, K 2003, ‘Seasonal variation<br />
in the effectiveness <strong>of</strong> the leaffeeding<br />
beetle Zygogramma bicolorata<br />
(Coleoptera: Chrysomelidae) and<br />
stem-galling moth Epiblema strenuana<br />
(Lepidoptera: Tortricidae) as biocontrol<br />
agents on the weed Parthenium<br />
hysterophorus (Asteraceae)’, Bulletin <strong>of</strong><br />
Entomological Research 93(5): 393–401.<br />
Dhileepan, K 2001, ‘Effectiveness<br />
<strong>of</strong> introduced biocontrol insects on<br />
the weed Parthenium hysterophorus<br />
(Asteraceae) in Australia’, Bulletin <strong>of</strong><br />
Entomological Research 91(3): 167–176.<br />
Dhileepan, K & McFadyen, RE 2001,<br />
‘Effects <strong>of</strong> gall damage by the introduced<br />
biocontrol agent Epiblema strenuana<br />
(Lep., Tortricidae) on the weed Parthenium<br />
hysterophorus (Asteraceae)’, Journal <strong>of</strong><br />
Applied Entomology 125(1–2): 1–8.<br />
Dhileepan, K, Setter, SD & McFadyen, RE<br />
2000, ‘Impact <strong>of</strong> defoliation by the<br />
biocontrol agent Zygogramma bicolorata<br />
on the weed Parthenium hysterophorus<br />
in Australia’, BioControl 45(4): 501–12.<br />
Dhileepan, K, Setter, SD & McFadyen, RE<br />
2000, ‘Response <strong>of</strong> the weed Parthenium<br />
hysterophorus (Asteraceae) to defoliation<br />
by the introduced biocontrol agent<br />
Zygogramma bicolorata (Coleoptera:<br />
Chrysomelidae)’, Biological Control<br />
19(1): 9–16.<br />
For further information on this research<br />
project and access to key publications,<br />
visit the invasive plant and animal science<br />
pages on the Biosecurity Queensland<br />
website at www.biosecurity.qld.gov.au<br />
Part 1 Integrated weed management 23
10. Biological control <strong>of</strong> prickly acacia (Acacia nilotica ssp. indica)<br />
Project dates<br />
January 2007 – June 2014<br />
Project leader<br />
Dr K. Dhileepan<br />
Ecosciences Precinct<br />
Tel: (07) 3255 4449<br />
Email: k.dhileepan@deedi.qld.gov.au<br />
Other staff in 2010–11<br />
Catherine Lockett, Di Taylor and<br />
Mariano Treviño<br />
A. Balu, M. Senthilkumar, S. Murugesan<br />
and P. Senthilkumar (Institute <strong>of</strong> Forest<br />
Genetics and Tree Breeding, Coimbatore,<br />
India)<br />
Syed Irfan Ahmed, Sangeetha Singh,<br />
Mahadeo Gorain and Anamika Sharma<br />
(Arid Forest Research Institute, Jodhpur,<br />
India)<br />
Objectives<br />
• Survey and assess the host range <strong>of</strong><br />
insects and pathogens associated with<br />
prickly acacia in the native range<br />
(India).<br />
• Conduct host-specificity tests on<br />
prioritised biological control agents<br />
for prickly acacia.<br />
Rationale<br />
Prickly acacia (Acacia nilotica ssp.<br />
indica) is a WONS and a Class 2 declared<br />
weed in Queensland. The plant is<br />
widespread throughout the grazing<br />
areas <strong>of</strong> north-western Queensland,<br />
where it costs primary producers<br />
$9 million per year by decreasing<br />
pasture production and hindering the<br />
mustering <strong>of</strong> livestock. Biological control<br />
research has been in progress since the<br />
1980s, but with limited success to date.<br />
Improved climatic modelling and genetic<br />
studies have suggested that the search<br />
for biological control agents should be<br />
concentrated in India, the native range<br />
source <strong>of</strong> the prickly acacia populations<br />
in Australia. The occurrence <strong>of</strong> several<br />
native A. nilotica subspecies as well<br />
as other native and non-native Acacia<br />
species (including species native to<br />
Australia) <strong>highlights</strong> the advantage <strong>of</strong><br />
conducting surveys in India, where the<br />
field host-specificity <strong>of</strong> potential agents<br />
could be determined.<br />
Methods<br />
Native range surveys<br />
Our collaborators in India—the Arid<br />
Forest Research Institute and the<br />
Institute <strong>of</strong> Forest Genetics and Tree<br />
Breeding—conduct surveys in natural<br />
groves and plantations in Rajasthan,<br />
Gujarat, Tamil Nadu and Karnataka<br />
states at regular intervals (four to six<br />
times a year, covering all seasons) to<br />
catalogue insect herbivores and plant<br />
pathogens associated with various<br />
subspecies <strong>of</strong> A. nilotica in India.<br />
Exclusion studies<br />
The impact <strong>of</strong> native insect herbivores<br />
on seedling survival and growth under<br />
field conditions is evaluated in exclusion<br />
trials conducted over a two-year<br />
period at four sites each in Rajasthan<br />
(Hanumangarh, Desuri, Bharatpur and<br />
Jodhpur) and Gujarat (Gandhinagar,<br />
Nadyad, Junagarh and Bhuj), and two<br />
sites in Tamil Nadu (Coimbatore and<br />
Thoppur). At each site, staff maintain<br />
potted A. nilotica seedlings, with half<br />
<strong>of</strong> the seedlings protected from insect<br />
herbivores (by spraying insecticides at<br />
fortnightly intervals) and the remaining<br />
half exposed to insect herbivores (by<br />
spraying with water). They sample the<br />
potted plants at quarterly intervals and<br />
record the incidence and abundance <strong>of</strong><br />
various insects, along with details <strong>of</strong><br />
several plant parameters (e.g. defoliation<br />
levels, plant height, number <strong>of</strong> leaves,<br />
number <strong>of</strong> branches, basal stem<br />
diameter, above-ground and belowground<br />
biomass). This information<br />
is used for prioritising agents for<br />
more detailed studies, including hostspecificity<br />
tests.<br />
Host-specificity tests<br />
Specialist insect herbivores and plant<br />
pathogens exhibiting host-specificity in<br />
field surveys are tested in no-choice and<br />
choice trials in the glasshouse and field<br />
cages to confirm host-specificity. After<br />
importing prioritised agents into the<br />
quarantine at the Ecosciences Precinct,<br />
we conduct host-specificity testing <strong>of</strong><br />
two agents, the leaf-webbing caterpillar<br />
(Phycita sp.) and the babul scale<br />
(Anomalococcus indicus), involving over<br />
80 species <strong>of</strong> test plants. No-choice hostspecificity<br />
testing <strong>of</strong> the gall-inducing<br />
rust (Ravenelia acaciae-arabicae) is<br />
conducted on 17 species <strong>of</strong> closely<br />
related Australian acacia species in the<br />
quarantine at CABI Europe–UK. The<br />
plants necessary for the testing are sent<br />
from Australia either as potted plants<br />
or seeds.<br />
Progress in 2010–11<br />
Native range surveys<br />
Surveys continued at the predetermined<br />
sites in Tamil Nadu and Karnataka<br />
in southern India and in Gujarat and<br />
Rajasthan in north-western India.<br />
In southern India, the gall-inducing rust<br />
(R. acaciae-arabicae) was observed at<br />
10 <strong>of</strong> the 72 survey sites, all in Tamil<br />
Nadu. Rust uredinia and telia are found<br />
predominantly on the upper surface <strong>of</strong><br />
leaflets, while spermagonia occur on<br />
fruits, inflorescences and shoot tips,<br />
with aecia causing hypertrophy on<br />
fruits, inflorescences and shoot tips,<br />
resulting in galls. Field surveys suggest<br />
that R. acaciae-arabicae is specific to<br />
A. nilotica ssp. indica, as the rust was not<br />
observed on other A. nilotica subspecies<br />
or other Acacia species (e.g. A. ferruginea,<br />
A. latronum, A. auriculiformis, A. catechu,<br />
A. leucophloea and A. farnesiana)<br />
co-occurring with A. nilotica ssp. indica<br />
in India.<br />
In north-western India, a second leaf<br />
rust (R. evansii) was recorded at three<br />
sites in Gujarat.<br />
Exclusion studies<br />
Results from exclusion trials in Gujarat<br />
and Rajastahan were reported in<br />
<strong>Technical</strong> <strong>highlights</strong> 2009–10. Trials in<br />
Tamil Nadu have now also concluded.<br />
At both sites native insect herbivores<br />
reduced plant height, basal stem<br />
diameter, number <strong>of</strong> branches, number<br />
<strong>of</strong> leaflets, leaf biomass, stem biomass<br />
and root biomass (Figures 10.1 and 10.2).<br />
Reductions in plant vigour at both sites<br />
were primarily due to the babul scale<br />
(A. indicus) infesting shoots.<br />
24 <strong>Technical</strong> <strong>highlights</strong>: research projects 2010–11
Plant height (cm)<br />
Number <strong>of</strong> branches<br />
200<br />
160<br />
120<br />
80<br />
40<br />
0<br />
25<br />
20<br />
15<br />
10<br />
5<br />
0<br />
Host-specificity tests<br />
India<br />
herbivore-excluded<br />
herbivore-exposed<br />
standard error<br />
Thoppur Coimbatore<br />
Trial site<br />
herbivore-excluded<br />
herbivore-exposed<br />
standard error<br />
Thoppur Coimbatore<br />
Trial site<br />
In no-choice tests, the semi lopper<br />
(Isturgia disputaria) larvae fed and<br />
completed development on two nontarget<br />
acacias (A. planifrons and<br />
A. leucophloea), but the proportion <strong>of</strong><br />
larvae completing development and<br />
emerging as adults was significantly<br />
less on A. planifrons (30%) and<br />
A. leucophloea (10%) than on A. nilotica<br />
(100%). No larval development occurred<br />
on other test plants (A. mellifera,<br />
A. ferruginea, A. auriculiformis,<br />
A. catechu, A. farnesiana, A. deanei,<br />
A. tortilis and Delonix regia).<br />
Basal stem diameter (mm)<br />
Number <strong>of</strong> leaflets<br />
40<br />
30<br />
20<br />
10<br />
0<br />
1200<br />
1000<br />
800<br />
600<br />
400<br />
200<br />
0<br />
herbivore-excluded<br />
herbivore-exposed<br />
standard error<br />
Thoppur Coimbatore<br />
Trial site<br />
herbivore-excluded<br />
herbivore-exposed<br />
standard error<br />
Thoppur Coimbatore<br />
Trial site<br />
Figure 10.1 Impact <strong>of</strong> insect herbivores on plant height, basal stem diameter, number <strong>of</strong><br />
branches and number <strong>of</strong> leaflets <strong>of</strong> prickly acacia seedlings in Tamil Nadu, India<br />
Biomass (g)<br />
250<br />
200<br />
150<br />
100<br />
50<br />
0<br />
Thoppur Coimbatore Thoppur Coimbatore Thoppur Coimbatore<br />
Leaf Stem Root<br />
Plant parameter and trial site<br />
herbivore-excluded<br />
herbivore-exposed<br />
standard error<br />
Figure 10.2 Impact <strong>of</strong> insect herbivores on biomass <strong>of</strong> prickly acacia seedlings in Tamil Nadu, India<br />
The leaf-webbing caterpillar (Phycita sp.)<br />
fed and completed development under<br />
no-choice conditions on two nontarget<br />
acacias (A. planifrons and<br />
A. leucophloea), but the proportion <strong>of</strong><br />
larvae completing development and<br />
emerging as adults remained much<br />
higher (100%) on the target weed<br />
(A. nilotica) than on A. planifrons (30%)<br />
and A. leucophloea (40%). No larval<br />
feeding or development was evident<br />
on other test plants (A. mellifera,<br />
A. ferruginea, A. auriculiformis,<br />
A. catechu, A. farnesiana, A. deanei,<br />
A. tortilis, Anacardium occidentale and<br />
Mangifera indica).<br />
Babul scale (A. indicus) crawlers (first<br />
instar nymphs) settled and survived on<br />
one non-target plant species (A. tortilis)<br />
in no-choice tests. The rate <strong>of</strong> survival<br />
and development <strong>of</strong> nymphs on the<br />
non-target plant in comparison to<br />
prickly acacia is being studied. No<br />
crawler establishment or nymphal<br />
development occurred on other test<br />
plants (A. planifrons, A. leucophloea,<br />
A. mellifera, A. ferruginea,<br />
A. auriculiformis, A. catechu,<br />
A. farnesiana, A. deanei and Piper<br />
nigrum).<br />
The leaf-feeding weevil (Dereodus<br />
denticollis) fed on A. auriculiformis<br />
leaves under no-choice conditions.<br />
Although adult weevils nibbled on the<br />
leaves <strong>of</strong> other test plants (A. farnesiana<br />
and A. tortilis) initially, no adults<br />
survived beyond three days. No adult<br />
feeding was evident on other test plants<br />
(A. mellifera, A. ferruginea, A. catechu<br />
and A. deanei).<br />
Australia<br />
Approvals to export three prioritised<br />
agents (Phycita sp., A. indicus and<br />
D. denticollis) from India to Australia<br />
were obtained from the National<br />
Biodiversity Authority India and<br />
from the Ministry <strong>of</strong> Environment<br />
and Forestry, Government <strong>of</strong> India.<br />
Subsequently, permits to import these<br />
agents into Australia were obtained<br />
from the relevant Australian regulatory<br />
authorities. We imported the three<br />
agents into a quarantine facility at<br />
the Alan Fletcher Research Station in<br />
January 2011 and later transferred them<br />
to the new quarantine facility at the<br />
Ecosciences Precinct. Since then, we<br />
have established cultures <strong>of</strong> two agents<br />
(Phycita sp. and A. indicus) and are<br />
currently conducting no-choice hostspecificity<br />
tests involving Australian<br />
Acacia species.<br />
United Kingdom<br />
The gall-inducing rust (R. acaciae-arabicae)<br />
was imported into quarantine facilities <strong>of</strong><br />
CABI Europe–UK on leaves <strong>of</strong> A. nilotica<br />
ssp. indica in October 2010. At CABI, the<br />
rust (IMI 398973 ex Tamil Nadu, India) was<br />
established and maintained as a uredinial<br />
Part 1 Integrated weed management 25
infection (Photo 10.1) on Australian<br />
A. nilotica plants under quarantine<br />
greenhouse conditions. The rust completed<br />
its urediniospore infection cycle—from<br />
spore penetration to sporulation and<br />
uredinia formation—on average in 21 days.<br />
The rust also regularly produced teliospores<br />
within existing uredinia, but spermogonia<br />
or aecia were not observed on inoculated<br />
A. nilotica plants.<br />
An initial host-specificity assessment<br />
<strong>of</strong> the rust (IMI 398973) on 17 Acacia<br />
species under quarantine greenhouse<br />
conditions showed that the pathogen<br />
evoked a range <strong>of</strong> macroscopic symptoms<br />
on the non-target species. These varied<br />
in consistency and intensity. With<br />
the exception <strong>of</strong> Acacia sutherlandii,<br />
R. acaciae-arabicae was not able to<br />
sporulate on any <strong>of</strong> the evaluated test<br />
plant species, internal mycelium (if<br />
present) was always limited, and the<br />
initiation <strong>of</strong> uredinia was not observed.<br />
A. sutherlandii, native to Queensland,<br />
is not a reported host <strong>of</strong> R. acaciaearabicae<br />
or <strong>of</strong> R. evansii (the name under<br />
which the rust was previously known),<br />
but under greenhouse conditions the<br />
rust was able to produce uredinia<br />
bearing viable urediniospores on<br />
this non-target species (Photo 10.2).<br />
Sporulation was, however, less prolific<br />
than that observed on A. nilotica and<br />
was always accompanied by strong<br />
plant defence responses. Furthermore,<br />
although urediniospores <strong>of</strong> R. acaciaearabicae<br />
produced on A. sutherlandii<br />
were viable, re-inoculation <strong>of</strong> the spores<br />
onto A. nilotica and A. sutherlandii<br />
resulted in successful sporulation only<br />
on the natural host A. nilotica. Possible<br />
reasons for this could be either a loss<br />
<strong>of</strong> virulence in urediniospores cycling<br />
through A. sutherlandii or a lower<br />
concentration <strong>of</strong> spore inoculum applied<br />
due to the initially limited production <strong>of</strong><br />
R. acaciae-arabicea on A. sutherlandii.<br />
Funding in 2010–11<br />
• MLA ($85 000)<br />
• Rural <strong>Industries</strong> Research and<br />
Development Corporation ($41 000)<br />
• Land Protection Fund ($38 000)<br />
• Queensland Government<br />
Photo 10.1 Uredinia <strong>of</strong> R. acaciae-arabicae on A. nilotica ssp. indica leaves<br />
Photo 10.2 Uredinia <strong>of</strong> R. acaciae-arabicae on A. sutherlandii leaves<br />
Collaborators<br />
• Roger Shivas, Principal Plant<br />
Pathologist (DEEDI)<br />
• Marion Seier (CABI Europe–UK,<br />
United Kingdom)<br />
• Arid Forest Research Institute,<br />
Jodhpur, Rajasthan, India<br />
• Institute <strong>of</strong> Forest Genetics and Tree<br />
Breeding, Coimbatore, Tamil Nadu, India<br />
More information<br />
Key publications<br />
Dhileepan, K 2009, ‘Acacia nilotica ssp.<br />
indica (L.) Willd. ex Del. (Mimosaceae)’,<br />
in R Muniappan, GVP Reddy & A Raman<br />
(eds), Biological control <strong>of</strong> tropical weeds<br />
using arthropods, Cambridge University<br />
Press, Cambridge, pp. 17–37.<br />
Dhileepan, K, Lockett, CJ, Robinson, M<br />
& Pukallus, K 2009, ‘Prioritising<br />
potential guilds <strong>of</strong> specialist herbivores<br />
as biological control agents for prickly<br />
acacia through simulated herbivory’,<br />
Annals <strong>of</strong> Applied Biology 154(1): 97–105.<br />
Dhileepan, K, Senaratne, KADW &<br />
Raghu, S 2006, ‘A systematic approach to<br />
biological control agent exploration and<br />
prioritisation for prickly acacia (Acacia<br />
nilotica ssp. indica)’, Australian Journal<br />
<strong>of</strong> Entomology 45(4): 303–07.<br />
For further information on this research<br />
project and access to key publications,<br />
visit the invasive plant and animal science<br />
pages on the Biosecurity Queensland<br />
website at www.biosecurity.qld.gov.au<br />
26 <strong>Technical</strong> <strong>highlights</strong>: research projects 2010–11
11. Biological control <strong>of</strong> Hudson pear (Cylindropuntia rosea)<br />
Project dates<br />
October 2009 – June 2012<br />
Project leader<br />
Dr Bill Palmer<br />
Ecosciences Precinct<br />
Tel: (07) 3255 4469<br />
Email: bill.palmer@deedi.qld.gov.au<br />
Other staff in 2010–11<br />
Peter Jones<br />
Objectives<br />
• Obtain permission to release the<br />
cochineal insect Dactylopius<br />
tomentosus as a biological control<br />
agent for Hudson pear in Australia<br />
by providing evidence <strong>of</strong> its hostspecificity<br />
through laboratory<br />
experimentation within quarantine.<br />
• Determine the effectiveness <strong>of</strong> this<br />
biotype <strong>of</strong> D. tomentosus against<br />
various other Cylindropuntia spp.<br />
found in Australia.<br />
Rationale<br />
Hudson pear (Cylindropuntia rosea)<br />
is native to Mexico. In Australia, it<br />
is found primarily in north-western<br />
New South Wales, but it also occurs<br />
in Queensland. It was approved as a<br />
target for biological control by the<br />
Natural Resource Management Standing<br />
Committee in 2008. Biosecurity<br />
Queensland has been contracted by<br />
the New South Wales Government<br />
<strong>Department</strong> <strong>of</strong> <strong>Primary</strong> <strong>Industries</strong> to<br />
test the host-specificity <strong>of</strong> the cochineal<br />
insect D. tomentosus in quarantine.<br />
Methods<br />
We culture the bug, care for the plants<br />
and test for appropriate host-specificity<br />
to ensure that the insect does not attack<br />
any native or economically desirable<br />
plant. We also evaluate the efficacy<br />
<strong>of</strong> the insect against other weedy<br />
Cylindropuntia spp. found in Australia.<br />
If testing determines that the insect<br />
is safe to release in Australia, the<br />
appropriate permissions will be obtained<br />
from regulatory authorities to enable its<br />
release from quarantine.<br />
Photo 11.1 A male D. tomentosus fertilising a mature female (hidden underneath waxy secretion)<br />
Our collaborators in New South Wales<br />
source the culture, test plants, design<br />
experiments in consultation with us,<br />
arrange for mass-rearing and release<br />
<strong>of</strong> the bug in the infested areas <strong>of</strong> New<br />
South Wales and write reports.<br />
Progress in 2010–11<br />
In August 2010, collaborator Dr Carla<br />
Chavez Moreno hand-carried a<br />
population <strong>of</strong> D. tomentosus collected on<br />
the required host C. rosea to Australia,<br />
where it was placed in quarantine.<br />
However, the insect could not use<br />
Australian populations <strong>of</strong> Hudson pear<br />
nor other Cylindropuntia spp. presently<br />
found in Australia. The culture was<br />
maintained on Mexican cladode material<br />
for many months but all attempts to rear<br />
it on Australian material failed.<br />
We are now attempting to culture<br />
other populations <strong>of</strong> D. tomentosus:<br />
a population infesting C. kleiniae was<br />
obtained from South Australia and<br />
host testing commenced; a population<br />
currently giving effective biological<br />
control <strong>of</strong> C. fulgida in South Africa will<br />
also be imported.<br />
We have also arranged for genetic<br />
studies to be undertaken on C. rosea<br />
from Mexico and Spain, C. fulgida<br />
from South Africa and most <strong>of</strong> the<br />
Australian Cylindopuntia spp. in order<br />
to have an improved understanding<br />
<strong>of</strong> the taxonomy <strong>of</strong> this genus.<br />
Given the problems encountered with<br />
D. tomentosus from Mexico, the question<br />
remains whether Hudson pear in<br />
Australia is really C. rosea or perhaps a<br />
hybrid. Linking our Hudson pear with<br />
similar genotypes in Mexico would<br />
also enable appropriate native range<br />
collections <strong>of</strong> D. tomentosus.<br />
Funding in 2010–11<br />
New South Wales Government<br />
<strong>Department</strong> <strong>of</strong> <strong>Primary</strong> <strong>Industries</strong><br />
($31 000)<br />
Collaborators<br />
• Royce Holtkamp (New South Wales<br />
Government <strong>Department</strong> <strong>of</strong> <strong>Primary</strong><br />
<strong>Industries</strong>)<br />
• Catherine Mathenge (University <strong>of</strong><br />
Western Sydney)<br />
• Carla Chavez Moreno (University <strong>of</strong><br />
Michoacan, Mexico)<br />
• Mayra Pérez and Sandi Cuen<br />
(Aridamerica AC, Mexico)<br />
• Helmuth Zimmermann (Helmuth<br />
Zimmermann & Associates,<br />
South Africa)<br />
More information<br />
For further information on this<br />
research project, visit the invasive<br />
plant and animal science pages on the<br />
Biosecurity Queensland website at<br />
www.biosecurity.qld.gov.au<br />
Part 1 Integrated weed management 27
12. Biological control <strong>of</strong> mother‑<strong>of</strong>‑millions (Bryophyllum spp.)<br />
Project dates<br />
January 2000 – July 2012<br />
Project leader<br />
Dr Bill Palmer<br />
Ecosciences Precinct<br />
Tel: (07) 3255 4469<br />
Email: bill.palmer@deedi.qld.gov.au<br />
Other staff in 2010–11<br />
Wilmot Senaratne and Liz Snow<br />
Objectives<br />
• Achieve biological control <strong>of</strong> mother<strong>of</strong>-millions<br />
by introducing and<br />
releasing exotic insect species or<br />
pathogens.<br />
• Produce risk, economic, stakeholder<br />
and partner analyses for the mother<strong>of</strong>-millions<br />
weed problem.<br />
• Support any application under the<br />
Biological Control Act 1987 through<br />
the various processes <strong>of</strong> the Act<br />
and determine whether the Act can<br />
be used to assist biological control<br />
projects.<br />
Rationale<br />
Mother-<strong>of</strong>-millions (Bryophyllum spp.),<br />
a native <strong>of</strong> Madagascar, is a Class 2<br />
declared weed in Queensland. It is<br />
toxic to cattle and can have substantial<br />
economic and environmental impacts.<br />
Surveys for potential biocontrol<br />
agents for mother-<strong>of</strong>-millions began<br />
in 2000. The weevils Osphilia tenuipes<br />
and Alcidodes sedi were studied in<br />
detail in the quarantine facility at the<br />
Alan Fletcher Research Station, while<br />
preliminary studies <strong>of</strong> two further<br />
agents were undertaken in South Africa.<br />
All potential biocontrol agents for<br />
mother-<strong>of</strong>-millions had narrow host<br />
ranges but were capable <strong>of</strong> attacking<br />
very closely related, exotic, ornamental<br />
plants such as Kalanchoe blossfeldiana<br />
and Echeveria spp.<br />
Due to potential conflicts <strong>of</strong> interest, all<br />
agents would require approval through<br />
the Biological Control Act 1987. When<br />
biological control targets and agents are<br />
declared under the Act, proponents are<br />
not legally liable for identified adverse<br />
effects and legal injunctions cannot be<br />
brought to prevent releases <strong>of</strong> the agent.<br />
Methods<br />
Potential biocontrol agents are imported<br />
for host-specificity testing in quarantine.<br />
If approval for release is obtained, we<br />
mass-rear agents and release them<br />
throughout the range <strong>of</strong> the weed<br />
in Queensland. We then monitor the<br />
releases to determine establishment<br />
progress and any effects <strong>of</strong> the agent.<br />
The process laid out in the Biological<br />
Control Act 1987 involves applying to<br />
the appropriate ministerial council. If<br />
the ministerial council unanimously<br />
supports the application, a biological<br />
control authority will seek the views<br />
<strong>of</strong> all stakeholders and determine the<br />
benefits and costs <strong>of</strong> the proposed<br />
biological control. If, on balance, the<br />
benefits outweigh costs, the ministerial<br />
council may by unanimous opinion<br />
approve the declaration <strong>of</strong> target and<br />
agent organisms under the Act.<br />
A PhD student, receiving some support<br />
and supervision from Biosecurity<br />
Queensland, studies populations <strong>of</strong><br />
mother-<strong>of</strong>-millions in the Western<br />
Downs to determine the effects <strong>of</strong> the<br />
South African citrus thrips<br />
(Scirtothrips aurantii).<br />
Progress in 2010–11<br />
We maintained cultures <strong>of</strong> O. tenuipes<br />
and A. sedi in quarantine throughout<br />
the year. These insects remain promising<br />
biocontrol agents if they can be approved<br />
for release. The insects were relocated<br />
to the new quarantine facility at the<br />
Ecosciences Precinct in February 2011.<br />
Additional host testing <strong>of</strong> both insect<br />
species was undertaken following the<br />
discovery that naturalised populations<br />
previously considered to be Kalanchoe<br />
crenata were now considered to be<br />
Kalanchoe spathulata. The results <strong>of</strong> this<br />
testing suggested that this plant was a<br />
good host for both insect species.<br />
An application for agent release through<br />
the Biological Control Act 1987 was<br />
submitted to the Australian Weeds<br />
Committee for discussion. With the<br />
support <strong>of</strong> this committee, an application<br />
was made to and approved by the<br />
<strong>Primary</strong> <strong>Industries</strong> Ministerial Council.<br />
The next step is to prepare nationwide<br />
notification and invite affected<br />
stakeholders to respond.<br />
The PhD student’s field studies <strong>of</strong><br />
S. aurantii indicated that additional<br />
biocontrol agents would be desirable to<br />
control mother-<strong>of</strong>-millions effectively.<br />
Funding in 2010–11<br />
Land Protection Fund ($73 000)<br />
Collaborators<br />
• Dr Bruce Wilson, General Manager,<br />
Invasive Plants and Animals<br />
(Biosecurity Queensland)<br />
• Michelle Rafter, PhD student (The<br />
University <strong>of</strong> Queensland)<br />
More information<br />
Key publications<br />
McLaren, DA, Palmer, WA & Morfe, TA<br />
2006, ‘Costs associated with declaring<br />
organisms through the Biological Control<br />
Act when conflicts <strong>of</strong> interest threaten<br />
weed biological control projects’, in<br />
C Preston, JH Watts & ND Crossman<br />
(eds), Proceedings <strong>of</strong> the 15th Australian<br />
Weeds Conference, Weed Management<br />
Society <strong>of</strong> South Australia, Adelaide,<br />
pp. 549–52.<br />
Witt, ABR 2004, ‘Initial screening <strong>of</strong> the<br />
stem-boring weevil Osphilia tenuipes, a<br />
candidate agent for the biological control<br />
<strong>of</strong> Bryophyllum delagoense in Australia’,<br />
Biocontrol 49(2): 197–209.<br />
Witt, ABR, McConnachie, AJ &<br />
Stals, R 2004, ‘Alcidodes sedi (Col.:<br />
Curculionidae), a natural enemy <strong>of</strong><br />
Bryophyllum delagoense (Crassulaceae)<br />
in South Africa and a possible candidate<br />
agent for the biological control <strong>of</strong> this<br />
weed in Australia’, Biological Control<br />
31(3): 380–87.<br />
Hannan-Jones, MA & Playford, J 2002,<br />
‘The biology <strong>of</strong> Australian weeds 40.<br />
Bryophyllum Salisb. species’, Plant<br />
Protection Quarterly 17(2): 42–57.<br />
For further information on this research<br />
project and access to key publications,<br />
visit the invasive plant and animal science<br />
pages on the Biosecurity Queensland<br />
website at www.biosecurity.qld.gov.au<br />
28 <strong>Technical</strong> <strong>highlights</strong>: research projects 2010–11
Part 2 Landscape protection and restoration<br />
13. Biological control <strong>of</strong> cat’s claw creeper (Macfadyena unguis-cati)<br />
Project dates<br />
September 2002 – June 2014<br />
Project leader<br />
Dr K. Dhileepan<br />
Ecosciences Precinct<br />
Tel: (07) 3255 4449<br />
Email: k.dhileepan@deedi.qld.gov.au<br />
Other staff in 2010–11<br />
Di Taylor and Mariano Treviño<br />
Objective<br />
Achieve biological control <strong>of</strong> cat’s claw<br />
creeper using introduced insect species.<br />
Rationale<br />
Cat’s claw creeper (Macfadyena unguiscati),<br />
an invasive liana native <strong>of</strong> Central<br />
and South America, is a major weed<br />
in coastal Queensland and New South<br />
Wales, where it poses a significant<br />
threat to biodiversity in riparian and<br />
rainforest communities. The plant is<br />
a structural parasite and produces<br />
stolons and subterranean root tubers.<br />
Biological control appears the most<br />
suitable management option for this<br />
weed. Management objectives focus<br />
on reducing the rate <strong>of</strong> shoot growth<br />
to limit the weed’s ability to climb and<br />
smother native vegetation, as well as<br />
reducing tuber biomass to minimise the<br />
tuber bank.<br />
Methods<br />
Host-specificity tests<br />
Host-specificity testing is conducted<br />
using potted test plants in a<br />
temperature-controlled (22 °C to 27 °C)<br />
quarantine insectary. We evaluate the<br />
potential host range <strong>of</strong> the leaf-mining<br />
buprestid beetle (Hylaeogena jureceki)<br />
on the basis <strong>of</strong> larval survival and<br />
development, adult feeding and survival,<br />
and oviposition preference using choice<br />
and no-choice tests involving 38 plant<br />
species in 12 families.<br />
Field-release and monitoring<br />
We mass-rear and field-release two<br />
biological control agents, the leafsucking<br />
tingid (Carvalhotingis visenda)<br />
and leaf-tying moth (Hypocosmia<br />
pyrochroma), in partnership with<br />
community groups. We use a simple<br />
and cost-effective method to mass-rear<br />
the leaf-tying moth by replacing potted<br />
plants with field-collected cut foliage<br />
to allow greater numbers <strong>of</strong> insects<br />
to be released in the field. After fieldrelease<br />
we conduct recovery surveys to<br />
determine the field establishment status<br />
<strong>of</strong> C. visenda and H. pyrochroma. At<br />
all release sites, we spend 20 minutes<br />
visually examining cat’s claw creeper<br />
plants and recording the incidence and<br />
abundance <strong>of</strong> C. visenda eggs, nymphs<br />
and adults and H. pyrochroma larvae.<br />
Progress in 2010–11<br />
Host-specificity tests<br />
We completed host-specificity tests<br />
<strong>of</strong> the leaf-mining buprestid beetle<br />
(H. jureceki) in quarantine at the<br />
Ecosciences Precinct in May 2011.<br />
These tests support previous studies<br />
from South Africa indicating that the<br />
beetle is highly host-specific and does<br />
not pose risk to any non-target plants<br />
in Australia. Minor exploratory adult<br />
feeding occurred on eight non-target<br />
species and oviposition on one nontarget<br />
species, but larval development<br />
occurred only on M. unguis-cati.<br />
Observations indicate that this is a<br />
highly damaging insect with two<br />
destructive life stages: larvae mine<br />
within the leaves and adults chew holes<br />
into leaves. Under laboratory conditions,<br />
high populations can completely<br />
defoliate cat’s claw creeper plants.<br />
A short generation time, longliving<br />
adults and predator-evading<br />
characteristics suggest that rapid<br />
population growth is likely in the<br />
field. We have applied to the relevant<br />
regulatory authorities to release this<br />
agent in Australia.<br />
Field-release and monitoring<br />
No further field-releases <strong>of</strong> the leafsucking<br />
tingid (C. visenda) were made<br />
after June 2010. Field-release <strong>of</strong> the<br />
leaf-tying moth (H. pyrochroma) was<br />
continued until October 2010. Over three<br />
years, 1272 adult moths, 77 750 mature<br />
larvae and 837 pupae have been released<br />
across 36 sites in Queensland and New<br />
South Wales. Field establishment status<br />
<strong>of</strong> the moth was not monitored due to<br />
relocation to the Ecosciences Precinct.<br />
Funding in 2010–11<br />
• Land Protection Fund ($148 000)<br />
• Queensland Government (Blueprint<br />
for the Bush)<br />
Collaborators<br />
• Stefan Neser and Anthony King<br />
[Agricultural Research Council—Plant<br />
Protection Research Institute (ARC-<br />
PPRI), South Africa]<br />
• Dr Tanya Scharaschkin (Queensland<br />
University <strong>of</strong> Technology, Science and<br />
Engineering Faculty)<br />
• Local government and community<br />
groups across south-eastern and<br />
central Queensland<br />
More information<br />
Key publications<br />
Dhileepan, K, Treviño, M, Bayliss, D,<br />
Saunders, M, Shortus, M, McCarthy, J,<br />
Snow, EL et al. 2010, ‘Introduction and<br />
establishment <strong>of</strong> Carvalhotingis visenda<br />
(Hemiptera: Tingidae) as a biological<br />
control agent for cat’s claw creeper<br />
Macfadyena unguis-cati (Bignoniaceae)<br />
in Australia’, Biological Control<br />
55(1): 58–62.<br />
Dhileepan, K, Bayliss, D & Treviño, M<br />
2010, ‘Thermal tolerance and potential<br />
distribution <strong>of</strong> Carvalhotingis visenda<br />
(Hemiptera: Tingidae), a biological<br />
control agent for cat’s claw creeper,<br />
Macfadyena unguis-cati (Bignoniaceae)’,<br />
Bulletin <strong>of</strong> Entomological Research<br />
100(2): 159–66.<br />
Part 2 Landscape protection and restoration 29
Rafter, MA, Wilson, AJ, Wilmot<br />
Senaratne, KAD & Dhileepan, K 2008,<br />
‘Climatic-requirements models <strong>of</strong> cat’s<br />
claw creeper Macfadyena unguis-cati<br />
(Bignoniaceae) to prioritise areas for<br />
exploration and release <strong>of</strong> biological<br />
control agents’, Biological Control<br />
44(2): 169–79.<br />
Conrad, KA & Dhileepan, K 2007, ‘Prerelease<br />
evaluation <strong>of</strong> the efficacy <strong>of</strong> the<br />
leaf-sucking bug Carvalhotingis visenda<br />
(Heteroptera: Tingidae) as a biological<br />
control agent for cat’s claw creeper<br />
Macfadyena unguis-cati (Bignoniaceae)’,<br />
Biocontrol Science and Technology<br />
17(3): 303–11.<br />
Dhileepan, K, Snow, EL, Rafter, MA,<br />
Treviño, M, McCarthy, J &<br />
Senaratne, KADW 2007, ‘The leaf-tying<br />
moth Hypocosmia pyrochroma (Lep.,<br />
Pyralidae), a host-specific biological<br />
control agent for cat’s claw creeper<br />
Macfadyena unguis-cati (Bignoniaceae)<br />
in Australia’, Journal <strong>of</strong> Applied<br />
Entomology 131(8): 564–8.<br />
Dhileepan, K, Treviño, M & Snow, EL<br />
2007, ‘Specificity <strong>of</strong> Carvalhotingis<br />
visenda (Hemiptera: Tingidae) as<br />
a biological control agent for cat’s<br />
claw creeper Macfadyena unguis-cati<br />
(Bignoniaceae) in Australia’, Biological<br />
Control 41(2): 283–90.<br />
Raghu, S, Dhileepan, K & Scanlan, JC<br />
2007, ‘Predicting risk and benefit a priori<br />
in biological control <strong>of</strong> invasive plant<br />
species: a systems modelling approach’,<br />
Ecological Modelling 208(2–4): 247–62.<br />
Raghu, S, Dhileepan, K & Treviño, M<br />
2006, ‘Response <strong>of</strong> an invasive liana to<br />
simulated herbivory: implications for its<br />
biological control’, Acta Oecologica<br />
29(3): 335–45.<br />
Raghu, S, Wilson, JR & Dhileepan, K<br />
2006, ‘Refining the process <strong>of</strong> agent<br />
selection through understanding<br />
plant demography and plant response<br />
to herbivory’, Australian Journal <strong>of</strong><br />
Entomology 45(4): 308–16.<br />
Raghu, S & Dhileepan, K 2005, ‘The<br />
value <strong>of</strong> simulating herbivory in<br />
selecting effective weed biological<br />
control agents’, Biological Control<br />
34(3): 265–73.<br />
Dhileepan, K, Treviño, M, Donnelly, GP<br />
& Raghu, S 2005, ‘Risk to non-target<br />
plants from Charidotis auroguttata<br />
(Chrysomelidae: Coleoptera), a potential<br />
biocontrol agent for cat’s claw creeper<br />
Macfadyena unguis-cati (Bignoniaceae)<br />
in Australia’, Biological Control<br />
32(3): 450–60.<br />
For further information on this research<br />
project and access to key publications,<br />
visit the invasive plant and animal science<br />
pages on the Biosecurity Queensland<br />
website at www.biosecurity.qld.gov.au<br />
30 <strong>Technical</strong> <strong>highlights</strong>: research projects 2010–11
14. Biological control <strong>of</strong> Madeira vine (Anredera cordifolia)<br />
Project dates<br />
June 2007 – June 2013<br />
Project leader<br />
Dr Bill Palmer<br />
Ecosciences Precinct<br />
Tel: (07) 3255 4469<br />
Email: bill.palmer@deedi.qld.gov.au<br />
Other staff in 2010–11<br />
Wilmot Senaratne, Liz Snow and<br />
Peter Jones<br />
Objective<br />
Achieve biological control <strong>of</strong> Madeira<br />
vine by introducing and releasing exotic<br />
insect species or pathogens.<br />
Rationale<br />
Madeira vine (Anredera cordifolia)<br />
is a South American plant that has<br />
become an increasingly important<br />
environmental weed in eastern<br />
Australia. This vigorous perennial<br />
climber or scrambling shrub forms<br />
dense mats that cover trees and shrubs<br />
and it is now a problem weed in<br />
rainforests, riparian lands, bushland<br />
remnants and conservation areas. It is<br />
the only naturalised plant in the family<br />
Basellaceae in Australia, so there is<br />
a good chance that biological control<br />
agents found in its native range would<br />
be sufficiently host-specific for safe<br />
release. However, one exotic species<br />
from this family, Ceylon spinach (Basella<br />
alba), is grown in gardens in southeastern<br />
Queensland. South African<br />
scientists led by Dr Stefan Neser have<br />
identified some promising agents, which<br />
were made available to this project.<br />
Methods<br />
Surveys for suitable biological control<br />
agents <strong>of</strong> Madeira vine are conducted<br />
in Argentina and Brazil by Dr Stefan<br />
Neser from the ARC-PPRI, South Africa.<br />
We import those insects considered<br />
suitable, mainly as a result <strong>of</strong> host<br />
testing undertaken in South Africa, into<br />
quarantine facilities in Australia for<br />
final host-specificity testing and biology<br />
studies. We also develop climatematching<br />
models for prospective agents.<br />
We then seek approval from the relevant<br />
regulatory authorities to release any<br />
suitable agents. Approved agents are then<br />
mass-reared for distribution to climatically<br />
favourable areas. Following release,<br />
we monitor establishment progress and<br />
evaluate any effects <strong>of</strong> the agents.<br />
Progress in 2010–11<br />
Host-specificity testing <strong>of</strong> the Madeira<br />
vine leaf beetle (Plectonycha correntina)<br />
concluded in late 2009 and showed that<br />
the beetle could use only Madeira vine<br />
as a host. The release <strong>of</strong> P. correntina<br />
for the biological control <strong>of</strong> Madeira<br />
vine was therefore recommended<br />
in a report submitted to Australian<br />
regulatory authorities in December<br />
2009. The case for this insect was the<br />
first to be processed through Biosecurity<br />
Australia’s new protocols for biological<br />
control agents.<br />
In early 2011, both regulatory<br />
authorities approved the submissions,<br />
and the insect was released from<br />
quarantine in April 2011.<br />
Mass-rearing <strong>of</strong> the insect commenced<br />
immediately within non-quarantine<br />
glasshouses at the Ecosciences Precinct.<br />
The insect was reared most satisfactorily<br />
in these facilities and produced sufficient<br />
numbers to begin field releases.<br />
By June 2011, we had released over 2000<br />
beetles, primarily in the western suburbs<br />
<strong>of</strong> Brisbane. Due to the approaching<br />
winter, this was not an optimal time for<br />
insect survival. However, these releases<br />
will help us gain a better understanding<br />
<strong>of</strong> the insect’s overwintering capabilities.<br />
We have also provided adult beetles to<br />
the New South Wales Government<br />
<strong>Department</strong> <strong>of</strong> <strong>Primary</strong> <strong>Industries</strong>. This<br />
is to establish a mass-rearing program at<br />
the Grafton research station to provide<br />
insects for release in New South Wales.<br />
Dr Neser made a further exploratory trip<br />
to South America in the hope <strong>of</strong> finding<br />
populations <strong>of</strong> the leaf beetle Phenrica sp.<br />
or other potential biocontrol agents,<br />
but no insect species was forthcoming.<br />
It would be highly desirable to begin<br />
research on a second agent to supplement<br />
P. correntina eventually.<br />
Photo 14.1 Experimentalist Liz Snow releases P. correntina on a Brookfield property with very<br />
heavy Madeira vine infestation<br />
Part 2 Landscape protection and restoration 31
Funding in 2010–11<br />
• Land Protection Fund ($193 000)<br />
• Queensland Government<br />
Collaborators<br />
• Dr Stefan Neser and Liamé van der<br />
Westhuizen (ARC-PPRI, South Africa)<br />
• New South Wales Government<br />
<strong>Department</strong> <strong>of</strong> <strong>Primary</strong> <strong>Industries</strong><br />
More information<br />
Key publications<br />
Cagnotti, C, McKay, F & Gandolfo, D<br />
2007, ‘Biology and host specificity<br />
<strong>of</strong> Plectonycha correntina Lacordaire<br />
(Chrysomelidae), a candidate for the<br />
biological control <strong>of</strong> Anredera cordifolia<br />
(Tenore) Steenis (Basellaceae)’, African<br />
Entomology 15(2): 300–09.<br />
Vivian-Smith, G, Lawson, BE, Turnbull, I<br />
& Downey, PO 2007, ‘The biology <strong>of</strong><br />
Australian weeds 46. Anredera cordifolia<br />
(Ten.) Steenis’, Plant Protection Quarterly<br />
22(1): 2–10.<br />
van der Westhuizen, L 2006, The<br />
evaluation <strong>of</strong> Phenrica sp. 2 (Coleoptera:<br />
Chrysomelidae: Alticinae), as a possible<br />
biological control agent for Madeira vine,<br />
Andredera cordifolia (Ten.) Steenis in<br />
South Africa, MSc thesis, <strong>Department</strong><br />
<strong>of</strong> Zoology and Entomology, Rhodes<br />
University, South Africa.<br />
For further information on this research<br />
project and access to key publications,<br />
visit the invasive plant and animal science<br />
pages on the Biosecurity Queensland<br />
website at www.biosecurity.qld.gov.au<br />
32 <strong>Technical</strong> <strong>highlights</strong>: research projects 2010–11
15. Biological control <strong>of</strong> lantana (Lantana camara)<br />
Project dates<br />
Ongoing<br />
Project leaders<br />
Michael Day<br />
Ecosciences Precinct<br />
Tel: (07) 3255 4453<br />
Email: michael.day@deedi.qld.gov.au<br />
Catherine Lockett<br />
Ecosciences Precinct (until December 2010)<br />
Tel: (07) 3255 4456<br />
Email: catherine.lockett@deedi.qld.gov.au<br />
Other staff in 2010–11<br />
Natasha Riding and Kelli Pukallus<br />
Objective<br />
Import, evaluate host-specificity <strong>of</strong>,<br />
mass-rear, field-release and monitor<br />
biological control agents for lantana.<br />
Rationale<br />
Lantana (Lantana camara) is native<br />
to tropical America and was first<br />
introduced into Australia in the mid-<br />
1800s. It has since become a major<br />
weed <strong>of</strong> agricultural and natural<br />
ecosystems. In grazing lands, lantana<br />
dominates preferred pasture species<br />
(thereby decreasing productivity) and<br />
also interferes with mustering. Some<br />
varieties are toxic to livestock. It is<br />
estimated that this weed costs the<br />
grazing industry over $100 million<br />
each year in lost production and control<br />
expenses. Lantana can become the<br />
dominant understorey species in natural<br />
ecosystems, blocking succession and<br />
decreasing biodiversity. Lantana is a<br />
Class 3 declared weed in Queensland<br />
and has been the target <strong>of</strong> biocontrol<br />
programs since 1914. Introducing new<br />
and more effective biocontrol agents<br />
further enhances control <strong>of</strong> lantana and<br />
reduces dependency on chemicals and<br />
other control methods.<br />
Methods<br />
We contract entomologists and<br />
pathologists in Mexico, South Africa and<br />
Europe to locate and study the biology,<br />
phenotype preference and preliminary<br />
host-specificity <strong>of</strong> potential biocontrol<br />
agents prior to their introduction into<br />
quarantine in Australia.<br />
Figure 15.1 Current distribution <strong>of</strong> O. camarae in Queensland<br />
We then determine the host-specificity<br />
<strong>of</strong> imported organisms. Any agents<br />
approved for field release are massreared<br />
and released in appropriate areas<br />
with the help <strong>of</strong> Biosecurity Queensland,<br />
DERM and local government field staff.<br />
Progress in 2010–11<br />
The lantana herringbone leaf-mining<br />
fly (Ophiomyia camarae) continues to be<br />
mass-reared at TWRC for field-release.<br />
However, field-releases in south-eastern<br />
Queensland have stopped, since the fly<br />
appears to be more suited to tropical<br />
regions. Leaf mines have been found at<br />
more than 200 sites from Cooktown to<br />
Shoalwater Bay, with insects moving up to<br />
50 km away from some release sites. There<br />
has been substantial defoliation <strong>of</strong> lantana<br />
bushes around Cooktown and Ayr. In<br />
south-eastern Queensland, the fly has been<br />
found in low numbers at only a few sites.<br />
Here, apart from having to cope with<br />
the cooler conditions, the fly has to<br />
compete with other biocontrol agents,<br />
particularly Calycomyza lantanae and<br />
Uroplata girardi.<br />
To comply with Australian regulatory<br />
authorities, we contracted ARC-PPRI to<br />
conduct host-specificity testing <strong>of</strong> the<br />
lantana budmite (Aceria lantanae). The<br />
studies found the budmite was sufficiently<br />
specific to release. We have now gained<br />
approval from Biosecurity Australia to<br />
release the budmite. Approval from the<br />
Australian Government <strong>Department</strong><br />
<strong>of</strong> Sustainability, Environment, Water,<br />
Population and Communities is pending.<br />
Part 2 Landscape protection and restoration 33<br />
Cairns<br />
Townsville<br />
Mackay<br />
O. camarae established<br />
O. camarae release sites<br />
major towns<br />
Rockhampton<br />
Bundaberg<br />
Gympie<br />
Brisbane
Photo 15.1 Galls on lantana caused by A. lantanae<br />
We have imported A. lantanae into the<br />
quarantine at the Ecosciences Precinct and<br />
are currently testing it against the main<br />
lantana phenotypes in Australia. It readily<br />
causes gall formation on the red-flowering<br />
and pink-edged red-flowering types,<br />
and causes some gall formation on the<br />
orange-flowering type. However, gall<br />
formation has not been observed on the<br />
common pink-flowering type. Fieldreleases<br />
are expected to commence in<br />
the summer <strong>of</strong> 2011–12.<br />
We contracted CABI Europe–UK to<br />
study the biology, biotype preference<br />
and host-specificity <strong>of</strong> the pathogen<br />
Puccinia lantanae. Investigations found<br />
some infection on the native Verbena<br />
<strong>of</strong>ficinalis var. africana (previously<br />
reported as V. gaudichaudii) and<br />
V. <strong>of</strong>ficinalis var. gaudichaudii as well<br />
as the weed Phyla canescens. A report<br />
has been received and a decision about<br />
conducting further testing is pending.<br />
Funding in 2010–11<br />
Land Protection Fund ($129 000)<br />
Collaborators<br />
• ARC-PPRI, South Africa<br />
• CABI Europe–UK, United Kingdom<br />
• Centre for Origin Research, United States<br />
• CSIRO Plant Industry<br />
• CSIRO Ecosystem Sciences<br />
• DERM<br />
• Office <strong>of</strong> Environment and Heritage,<br />
New South Wales<br />
• New South Wales Government<br />
<strong>Department</strong> <strong>of</strong> <strong>Primary</strong> <strong>Industries</strong><br />
• The University <strong>of</strong> Queensland<br />
• Local governments in Queensland and<br />
New South Wales<br />
More information<br />
Key publications<br />
Day, MD & Nahrung, HF 2010, ‘Preference<br />
and performance <strong>of</strong> Aconophora<br />
compressa Walker (Hemiptera:<br />
Membracidae) on different lantana<br />
phenotypes in Australia’, Australian<br />
Journal <strong>of</strong> Entomology 49(4): 363–8.<br />
Day, MD, Riding, N & Chamberlain, A<br />
2009, ‘Biology and host range <strong>of</strong><br />
Ophiomyia camarae Spencer (Diptera:<br />
Agromyzidae), a potential biocontrol<br />
agent for Lantana spp. (Verbenaceae)<br />
in Australia’, Biocontrol Science and<br />
Technology 19(6): 627–37.<br />
Day, MD & Zalucki, MP 2009, ‘Lantana<br />
camara Linn. (Verbenaceae)’, in<br />
R Muniappan, GVP Reddy & A Raman<br />
(eds), Biological control <strong>of</strong> tropical weeds<br />
using arthropods, Cambridge University<br />
Press, Cambridge, pp. 211–46.<br />
Zalucki, MP, Day, MD & Playford, J 2007,<br />
‘Will biological control <strong>of</strong> Lantana camara<br />
ever succeed? Patterns, processes &<br />
prospects’, Biological Control 42(3): 251–61.<br />
Day, MD, Broughton, S & Hannan-<br />
Jones, MA 2003, ‘Current distribution<br />
and status <strong>of</strong> Lantana camara and its<br />
biological control agents in Australia,<br />
with recommendations for further<br />
biocontrol introductions into other<br />
countries’, Biocontrol News and<br />
Information 24(3): 63N–76N.<br />
Day, MD, Wiley, CJ, Playford, J &<br />
Zalucki, MP 2003, Lantana: current<br />
management status and future prospects,<br />
Australian Centre for International<br />
Agricultural Research, Canberra, 128 pp.<br />
For further information on this research<br />
project and access to key publications,<br />
visit the invasive plant and animal science<br />
pages on the Biosecurity Queensland<br />
website at www.biosecurity.qld.gov.au<br />
34 <strong>Technical</strong> <strong>highlights</strong>: research projects 2010–11
16. Biological control <strong>of</strong> mikania vine (Mikania micrantha) in Papua New Guinea and Fiji<br />
Project dates<br />
July 2006 – June 2012<br />
Project leader<br />
Michael Day<br />
Ecosciences Precinct<br />
Tel: (07) 3255 4453<br />
Email: michael.day@deedi.qld.gov.au<br />
Objectives<br />
Introduce and establish biocontrol agents<br />
for mikania vine in Fiji and Papua New<br />
Guinea to:<br />
• reduce the impact <strong>of</strong> the weed to<br />
small-block holders and plantation<br />
owners in areas where it is a problem<br />
• reduce the seed load and thus the<br />
possibility <strong>of</strong> further spread into<br />
northern Australia<br />
• establish successful biocontrol<br />
methods for use in northern Australia<br />
if required<br />
• promote biocontrol as a safe and<br />
successful weed-control method<br />
• train scientists in Fiji and Papua New<br />
Guinea in biocontrol methods.<br />
Rationale<br />
Mikania vine (Mikania micrantha) is<br />
native to tropical America and is now<br />
a major weed throughout the South<br />
Pacific and South-East Asia. The<br />
plant is a perennial vine that grows<br />
extremely rapidly, about 1 m month –1 ,<br />
smothering crops and plantation trees.<br />
In Queensland, mikania vine is currently<br />
confined to the wet tropics region, where<br />
it has the potential to significantly affect<br />
the sugar, horticultural, beef and tourist<br />
industries and to spread throughout<br />
northern Australia. Mikania vine is a<br />
Class 1 declared weed in Queensland<br />
and is the target <strong>of</strong> a national cost-share<br />
eradication program. Biological control<br />
<strong>of</strong> mikania vine in the South Pacific was<br />
first attempted in the 1970s. However,<br />
the agent failed to establish. This project<br />
aims to introduce two butterfly species<br />
(Actinote anteas and A. thalia pyrrha)<br />
from Indonesia and the mikania rust<br />
(Puccinia spegazzinii) into both Fiji and<br />
Papua New Guinea.<br />
Better control <strong>of</strong> the weed in<br />
neighbouring countries such as Papua<br />
New Guinea and Fiji will in turn<br />
reduce the risk <strong>of</strong> further spread into<br />
Queensland. A greater understanding <strong>of</strong><br />
mikania vine and its biocontrol agents<br />
will also boost the state’s capacity<br />
to respond to an incursion if the<br />
eradication program is unsuccessful.<br />
Methods<br />
Suitable agents are selected based on<br />
results <strong>of</strong> host-specificity testing and<br />
field observations in other countries.<br />
We send information on the agents’<br />
life histories and host ranges to our<br />
collaborators in Fiji and Papua New<br />
Guinea, and request import permits.<br />
For the mikania butterflies (A. anteas<br />
and A. thalia pyrrha), additional host<br />
testing will be conducted in Fiji prior<br />
to field release. For the mikania rust<br />
(P. spegazzinii), CABI Europe–UK<br />
conducts additional host testing. We<br />
submit reports on the host testing <strong>of</strong> the<br />
agents to quarantine authorities in Fiji<br />
and Papua New Guinea. On approval,<br />
suitable agents are reared for release in<br />
both countries.<br />
We field-release agents throughout areas<br />
<strong>of</strong> Fiji and Papua New Guinea where<br />
mikania vine is a problem. Provincial<br />
staff assist in the release <strong>of</strong> agents as part<br />
<strong>of</strong> their training in biocontrol activities.<br />
We also set up programs for monitoring<br />
plant density and spread as well as for<br />
agent establishment, population increase,<br />
spread and impact on mikania vine.<br />
Progress in 2010–11<br />
Mass-rearing and field-release <strong>of</strong><br />
P. spegazzinii in both Fiji and Papua<br />
New Guinea continued throughout<br />
2010–11. In Papua New Guinea, the<br />
rust was released at nearly 300 sites in<br />
12 provinces in which the presence <strong>of</strong><br />
mikania vine is confirmed. Pustules<br />
have now persisted on field plants at<br />
more than 120 sites in 10 provinces and<br />
some pustules have been found more<br />
than 30 km from the point <strong>of</strong> release<br />
after 12 months. It is still too early,<br />
or the sites are too distant, to confirm<br />
establishment at many <strong>of</strong> the other sites.<br />
Field monitoring <strong>of</strong> several release sites<br />
around the research station at Kerevat<br />
found that the rust is having a severe<br />
impact on mikania vine. At one plot the<br />
rust suppressed the growth <strong>of</strong> mikania<br />
vine, which allowed other plants to smother<br />
the plant, reducing its cover substantially.<br />
Photo 16.1 Jenitha Fidelis from the Cocoa and Coconut Research Institute, Papua New Guinea,<br />
showing rust-infected mikania to villagers in East New Britain Province, Papua New Guinea<br />
Part 2 Landscape protection and restoration 35
Photo 16.2 Rust pustules on mikania vine in East New Britain Province, Papua New Guinea<br />
Vanimo<br />
Tabubil<br />
Wewak<br />
0 50 100 200 300 400 500<br />
km<br />
Madang<br />
Lae<br />
Lorengau<br />
Popondetta<br />
Port Moresby<br />
Kimbe<br />
Kavieng<br />
Alotau<br />
Rabaul<br />
P. spegazzinii established<br />
P. spegazzinii released<br />
but not checked<br />
P. spegazzinii not released<br />
Figure 16.1 Current distribution <strong>of</strong> mikania vine and P. spegazzinii in Papua New Guinea<br />
Rust abundance (infected plant parts m –2 )<br />
50<br />
40<br />
30<br />
20<br />
10<br />
average number <strong>of</strong> leaves infected<br />
average number <strong>of</strong> petioles infected<br />
average number <strong>of</strong> stems infected<br />
mikania vine cover<br />
0<br />
Apr. June Aug. Oct. Dec. Feb. Apr. June Aug. Oct. Dec. Feb. Apr. June<br />
2009 2010 2011<br />
Date<br />
Figure 16.2 Effect <strong>of</strong> P. spegazzinii on mikania vine cover in an experimental plot at Kerevat,<br />
Papua New Guinea<br />
Funding in 2010–11<br />
Australian Centre for International<br />
Agricultural Research ($70 000)<br />
Collaborators<br />
• Australian Centre for International<br />
Agricultural Research<br />
• Secretariat <strong>of</strong> the Pacific Community<br />
• Ministry <strong>of</strong> <strong>Primary</strong> <strong>Industries</strong>, Fiji<br />
• National Agricultural Research<br />
Institute, Papua New Guinea<br />
• Cocoa and Coconut Research Institute,<br />
Papua New Guinea<br />
• Papua New Guinea Oil Palm Research<br />
Association<br />
• CABI Europe–UK, United Kingdom<br />
• Roch Desmier de Chenon, Consultant,<br />
Indonesia<br />
More information<br />
Key publications<br />
Ellison, C & Day, M 2011, ‘Current status<br />
<strong>of</strong> releases <strong>of</strong> Puccinia spegazzinii for<br />
Mikania micrantha control’, Biocontrol<br />
News and Information 32(1): 1N–2N.<br />
Orapa, W, Day, M & Ellison, C 2008,<br />
‘New efforts at biological control <strong>of</strong><br />
Mikania micrantha H.B.K. (Asteraceae)<br />
in Papua New Guinea and Fiji’, in<br />
Proceedings <strong>of</strong> the Australia and New<br />
Zealand IOBC Biocontrol Conference,<br />
Sydney, p. 45.<br />
Pene, S, Orapa, W & Day, M 2007,<br />
‘First9 fungal pathogen to be utilized<br />
for weed biocontrol in Fiji and Papua<br />
New Guinea’, Biocontrol News and<br />
Information 28(3): 55N–56N.<br />
For further information on this research<br />
project and access to key publications,<br />
visit the invasive plant and animal science<br />
pages on the Biosecurity Queensland<br />
website at www.biosecurity.qld.gov.au<br />
36 <strong>Technical</strong> <strong>highlights</strong>: research projects 2010–11<br />
Aropa<br />
50<br />
40<br />
30<br />
20<br />
10<br />
0<br />
Mikania vine cover (%)
17. Weed eradication and containment: feasibility and program evaluation<br />
Project dates<br />
July 2003 – June 2013<br />
Project leader<br />
Dr Dane Panetta<br />
Ecosciences Precinct<br />
Tel: (07) 3255 4472<br />
Email: dane.panetta@deedi.qld.gov.au<br />
Other staff in 2010–11<br />
Simon Brooks and Shane Campbell<br />
Objectives<br />
• Provide a scientifically based<br />
rationale for decisions about the<br />
eradication and containment <strong>of</strong> weed<br />
incursions.<br />
• Refine eradication methods by using<br />
ecological information.<br />
• Monitor selected eradication programs<br />
and document associated costs.<br />
• Develop criteria for assessing the<br />
progress <strong>of</strong> eradication.<br />
• Develop procedures for assessing the<br />
feasibility <strong>of</strong> containment.<br />
Rationale<br />
Early intervention is the most costeffective<br />
means <strong>of</strong> preventing weed<br />
incursions from rapidly expanding.<br />
Strategies to achieve this aim range<br />
from eradication (where the objective<br />
is to drive the incursion to extinction)<br />
to containment (which may vary from<br />
absolute to degrees <strong>of</strong> slowing its spread).<br />
In previous research we have developed<br />
measures for evaluating eradication<br />
progress with regard to the delimitation<br />
(determining the extent <strong>of</strong> the incursion)<br />
and extirpation (local extinction)<br />
criteria. We also have developed<br />
dynamic models that provide estimates<br />
<strong>of</strong> eradication program duration (and<br />
total program costs when economic data<br />
is available).<br />
Research conducted worldwide over<br />
the past decade has shown that the<br />
circumstances under which weed<br />
eradication can be achieved are highly<br />
constrained, suggesting that eradication<br />
may not be widely applicable as a<br />
weed-invasion management strategy.<br />
However, if a weed is sufficiently serious<br />
to consider eradication there may <strong>of</strong>ten<br />
be a strong justification for attempting<br />
to slow its spread (partial containment)<br />
should eradication prove impossible.<br />
As some weeds may be more readily<br />
contained than others, it is important<br />
to better define the scope for partial<br />
containment.<br />
Ongoing eradication and containment<br />
feasibility work should contribute to<br />
management decisions. Case-study data<br />
is needed to determine to what degree<br />
management objectives have been<br />
achieved and to assess progress towards<br />
eradication or containment.<br />
Methods<br />
We collate data on eradication resources<br />
and progress for each infestation <strong>of</strong><br />
clidemia (Clidemia hirta), limnocharis<br />
(Limnocharis flava), miconia<br />
(Miconia calvescens, M. nervosa and<br />
M. racemosa), mikania vine (Mikania<br />
micrantha)—under the National Four<br />
Tropical Weeds Eradication Program—<br />
and Siam weed (Chromolaena odorata)<br />
in Queensland. Data includes method <strong>of</strong><br />
detection, discovery over time, trends in<br />
infested areas, population decline and<br />
time since last detection.<br />
Research on assessing the feasibility<br />
<strong>of</strong> containment has adopted both<br />
qualitative and quantitative approaches.<br />
Progress in 2010–11<br />
‘Four tropical weeds’ database<br />
We are currently converting the<br />
eradication progress reporting units<br />
from a buffered infestation area<br />
to fixed management areas <strong>of</strong> 1 ha<br />
(100 m × 100 m). This transition has<br />
been accompanied by more intense<br />
recording <strong>of</strong> plant presence and absence<br />
and will enable more consistent and<br />
accurate reporting from year to year<br />
over fixed areas. The transition will<br />
also enable portions <strong>of</strong> infestations<br />
to progress to a monitoring stage and<br />
improve the progression factors for large<br />
infestations, including the melastome<br />
species known only at single locations.<br />
A finer scale <strong>of</strong> recording and reporting<br />
can also increase the discovery rate <strong>of</strong><br />
management areas in the short term<br />
and increase the rate <strong>of</strong> reversion<br />
(from monitoring to control status).<br />
Eventually, this new spatial regime will<br />
enable field crews to target searching<br />
to areas potentially containing plants<br />
resulting from abiotic dispersal, such as<br />
wind and water, rather than relying on<br />
large generic dispersal buffers.<br />
Assessing feasibility <strong>of</strong><br />
containment<br />
The reduction <strong>of</strong> seed production in<br />
weed infestations is likely to play<br />
an important part in containment.<br />
However, this is the case for virtually<br />
all weeds and hence not a particularly<br />
discriminating feature for assessing the<br />
feasibility <strong>of</strong> containment. Therefore,<br />
our research has focused on the fates<br />
<strong>of</strong> seeds that are produced. That is,<br />
while management interventions can<br />
reduce propagule production (fecundity<br />
control) in source populations, weed<br />
spread can also be reduced through<br />
actions that interfere with dispersal<br />
and establishment, and/or lead to<br />
the detection and control <strong>of</strong> new<br />
infestations. Undetected new infestations<br />
may reproduce and give rise to further<br />
dispersal (shown as the dotted line in<br />
Figure 17.1).<br />
Three case studies have been used in<br />
initial qualitative assessments <strong>of</strong> the<br />
feasibility <strong>of</strong> containment (Figure 17.2).<br />
The distance <strong>of</strong> dispersal affects feasibility<br />
<strong>of</strong> containment, but the ability to<br />
predict where seeds are deposited is also<br />
important, since this influences both the<br />
potential for detection <strong>of</strong> new infestations<br />
and the effort required to do so. Branched<br />
broomrape (Orobanche ramosa, a parasitic<br />
annual weed targeted for eradication<br />
in South Australia) is considered most<br />
containable, since its dispersal is mainly<br />
human-mediated and can be traced.<br />
Parthenium is similar, but its seeds can<br />
be dispersed widely by floodwaters, so<br />
new infestations could be more difficult<br />
to find. The feasibility <strong>of</strong> containment <strong>of</strong><br />
miconia is considered lowest, since it is<br />
dispersed primarily by birds in relatively<br />
unpredictable directions.<br />
Quantitative assessment <strong>of</strong> the feasibility<br />
<strong>of</strong> containment is based on a model that<br />
includes the area that must be searched,<br />
the effort required to detect a weed<br />
within this area and the potential for<br />
colonisation and establishment in sites<br />
where foci <strong>of</strong> infestation are unlikely to<br />
be detected.<br />
Part 2 Landscape protection and restoration 37
Funding in 2010–11<br />
Queensland Government<br />
Collaborators<br />
Propagule pressure<br />
Habitat suitability<br />
• Oscar Cacho (University <strong>of</strong> New<br />
England)<br />
• Biosecurity Queensland (South<br />
Johnstone) and local government<br />
staff—provided data for eradication<br />
case studies<br />
Source population<br />
Propagule production<br />
Dispersal<br />
Establishment Detection<br />
Figure 17.1 Schematic diagram showing the dispersal–establishment–detection cycle<br />
Predictability <strong>of</strong> direction <strong>of</strong> dispersal<br />
branched broomrape<br />
1 2<br />
parthenium<br />
3 miconia 4<br />
Distance <strong>of</strong> dispersal<br />
Figure 17.2 Feasibility <strong>of</strong> weed containment as influenced by combinations <strong>of</strong> distance and<br />
predictability <strong>of</strong> direction <strong>of</strong> dispersal events, with basic scenarios ranked 1–4 in order <strong>of</strong><br />
decreasing feasibility <strong>of</strong> containment, and showing relative positions <strong>of</strong> case study species along<br />
with potential variability in each dimension<br />
More information<br />
Key publications<br />
Panetta, FD, Csurhes, SM, Markula, A<br />
& Hannan-Jones, MA 2011, ‘Predicting<br />
the cost <strong>of</strong> eradication for 41 Class 1<br />
declared weeds in Queensland’, Plant<br />
Protection Quarterly 26(2): 42–6.<br />
Hester, SM, Brooks, SJ, Cacho, OJ &<br />
Panetta, FD 2010, ‘Applying a simulation<br />
model to the management <strong>of</strong> an<br />
infestation <strong>of</strong> Miconia calvescens in the<br />
wet tropics <strong>of</strong> Australia’, Weed Research<br />
50(3): 269–79.<br />
Brooks, SJ, Panetta, FD & Sydes, TA<br />
2009, ‘Progress towards the eradication<br />
<strong>of</strong> three melastome shrub species from<br />
northern Australian rainforests’, Plant<br />
Protection Quarterly 24(2): 71–8.<br />
Fox, JC, Buckley, YM, Panetta, FD,<br />
Bourgoin, J & Pullar, D 2009,<br />
‘Surveillance protocols for management<br />
<strong>of</strong> invasive plants: modelling Chilean<br />
needle grass (Nassella neesiana) in<br />
Australia’, Diversity and Distributions<br />
15(4): 577–89.<br />
Long, RL, Steadman, KJ, Panetta, FD<br />
& Adkins, SW 2009, ‘Soil type does<br />
not affect seed ageing when soil water<br />
potential and temperature are controlled’,<br />
Plant and Soil 320(1–2): 131–40.<br />
Panetta, FD 2009, ‘Weed eradication:<br />
an economic perspective’, Invasive Plant<br />
Science and Management 2(4): 360–8.<br />
Brooks, SJ, Panetta, FD & Galway, KE<br />
2008, ‘Progress towards the eradication<br />
<strong>of</strong> mikania vine (Mikania micrantha)<br />
and limnocharis (Limnocharis flava)<br />
in northern Australia’, Invasive Plant<br />
Science and Management 1(3): 296–303.<br />
Long, RL, Panetta, FD, Steadman, KJ,<br />
Probert, R, Bekker, R, Brooks, SJ &<br />
Adkins, SW 2008, ‘Seed persistence in<br />
the field may be predicted by laboratorycontrolled<br />
aging’, Weed Science<br />
56(4): 523–28.<br />
Panetta, FD 2007, ‘Evaluation <strong>of</strong> weed<br />
eradication programs: containment and<br />
extirpation’, Diversity and Distributions<br />
13(1): 33–41.<br />
Panetta, FD & Lawes, R 2007, ‘Evaluation<br />
<strong>of</strong> the Australian branched broomrape<br />
(Orobanche ramosa) eradication<br />
program’, Weed Science 55(6): 644–51.<br />
Regan, TJ, McCarthy, MA, Baxter, PWJ,<br />
Panetta, FD & Possingham, HP 2006,<br />
‘Optimal eradication: when to stop<br />
looking for an invasive plant’, Ecology<br />
Letters 9(7): 759–66.<br />
Panetta, FD & Lawes, R 2005, ‘Evaluation<br />
<strong>of</strong> weed eradication programs: the<br />
delimitation <strong>of</strong> extent’, Diversity and<br />
Distributions 11(5): 435–42.<br />
For further information on this research<br />
project and access to key publications,<br />
visit the invasive plant and animal science<br />
pages on the Biosecurity Queensland<br />
website at www.biosecurity.qld.gov.au<br />
38 <strong>Technical</strong> <strong>highlights</strong>: research projects 2010–11
18. Ecology and control <strong>of</strong> national weed eradication targets<br />
Project dates<br />
July 2008 – June 2013<br />
Project leader<br />
Simon Brooks<br />
Tropical Weeds Research Centre<br />
Tel: (07) 4761 5708<br />
Email: simon.brooks@deedi.qld.gov.au<br />
Other staff in 2010–11<br />
Shane Campbell, Wayne Vogler, Kirsty<br />
Gough, Stephen Setter, Katie Patane and<br />
Sharon Rossow<br />
Objectives<br />
• Investigate key ecological attributes<br />
influencing the eradication <strong>of</strong> species<br />
targeted by national cost-share<br />
eradication programs.<br />
• Refine eradication methods by using<br />
ecological information.<br />
• Investigate alternative control methods<br />
for remote Siam weed infestations in<br />
the seasonally dry tropics.<br />
Rationale<br />
Siam weed (Chromolaena odorata) is a<br />
Class 1 declared weed in Queensland<br />
and has been the target <strong>of</strong> a national<br />
cost-share eradication program since its<br />
discovery in the wet tropics region <strong>of</strong><br />
northern Queensland in 1994. It has also<br />
been found in the upper Herbert River<br />
catchment (1997) and in the upper Ross<br />
River and Black River catchments west<br />
<strong>of</strong> Townsville (2003).<br />
The National Four Tropical Weeds<br />
Eradication Program commenced in<br />
2003, targeting four genera <strong>of</strong> Class 1<br />
weeds (Clidemia hirta, Limnocharis<br />
flava, Miconia calvescens, M. nervosa,<br />
M. racemosa and Mikania micrantha),<br />
which are located primarily on the wet<br />
tropics coast <strong>of</strong> Queensland.<br />
These eradication programs will only<br />
be successful if field crews can locate<br />
all individuals <strong>of</strong> each species, apply<br />
effective control measures, prevent new<br />
seed production and monitor infestations<br />
until the seed bank is exhausted. To<br />
address queries from the eradication<br />
programs, our research concentrates on<br />
key biological parameters (soil seed bank<br />
persistence, age to maturity, flowering<br />
behaviour, seed production and dispersal<br />
vectors and barriers) and on effective<br />
control methods for each species.<br />
Methods<br />
Specific questions investigated by this<br />
project and the trials to address them are<br />
outlined below.<br />
Are the key Siam weed biological<br />
characteristics <strong>of</strong> age to maturity and<br />
seed longevity the same in seasonally<br />
drier, warmer areas as they are along the<br />
wet tropics coast?<br />
• Siam weed seeds sourced from<br />
infestations in the wet and dry tropics<br />
are germinated in the quarantine<br />
laboratories at the Centre for Wet<br />
Tropics Agriculture (CWTA) and<br />
TWRC and seedlings are planted in<br />
pots at monthly intervals for one year.<br />
We collect data on growth rates and<br />
flowering behaviour and the plants<br />
are destructively harvested as they<br />
mature.<br />
• We bury fresh Siam weed seed from<br />
an infestation near Townsville in<br />
permeable mesh packets to investigate<br />
the effects <strong>of</strong> burial duration, grass<br />
cover, soil type and burial depth<br />
in a dry tropics environment at<br />
TWRC. Packets are retrieved every<br />
6–12 months until no viable seed<br />
is recovered. Previous research has<br />
shown that viable seed is exhausted<br />
7 years after burial in a wet tropics<br />
environment.<br />
Can larger Siam weed plants be controlled<br />
by repeated burning and how do repeat<br />
fires influence the soil seed bank?<br />
• We maintain monitoring plots<br />
within a large Townsville Siam<br />
weed infestation and subject them<br />
to repeated controlled burns.<br />
Pre-burn data collected includes<br />
plant size, fuel loads, soil seed banks<br />
and soil moisture levels. Post-burn<br />
assessments include fire damage and<br />
mortality <strong>of</strong> Siam weed, sizes <strong>of</strong> soil<br />
seed banks and seedling recruitment.<br />
Can Siam weed be effectively treated<br />
with a low-volume, high-concentration<br />
herbicide application through a splatter<br />
(gas) gun?<br />
• Some infestations in remote or<br />
rugged country cannot be treated<br />
with high-volume foliar herbicide<br />
applications and there has been<br />
a reliance on manual control. We<br />
conduct investigations into the use<br />
<strong>of</strong> a splatter gun herbicide applicator.<br />
This equipment can be carried in<br />
a backpack and relies on a higher<br />
concentration <strong>of</strong> herbicide in a lowvolume<br />
application.<br />
How long will seeds remain viable when<br />
immersed in creek water and will this<br />
survival influence search buffers? Is sea<br />
water a barrier to the dispersal <strong>of</strong> viable<br />
Siam weed and limnocharis seeds?<br />
• All national weed eradication target<br />
species occur along creek lines. In a<br />
seed immersion trial in the ecology<br />
laboratory at CWTA, we compare<br />
the seed viabilities <strong>of</strong> L. flava,<br />
C. hirta, M. calvescens and two seed<br />
collections <strong>of</strong> Siam weed immersed<br />
for 2–126 days in creek water, sea<br />
water and a 50/50 mix. Results will<br />
provide baseline data for models <strong>of</strong><br />
aquatic dispersal. We also conduct<br />
laboratory investigations into seed<br />
buoyancy and seed germination under<br />
increasing levels <strong>of</strong> salinity.<br />
How persistent are L. flava, M. calvescens<br />
and C. hirta soil seed banks?<br />
• Soil cores are collected regularly<br />
from an area with a high density <strong>of</strong><br />
M. calvescens (prior to control) at<br />
the El Arish infestation. Seed bank<br />
studies for L. flava are continuing at<br />
an infestation in a constantly wet,<br />
spring-fed, lowland tropical stream<br />
near Feluga. This data will guide the<br />
duration <strong>of</strong> control and monitoring<br />
activities, as there is no other<br />
information available on limnocharis<br />
seed persistence. All soil samples<br />
are sieved to remove, count and<br />
germinate seed.<br />
• We also bury C. hirta and<br />
M. calvescens seed in permeable<br />
mesh packets to investigate the<br />
effects <strong>of</strong> burial duration and depth<br />
in a wet tropics environment at<br />
CWTA. Packets are retrieved every<br />
6–24 months until no viable seed is<br />
recovered.<br />
Part 2 Landscape protection and restoration 39
Progress in 2010–11<br />
Siam weed—age to maturity<br />
At TWRC all <strong>of</strong> the Siam weed plants<br />
raised from Townsville seed in late<br />
October, November and December 2009<br />
flowered in May 2010. Also, 5 out <strong>of</strong><br />
6 plants raised from seed in late January<br />
2010 flowered in late May and were<br />
destructively harvested. All remaining<br />
plants sown monthly until October<br />
2010 flowered in May 2011. Some plants<br />
from three additional treatments sown<br />
fortnightly from mid-January 2011 also<br />
commenced flowering in May 2011.<br />
In the wet tropics trial, 6 out <strong>of</strong><br />
18 plants raised from seed between early<br />
November 2009 and mid-January 2010<br />
flowered in May 2010. All remaining<br />
plants that were sown monthly until<br />
November 2010 flowered in early<br />
May 2011.<br />
Both trials show that under ideal (pot)<br />
conditions, Siam weed can be raised<br />
from seed between November and<br />
January and flower by June. It is not yet<br />
known how <strong>of</strong>ten plants would flower so<br />
quickly under field conditions. However,<br />
both trials highlight the importance <strong>of</strong><br />
effectively surveying and controlling<br />
infestations between early February and<br />
flowering in May/June. Flowering plants<br />
varied in size depending on their age,<br />
so this trial illustrates that the time to<br />
flower bud initiation is driven by day<br />
length.<br />
Siam weed—seed longevity<br />
Seeds were buried in December 2009. We<br />
recorded a mean seed viability <strong>of</strong> 72% at<br />
the beginning <strong>of</strong> the trial. Considerable<br />
germination was noted in surfacesituated<br />
bags during the wet season<br />
and seed viability averaged 23% after<br />
6 months and 12.5% after 12 months<br />
across all burial depths. Viability after<br />
12 months <strong>of</strong> surface seed, seed buried at<br />
3 cm and seed buried at 13 cm was 4.1%,<br />
15.6% and 17.9% respectively. We are<br />
currently assessing seed retrieved after<br />
18 months.<br />
Siam weed—fire response<br />
For monitoring results following the<br />
first controlled burn in October 2008,<br />
see <strong>Technical</strong> <strong>highlights</strong> 2008–09<br />
and <strong>Technical</strong> <strong>highlights</strong> 2009–10.<br />
Controlled burns were not conducted<br />
in the following two years due to<br />
dangerously dry conditions in 2009 and<br />
wet conditions in 2010. In June 2011,<br />
we completed pre-burn assessments<br />
and conducted a second controlled burn<br />
shortly after.<br />
Siam weed—splatter gun trials<br />
For results from the first trial in<br />
March 2009, see <strong>Technical</strong> <strong>highlights</strong><br />
2009–10. A second trial in April 2010<br />
demonstrated that lower rates <strong>of</strong> two<br />
fluroxypyr-based herbicides were also<br />
effective. In May 2010, we conducted<br />
a third trial to verify the effectiveness<br />
<strong>of</strong> lower rates <strong>of</strong> fluroxypyr compared<br />
to higher rates <strong>of</strong> metsulfuron-methyl.<br />
Results are pending.<br />
Seed immersion trials<br />
Results <strong>of</strong> the seed immersion trial<br />
demonstrated that 126 days <strong>of</strong> immersion<br />
in any <strong>of</strong> the three water types tested<br />
is not a barrier to the dispersal <strong>of</strong><br />
viable seed for all four species included<br />
in this trial. However, further trials<br />
have shown that Siam weed seed will<br />
not survive when it is maintained in<br />
solutions containing more that 250 mmol<br />
<strong>of</strong> sodium chloride and M. calvescens<br />
seedlings will not establish in solutions<br />
containing more than 100 mmol <strong>of</strong><br />
sodium chloride. So although seed can<br />
be dispersed by sea or brackish water,<br />
highly saline environments are not<br />
suitable habitats for plant establishment.<br />
Miconia calvescens—seed bank<br />
persistence<br />
Sampling <strong>of</strong> the soil seed bank at<br />
El Arish shows that small numbers <strong>of</strong><br />
seedlings continue to emerge and there<br />
has been no decline in the density <strong>of</strong><br />
seed extracted from the soil.<br />
We also established a buried seed trial in<br />
October 2010. Prior to burial, over 80%<br />
<strong>of</strong> seed was viable. We are currently<br />
assessing seed retrieved after 6 months.<br />
Limnocharis—seed bank<br />
persistence<br />
Monitoring between 2003 and 2009 has<br />
shown no notable decline in viability<br />
or seed density <strong>of</strong> limnocharis in the<br />
soil seed bank at a site near Feluga<br />
(Table 18.1), even though seed input<br />
has not been recorded since 2004 and<br />
the number <strong>of</strong> plants emerging at the<br />
infestation has declined over this period.<br />
However, sampling in 2010 has detected<br />
a marked reduction in seed density<br />
(Table 18.1).<br />
Additional research<br />
In 2011, Siam weed leaf samples were<br />
collected from Townsville and wet<br />
tropics infestations and from a smaller,<br />
phenotypically different Siam weed<br />
infestation near Tully. Collaborator<br />
Dr Jane Oakey used the leaf samples<br />
to develop a specific test for low<br />
concentrations <strong>of</strong> C. odorata DNA <strong>of</strong><br />
both phenotypes. This investigation<br />
may lead to the use <strong>of</strong> water sampling to<br />
determine whether Siam weed is locally<br />
present or absent.<br />
A small trial was established in<br />
collaboration with CSIRO Ecosystem<br />
Sciences to measure the monthly<br />
emergence, survival and growth <strong>of</strong><br />
M. racemosa plants in the field. More<br />
than 80% <strong>of</strong> seed obtained from a<br />
M. racemosa plant in the field has been<br />
found to be viable and plants from<br />
these are currently raised to enable<br />
observations <strong>of</strong> age to maturity under<br />
controlled conditions.<br />
Funding in 2010–11<br />
• Queensland Government<br />
• National Siam Weed Eradication<br />
Program and Four Tropical Weeds<br />
Eradication Program, through<br />
national cost-share arrangements<br />
($60 000)<br />
40 <strong>Technical</strong> <strong>highlights</strong>: research projects 2010–11
Table 18.1 Number, distribution and viability <strong>of</strong> L. flava seeds extracted from 40 mud samples collected between 2003 and 2010 at an<br />
infestation near Feluga, northern Queensland<br />
Year 2003 2005 2006 2007 2008 2009 2010<br />
Number <strong>of</strong> seeds sieved from 40 samples 623 358 1252 489 530 323 8<br />
Samples with seeds (%) 70.7 77.5 82 55.5 67.5 47.5 2.5<br />
Average number <strong>of</strong> seeds per sample 15.2 9.0 31.3 12.2 13.3 8.1 0.4<br />
Seed viability (%) — 64.7 54.4 59.5 80.7 57.9 100<br />
Collaborators<br />
• Biosecurity Queensland <strong>of</strong>ficers based<br />
at South Johnstone and Townsville—<br />
provided assistance with locating and<br />
accessing trial areas<br />
• DERM staff—coordinated the<br />
controlled Siam weed burn<br />
• Dr Jane Oakey, Molecular Biologist<br />
(Biosecurity Queensland)<br />
• CSIRO Ecosystem Sciences, Atherton<br />
• School <strong>of</strong> Land, Crop and Food<br />
Sciences, The University <strong>of</strong><br />
Queensland<br />
More information<br />
For further information on this<br />
research project, visit the invasive<br />
plant and animal science pages on the<br />
Biosecurity Queensland website at<br />
www.biosecurity.qld.gov.au<br />
Part 2 Landscape protection and restoration 41
19. Class 1 weed control packages<br />
Project dates<br />
July 2008 – June 2013<br />
Project leader<br />
Joseph Vitelli<br />
Ecosciences Precinct<br />
Tel: (07) 3255 4473<br />
Email: joseph.vitelli@deedi.qld.gov.au<br />
Other staff in 2010–11<br />
Barbara Madigan and Annerose<br />
Chamberlain<br />
Objectives<br />
Develop reliable and effective control<br />
options that can be integrated into<br />
eradication programs for Queensland<br />
Class 1 declared weeds. This includes:<br />
• seeking a minor use herbicide permit<br />
that covers all Queensland Class 1<br />
declared plant species<br />
• collecting basic ecological data<br />
(e.g. time to reproductive maturity<br />
and soil seed bank dynamics) on<br />
priority Class 1 weeds<br />
• implementing an accelerated ageing<br />
test to determine potential seed<br />
longevity on targeted Class 1 weeds<br />
(where more than 1200 mature seeds<br />
can be sourced).<br />
Rationale<br />
Expanding the current Queensland<br />
Class 1 plant declaration list to species<br />
level yielded a list <strong>of</strong> 8978 taxa,<br />
including hybrids, cultivars and<br />
synonyms. Restricting the list to<br />
those Class 1 species already present<br />
in Australia narrowed the total to<br />
156, <strong>of</strong> which 53 species are currently<br />
naturalised in Queensland. For the<br />
majority <strong>of</strong> these species there is<br />
anecdotal, limited or no ecological<br />
information (e.g. age to reproductive<br />
maturity and seed bank persistence)<br />
available. Such data is essential for<br />
enhancing the effectiveness and<br />
efficiency <strong>of</strong> eradication efforts.<br />
Furthermore, knowledge <strong>of</strong> seed bank<br />
persistence provides insights into how<br />
long programs need to be maintained<br />
and the resources needed to achieve<br />
eradication.<br />
Control efforts are also hindered by a<br />
lack <strong>of</strong> chemical registrations. Of the<br />
53 naturalised Class 1 plant species,<br />
9 have chemical recommendations,<br />
21 are captured under broader<br />
categories (e.g. Acacia spp., cacti or<br />
the Environmental Permit PER11463)<br />
and 23 have no chemicals registered.<br />
A minor use herbicide permit covering<br />
all Queensland Class 1 declared plant<br />
species would greatly aid eradication<br />
efforts and enhance Queensland’s ability<br />
to respond to new incursions.<br />
Methods<br />
Ecological studies<br />
We collect basic ecological information<br />
(e.g. flowering period, seed production,<br />
age to reproductive maturity and seed<br />
bank persistence) on prioritised species<br />
from established infestations. All seeds<br />
are collected and removed from sites.<br />
At the conclusion <strong>of</strong> the study, all plants<br />
are killed.<br />
Control studies<br />
We develop chemical and non-chemical<br />
control options that can be integrated<br />
into eradication programs and provide<br />
data to assist minor use applications.<br />
Progress in 2010–11<br />
Ecological studies<br />
A seed library <strong>of</strong> Class 1 weeds<br />
naturalised in Queensland to date<br />
contains seeds from Mexican feather<br />
grass (Nassella tenuissima), Mexican<br />
bean tree (Cecropia peltata), trumpet<br />
tree (Cecropia palmata), badhara bush<br />
(Gmelina elliptica), mimosa (Mimosa<br />
pigra), Koster’s curse (Clidemia hirta),<br />
miconia (Miconia calvescens), Senegal<br />
tea (Gymnocoronis spilanthoides), Siam<br />
weed (Chromolaena odorata) and Acacia<br />
glauca.<br />
Field monitoring studies showed that the<br />
reproductive period for Mexican feather<br />
grass is from September to March. We<br />
have transplanted 38 seedlings <strong>of</strong> known<br />
age from the field and repotted them at<br />
the Ecosciences Precinct to determine<br />
time to reproductive maturity. To date,<br />
16% <strong>of</strong> plants have flowered at an age<br />
<strong>of</strong> 19–23 months between August and<br />
March. Studies are ongoing.<br />
Although their flowering was prolific,<br />
water mimosa (Neptunia oleracea)<br />
failed to produce seed at the Alan<br />
Fletcher Research Station, Ecosciences<br />
Precinct and TWRC, delaying planned<br />
seed studies. To resolve Neptunia<br />
identification problems in Queensland,<br />
N. oleracea and N. plena DNA samples<br />
were sought from the New York<br />
Herbarium and the Kew Royal Botanic<br />
Gardens Herbarium. Molecular probes<br />
for these two species have now been<br />
developed by Dr Jane Oakey.<br />
Eight additional Cecropia sites have<br />
been found in northern Queensland.<br />
Growth scars indicate that some plants<br />
are more than 20 years old. At a Clifton<br />
Beach location, three separate cohorts<br />
have established, with plant height<br />
ranging from 1.3 to 14 m. Morphological<br />
traits indicate at least three Cecropia<br />
species have established in northern<br />
Queensland. We have collected leaf<br />
samples from most sites and have stored<br />
them for future DNA analysis.<br />
Accelerated seed ageing trials have been<br />
initiated for Senegal tea, Siam weed,<br />
Acacia glauca, Koster’s curse, miconia<br />
and badhara bush. Germination/viability<br />
testing is ongoing.<br />
Control studies<br />
An alligator weed (Alternanthera<br />
philoxeroides) herbicide trial at Bullock<br />
Head Creek using glyphosate at two<br />
and three times the recommeneded rate<br />
appears to have been effective. The<br />
dense stand <strong>of</strong> alligator weed along 1 km<br />
<strong>of</strong> the creek has been reduced to isolated<br />
plants totalling less than 2 m 2 .<br />
A foliar spray screening trial involving<br />
five herbicides was initiated on Senegal<br />
tea growing at a Strathpine trial site in<br />
April 2011.<br />
Class 1 minor use permit<br />
A draft minor use permit capturing all<br />
Queensland Class 1 declared weeds is<br />
now complete. The final version will be<br />
submitted to APVMA by May 2012.<br />
To assist Class 1 eradication efforts,<br />
we obtained new minor use permits for<br />
control <strong>of</strong> gingers (Hedychium spp.),<br />
PER12436, and tussock grasses<br />
(Nassella spp.), PER12202. (For details,<br />
see project report 34 on page 76.)<br />
42 <strong>Technical</strong> <strong>highlights</strong>: research projects 2010–11
Photo 19.1 (a) Inflorescence, (b) pod, (c) adult tree, (d) leaves, (e) trunk and (f) seed <strong>of</strong> Acacia pringlei, a newly<br />
detected non-indigenous acacia species; all non-indigenous Acacia species are Class 1 declared weeds in Queensland<br />
Funding in 2010–11<br />
Queensland Government<br />
Collaborators<br />
• Dr Jane Oakey, Molecular Biologist<br />
(Biosecurity Queensland)<br />
• Biosecurity Queensland field staff<br />
• Brisbane City Council<br />
• Capricorn Pest Management Group<br />
• Logan City Council<br />
• Seqwater<br />
More information<br />
For further information on this<br />
research project, visit the invasive<br />
plant and animal science pages on the<br />
Biosecurity Queensland website at<br />
www.biosecurity.qld.gov.au<br />
Part 2 Landscape protection and restoration 43
20. Mimosa pigra research<br />
Project dates<br />
July 2008 – June 2013<br />
Project leader<br />
Joseph Vitelli<br />
Ecosciences Precinct<br />
Tel: (07) 3255 4473<br />
Email: joseph.vitelli@deedi.qld.gov.au<br />
Other staff in 2010–11<br />
Barbara Madigan<br />
Objectives<br />
• Study seedling emergence and<br />
seed bank dynamics <strong>of</strong> Mimosa<br />
pigra growing at Peter Faust Dam,<br />
Proserpine, to assist in the eradication<br />
<strong>of</strong> this species.<br />
• Investigate fire and chemical options<br />
for M. pigra control.<br />
• Determine the origins <strong>of</strong> M. pigra<br />
infestations in Queensland, Western<br />
Australia and the Northern Territory<br />
through next-generation (wholegenome)<br />
sequencing.<br />
Rationale<br />
Mimosa pigra is a WONS and a<br />
Class 1 declared weed in Queensland.<br />
Originating from Central America,<br />
M. pigra poses a major threat to the<br />
integrity <strong>of</strong> northern Australia’s<br />
wetlands, reducing biodiversity and<br />
affecting primary production. In<br />
the Northern Territory it has formed<br />
impenetrable, nearly mono-specific<br />
thickets over 800 km 2 . In February<br />
2001, the first infestation <strong>of</strong> M. pigra<br />
in Australia outside the Northern<br />
Territory was found at Peter Faust<br />
Dam, near Proserpine in central coastal<br />
Queensland. A stakeholder group was<br />
formed to eradicate the infestation.<br />
One <strong>of</strong> Biosecurity Queensland’s<br />
contributions is to provide research on<br />
the biology and control <strong>of</strong> M. pigra to aid<br />
in the eradication effort. This includes<br />
advising on the timing <strong>of</strong> site revisits to<br />
ensure plants are detected and controlled<br />
prior to setting seed, and predicting<br />
how long the eradication effort needs<br />
to continue.<br />
Methods<br />
The study site at Peter Faust Dam is<br />
located on the peninsula known as<br />
Point 10, extending from the 65% water<br />
storage capacity level to the middle <strong>of</strong><br />
the creek bed. This area includes closedcanopy<br />
M. pigra infestations (known<br />
as core areas) and individual M. pigra<br />
plants scattered across the peninsula.<br />
Seedling emergence and seed bank<br />
We record seedling counts annually in<br />
a 5 m grid pattern across the peninsula<br />
and take soil cores annually from<br />
different areas for seed bank studies. We<br />
also test the viability <strong>of</strong> recovered seeds.<br />
Molecular studies<br />
Next-generation (whole-genome)<br />
sequencing <strong>of</strong> M. pigra DNA is<br />
undertaken by the Australian Genome<br />
Research Facility using the 454<br />
sequencing system. Then Dr Jane Oakey<br />
uses up to 150 microsatellite loci for<br />
M. pigra to determine alleles from<br />
M. pigra infestations in Queensland and<br />
Western Australia and from 20 reference<br />
populations in the Northern Territory.<br />
In addition, we analyse populations from<br />
Africa (Botswana and Kenya), North,<br />
Central and South America (Brazil,<br />
Columbia, Costa Rica, Cuba, Ecuador,<br />
El Salvador, Guyana, Nicaragua, Venezuela<br />
and Mexico) and the Asia–Pacific region<br />
(Indonesia, Malaysia, Papua New Guinea,<br />
Thailand and Vietnam). The project<br />
aims to process up to 200 samples. This<br />
information will then be used to evaluate<br />
and compare allele frequencies between<br />
populations and determine the most<br />
likely source <strong>of</strong> each <strong>of</strong> the Australian<br />
populations.<br />
Progress in 2010–11<br />
Seedling emergence and seed bank<br />
Soil cores were not extracted during<br />
2010–11, as the core area remains<br />
inundated as a result <strong>of</strong> the heavy rains<br />
in early 2010.<br />
Molecular studies<br />
We isolated 215 polymorphic<br />
microsatellite markers from an enriched<br />
library <strong>of</strong> M. pigra genome DNA and<br />
used 76 <strong>of</strong> these microsatellite loci to<br />
screen 234 samples from Australia,<br />
Africa, North, Central and South<br />
America, and the Asia–Pacific region.<br />
The level <strong>of</strong> homogeneity found within<br />
the Australian samples was high,<br />
suggesting that a low level <strong>of</strong> genetic<br />
diversity exists for this species within<br />
Australia. This implies that there might<br />
have been only a single introduction <strong>of</strong><br />
M. pigra into Australia. Results from the<br />
neighbour-joining tree analysis indicate<br />
that the Australian population cluster<br />
may be related to the cluster containing<br />
specimens from Brazil and one region in<br />
Mexico (Guerrero, San Marcos). Further<br />
specimens will need to be examined<br />
before any credence is given to this<br />
relationship. The work is ongoing.<br />
Funding in 2010–11<br />
Queensland Government<br />
Collaborators<br />
• Dr Jane Oakey, Molecular Biologist<br />
(Biosecurity Queensland)<br />
• Kay Bailey, National WONS Coordinator<br />
for M. pigra and athel pine, and<br />
Christopher Collins, Bert Lukitsch, Ian<br />
Cowie, Ben Stuckey, Em Pedler and Ben<br />
Matthias (NRETAS, Northern Teritory)<br />
• Tim Heard and Gio Fichera (CSIRO<br />
Ecosystem Sciences)<br />
• Chris Hawkins and Tracey Vinnicombe<br />
(<strong>Department</strong> <strong>of</strong> Agriculture and Food,<br />
Western Australia)<br />
• Syd Laker (Adjumarllarl Rangers)<br />
• Willy Rioli, Vivian, Kim, D. Tipakalippa,<br />
Colin and Nicholas Hunter (Tiwi Land<br />
Council, Pirlingimpi Community)<br />
More information<br />
Key publication<br />
Vitelli, JS, Madigan, BA & Worsley, KJ<br />
2006, ‘Mimosa pigra in Queensland’, in<br />
C Preston, JH Watts and ND Crossman<br />
(eds), Proceedings <strong>of</strong> the 15th Australian<br />
Weeds Conference, Weed Management<br />
Society <strong>of</strong> South Australia, Adelaide,<br />
pp. 251–4.<br />
For further information on this research<br />
project and access to key publications,<br />
visit the invasive plant and animal science<br />
pages on the Biosecurity Queensland<br />
website at www.biosecurity.qld.gov.au<br />
44 <strong>Technical</strong> <strong>highlights</strong>: research projects 2010–11
21. Ecology and control <strong>of</strong> wet tropics weeds<br />
Project dates<br />
January 1999 – June 2013<br />
Project leader<br />
Melissa Setter<br />
Tropical Weeds Research Centre<br />
Tel: (07) 4064 1149<br />
Email: melissa.setter@deedi.qld.gov.au<br />
Other staff in 2010–11<br />
Stephen Setter, Katie Patane, Wayne<br />
Vogler, Laura Roden and Barbara<br />
Madigan<br />
Objective<br />
Increase our understanding <strong>of</strong> the<br />
ecology and control options <strong>of</strong> key<br />
wet tropics weeds to improve their<br />
management.<br />
Rationale<br />
Weeds pose a major threat to the high<br />
economic, environmental and social<br />
values <strong>of</strong> land in the wet tropics. Many<br />
wet tropics weeds are relatively recent<br />
arrivals and have not reached the<br />
full extent <strong>of</strong> their range and impact.<br />
Much <strong>of</strong> the basic ecological knowledge<br />
required to develop comprehensive<br />
long-term control strategies for wet<br />
tropics weeds is unavailable. This<br />
project conducts field, shadehouse and<br />
laboratory experiments on a number<br />
<strong>of</strong> priority weed species. Research<br />
findings will enable land managers to<br />
more effectively limit weed impacts on<br />
natural ecosystems, primary industries<br />
and tourism.<br />
Methods<br />
Field, shadehouse and laboratory<br />
experiments are currently underway<br />
on a number <strong>of</strong> weed species, including<br />
pond apple (Annona glabra), navua sedge<br />
(Cyperus aromaticus) and bog moss<br />
(Mayaca fluviatilis).<br />
Pond apple mechanical control<br />
Mechanical control <strong>of</strong> pond apple may<br />
be a viable option in some areas during<br />
drier periods. We test two different<br />
machines—the Positrack and the<br />
Tracksaw—for their kill rate, amount<br />
<strong>of</strong> follow-up control required, costeffectiveness<br />
and selectivity (effect on<br />
native vegetation). Trials are performed<br />
in pond apple infestations <strong>of</strong> similar size<br />
and density at the Daintree (Positrack)<br />
and in Innisfail (Tracksaw). There are<br />
notable differences between the two<br />
machines: the Positrack creates mulch<br />
from the destroyed plants, while the<br />
Tracksaw has herbicide application<br />
integrated into its control method and<br />
thus requires only a single operator. (For<br />
the Positrack experiment, we applied<br />
herbicide by hand.)<br />
Navua sedge<br />
We conduct a foliar herbicide screening<br />
trial near Millaa Millaa on the Atherton<br />
Tableland and we use the results to<br />
determine the next phase <strong>of</strong> herbicide<br />
trials. The aim is to develop effective<br />
selective herbicide options for navua<br />
sedge control in sown tropical pastures<br />
and non-agricultural areas.<br />
Bog moss<br />
We undertake field trials in a small<br />
drain infested with bog moss to provide<br />
control options for this emerging<br />
aquatic weed. Treatments include the<br />
use <strong>of</strong> herbicides (UniMaz 250 4 L ha –1<br />
with Bonus wetter 1.5 L ha –1 ) as well<br />
as shadecloth (92% light reduction)<br />
and black plastic (for more sensitive<br />
environments).<br />
We also conduct a herbicide screening trial<br />
in the glasshouse, in which 10 herbicides<br />
(triclopyr, endothal, glyphosate, imazapyr,<br />
metsulfuron, dichlobenil, flumioxazin,<br />
bispyribac, carfentrazone and diquat<br />
+ guar gum) are added at two rates to<br />
submerged bog moss growing in 2 L jars.<br />
The most effective herbicides are then<br />
tested in a rates trial in jars and in a large<br />
container trial with emergent bog moss.<br />
Progress in 2010–11<br />
Pond apple mechanical control<br />
We have established transects and<br />
applied the mechanical control<br />
treatments; monitoring and analysis are<br />
ongoing (Table 21.1). Very wet conditions<br />
prevented access, so we could not control<br />
regrowth as planned. Fruiting has been<br />
observed on resuckering trees 18 months<br />
after treatment.<br />
Photo 21.1 Stephen Setter applying herbicides to a navua sedge plot as part <strong>of</strong> initial<br />
screening trials<br />
Part 2 Landscape protection and restoration 45
Table 21.1 Area treated, cost and efficacy <strong>of</strong> the Positrack TM and Tracksaw TM machines in controlling pond apple and regrowth 12 months after treatment<br />
Positrack TM Tracksaw TM<br />
Area treated in 2 days (ha) 1.5 0.75<br />
Initial pond apple density (plants ha –1 ) 11 000 3 300<br />
Mortality—mechanical control only (%) 83 n/a<br />
Mortality—mechanical + herbicide control (%) 95 90<br />
Treatment cost ($ ha –1 ) 2 300 2 730<br />
Regrowth 12 months after treatment (seedlings ha –1 ) 2 600 18 500<br />
Table 21.2 Herbicide efficacy on navua sedge in the foliar spray screening trial at Millaa Millaa 2010<br />
Treatment a Live stems (% <strong>of</strong> baseline)<br />
Active ingredient<br />
Product application<br />
rate<br />
42 days after<br />
treatment<br />
84 days after<br />
treatment<br />
140 days after<br />
treatment<br />
Control — — 140 113 200<br />
Sempra halosulfuron 130 g ha –1 60 103 236<br />
Sempra +<br />
Roundup 360<br />
halosulfuron + glyphosate 130 g ha –1 + 3 L ha –1 37 37 81<br />
Sempra +<br />
Amicide 625<br />
halosulfuron + 2,4-D amine 130 g ha –1 + 3.2 L ha –1 56 143 232<br />
Sempra+ halosulfuron + 2,4-D amine 130 g ha<br />
Amicide 625 +<br />
Kamba 500<br />
+ dicamba<br />
–1 + 3.2 L ha –1 +<br />
1.44 L ha –1<br />
37 81 167<br />
Sempra + halosulfuron + 2,4-D amine 130 g ha<br />
Amicide 625 +<br />
Liase<br />
+ ammonium sulphate<br />
–1 + 3.2 L ha –1 +<br />
28.8 L ha –1<br />
50 115 223<br />
Sempra +<br />
Agritone<br />
halosulfuron + MCPA amine 130 g ha –1 + 2.67 L ha –1 64 154 314<br />
NUL2452b NUL2452 130 g ha –1 45 62 178<br />
NUL2452 + LVEc Agritone<br />
NUL2452 + LVE MCPA 130 g ha –1 + 1.75 L ha –1 47 78 208<br />
NUL2452 +<br />
Roundup 360<br />
NUL2452 + glyphosate 130 g ha –1 + 3 L ha –1 47 25 79<br />
Amicide 625 +<br />
Kamba 500<br />
2,4-D amine + dicamba 3.2 L ha –1 + 1.44 L ha –1 82 118 225<br />
Amicide 625 2,4-D amine 3.2 L ha –1 84 117 181<br />
Arsenal Express imazapyr + glyphosate 7 L ha –1 40 18 48<br />
Flame imazapic 1 L ha –1 68 121 268<br />
Flame +<br />
Roundup 360<br />
imazapic + glyphosate 1 L ha –1 + 3 L ha –1 46 23 151<br />
Midas MCPA + imazapic +<br />
imazapyr<br />
4 L ha –1 82 256 305<br />
Arsenal 250 imazapyr 4 L ha –1 46 63 154<br />
a Pulse adjuvant has been added to all herbicides at 2 mL L –1 .<br />
b NUL2452 is a Nufarm experimental product.<br />
c LVE = low-volatility ester.<br />
46 <strong>Technical</strong> <strong>highlights</strong>: research projects 2010–11
Navua sedge<br />
The foliar herbicide screening trial has<br />
been completed. No herbicide treatment<br />
adequately controlled navua sedge.<br />
All herbicides reduced the number<br />
<strong>of</strong> navua sedge live stems at 42 days<br />
after treatment. These numbers had<br />
increased at 84 days after treatment<br />
in all treatments except those<br />
containing glyphosate, in which live<br />
stems continued to decline. However,<br />
at 140 days after treament, live stem<br />
numbers increased in all treatments,<br />
with those not containing glyphosate<br />
showing consistently more than 150% <strong>of</strong><br />
the baseline value (Table 21.2).<br />
Although treatments containing<br />
glyphosate were the most effective,<br />
they are not selective and therefore not<br />
suitable for use in grass-based pasture<br />
systems and other non-agricultural<br />
situations where selective herbicides<br />
are required. Future research will<br />
focus on Sempra and Sempra-based<br />
herbicide mixes, including split herbicide<br />
application in combination with<br />
pasture management practices. Other<br />
herbicides will be screened for efficacy<br />
as necessary.<br />
Bog moss<br />
In the field trials, estimated biomass<br />
reduction 120 days after treatment<br />
for the herbicide, black plastic and<br />
shadecloth treatments were 100%, 100%<br />
and 95% respectively.<br />
For the herbicide screening trial, we<br />
made final assessments at 120 days after<br />
treatment. We will now test the six most<br />
effective herbicides (triclopyr, endothal,<br />
diquat + guar gum, metsulfuron,<br />
fumioxazin and carfentrazone) at four<br />
rates each in a rates trial.<br />
Funding in 2010–11<br />
• Land Protection Fund ($62 000)<br />
• Queensland Government<br />
Collaborators<br />
• Cairns Regional Council<br />
• Cassowary Coast Regional Council<br />
• Far North Queensland Regional<br />
Organisation <strong>of</strong> Councils<br />
More information<br />
Key publications<br />
Westcott, DA, Setter, MJ, Bradford, MG,<br />
McKeown, A & Setter, S 2008,<br />
‘Cassowary dispersal <strong>of</strong> the invasive<br />
pond apple in a tropical rainforest: the<br />
contribution <strong>of</strong> subordinate dispersal<br />
modes in invasion’, Diversity and<br />
Distributions 14(2): 432–9.<br />
Mason, LB, Setter, MJ, Setter, SD,<br />
Hardy, T & Graham, MF 2008, ‘Ocean<br />
dispersal modelling for propagules<br />
<strong>of</strong> pond apple (Annona glabra L.)’, in<br />
RD van Klinken, VA Osten, FD Panetta<br />
& JC Scanlan (eds), Proceedings <strong>of</strong> the<br />
16th Australian Weeds Conference,<br />
Queensland Weeds Society, Brisbane,<br />
Queensland, pp. 519–21.<br />
Setter, SD, Setter, MJ, Graham, MF<br />
& Vitelli, JS 2008, Buoyancy and<br />
germination <strong>of</strong> pond apple (Annona<br />
glabra L.) propagules in fresh and salt<br />
water’, in RD van Klinken, VA Osten,<br />
FD Panetta & JC Scanlan (eds),<br />
Proceedings <strong>of</strong> the 16th Australian Weeds<br />
Conference, Queensland Weeds Society,<br />
Brisbane, Queensland, pp. 140–2.<br />
For further information on this<br />
research project and access to key<br />
publications, visit the invasive plant<br />
and animal science pages on the<br />
Biosecurity Queensland website at<br />
www.biosecurity.qld.gov.au<br />
Part 2 Landscape protection and restoration 47
22. Population viability analysis models for better management <strong>of</strong> lantana<br />
(Lantana camara)<br />
Project dates<br />
July 2008 – June 2012<br />
Project leader<br />
Dr Olusegun Osunkoya<br />
Ecosciences Precinct<br />
Tel: (07) 3255 4474<br />
Email: olusegun.osunkoya@deedi.qld.gov.au<br />
Other staff in 2010–11<br />
Christine Perrett and Cameron Clark<br />
Objectives<br />
• Use size-structured population<br />
matrices and mathematical models<br />
to examine vital rates <strong>of</strong> growth,<br />
reproduction and survival <strong>of</strong> lantana<br />
under various landscape scenarios to<br />
project its population growth into the<br />
future.<br />
• Identify, from a suite <strong>of</strong> demographic<br />
parameters and with the aid <strong>of</strong><br />
computer simulations and model<br />
predictions, the main driver/s<br />
<strong>of</strong> population growth that could<br />
be manipulated for management<br />
purposes.<br />
• Analyse spatio-temporal changes in<br />
stand dynamics <strong>of</strong> lantana to explore<br />
better management <strong>of</strong> the weed.<br />
Rationale<br />
Lantana (Lantana camara) is a WONS<br />
and a Class 3 declared weed in<br />
Queensland. Despite millions <strong>of</strong> dollars<br />
spent on control, research and extension<br />
work, there is a dearth <strong>of</strong> quantitative<br />
data encompassing the entire life cycle<br />
<strong>of</strong> the weed. To date, no attempt has been<br />
made to carry out population viability<br />
analyses on the species, despite the<br />
widely held view that such analyses,<br />
when done in concert with sensitivity<br />
analyses and numerical simulations,<br />
could help greatly in finetuning<br />
management strategies for control<br />
<strong>of</strong> invasive organisms. This project<br />
aims to fill this apparent gap in our<br />
understanding <strong>of</strong> the invasion biology <strong>of</strong><br />
lantana.<br />
Methods<br />
We set up and census permanent plots <strong>of</strong><br />
50 m × 50 m at each <strong>of</strong> four infested sites<br />
in the Yarraman–Blackbutt area west <strong>of</strong><br />
Brisbane (Photo 22.1) to determine the<br />
parameters <strong>of</strong> lantana’s vital rates (seed<br />
germination and dormancy, seedling,<br />
juvenile and adult growth and survival,<br />
and adult fecundity) for projection <strong>of</strong> its<br />
population growth. We also use spatial<br />
analytical techniques to assess firstorder<br />
and second-order spatial patterns<br />
<strong>of</strong> established individuals and recruits.<br />
The four field sites (hoop pine plantation,<br />
natural forests subject to either periodic<br />
burning or grazing regimes, and cattle<br />
property) contain, in increasing order, low<br />
to moderate infestations <strong>of</strong> lantana, but<br />
differ in soil properties, rainfall intensity,<br />
land use type and weed control practices.<br />
Frequency<br />
30<br />
25<br />
20<br />
15<br />
10<br />
5<br />
0<br />
0 100 200<br />
30<br />
25<br />
20<br />
15<br />
10<br />
5<br />
Progress in 2010–11<br />
The third and final census <strong>of</strong> population<br />
dynamics across the four field<br />
sites—consisting <strong>of</strong> more than 2000<br />
permanently tagged lantana plants—was<br />
completed. We are now using census<br />
data to explore spatio-temporal variation<br />
in stand dynamics, spatial patterns and<br />
population growth <strong>of</strong> the weed.<br />
Populations at most sites exhibited plant<br />
height and crown size distributions that<br />
are L-shaped, J-shaped or symmetrical<br />
and thus unimodal. Bimodality was<br />
observed at the farm site only; this<br />
suggests that two distinctive cohorts<br />
exist (Figure 22.1). Relative growth rate<br />
<strong>of</strong> lantana plants at the farm site was<br />
not influenced by size. This contrasts<br />
significantly with trends observed in the<br />
other three sites, where one-sided (size<br />
asymmetric) growth and competition<br />
were apparent.<br />
Farm Forest (grazing) Forest (burning) Hoop pine plantation<br />
2008 2008 2008 2008<br />
30<br />
120<br />
50<br />
60<br />
25<br />
100<br />
40<br />
50<br />
20<br />
80<br />
30<br />
40<br />
15<br />
10<br />
60<br />
40<br />
20<br />
30<br />
20<br />
5<br />
20<br />
10<br />
10<br />
0<br />
0 100 200 300<br />
0<br />
0 100 200 300<br />
0<br />
0 100 200 300<br />
0<br />
0 100 200 300 400<br />
2009<br />
2010<br />
48 <strong>Technical</strong> <strong>highlights</strong>: research projects 2010–11<br />
120<br />
100<br />
80<br />
60<br />
40<br />
20<br />
120<br />
100<br />
80<br />
60<br />
40<br />
20<br />
2009 2009 2009<br />
0<br />
0<br />
0<br />
0 100 200 300<br />
0 100 200 300 0 100 200 300<br />
50<br />
40<br />
30<br />
20<br />
10<br />
0<br />
0<br />
0<br />
300 0 100 200 300 0 100 200 300 0 100 200 300 400<br />
2010 2010<br />
50<br />
40<br />
30<br />
20<br />
10<br />
Plant height (cm)<br />
Figure 22.1 Changes in lantana plant height distribution in each <strong>of</strong> the four populations<br />
surveyed over three years: note that the y-axis (frequency) scale varies between sites<br />
60<br />
50<br />
40<br />
30<br />
20<br />
10
Spatial pattern analyses indicated<br />
that established and newly recruited<br />
individuals are aggregated and that the<br />
degree <strong>of</strong> aggregation decreases with<br />
plant size. However, after fire, seedling<br />
and juvenile recruitment assume negative<br />
association (spatial displacement/<br />
decoupling) in relation to established<br />
individuals, perhaps in response to<br />
increased lantana litter (fuel load) and thus<br />
more intense temperature build-up around<br />
existing parent plants during burning.<br />
This finding implies that in a landscape<br />
where burning is used as a management<br />
tool, any follow-up with herbicide that<br />
focuses on reducing recruitment can<br />
simply concentrate on spaces between<br />
established individuals, thereby reducing<br />
both herbicide and labour cost.<br />
Density and plant size had appreciable<br />
effects on the weed’s reproductive<br />
capacity and growth, but surprisingly<br />
not on survival. The trends in fruit<br />
production as a function <strong>of</strong> plant<br />
height were statistically significant at<br />
p < 0.05. The intercept but not the slope<br />
differed significantly (p < 0.05) between<br />
populations (Figure 22.2).<br />
On average, lantana populations exhibit<br />
reproductive activity at least twice per<br />
year, and even more in a good season,<br />
when resources (especially moisture)<br />
are adequate (Figure 22.3). The lantana<br />
population at the hoop pine plantation<br />
could only be followed in the first<br />
10 months <strong>of</strong> the survey due to closing<br />
<strong>of</strong> the canopy and the impenetrable<br />
thicket that then developed.<br />
Fruit abundance (log)<br />
5.0<br />
4.5<br />
4.0<br />
3.5<br />
3.0<br />
2.5<br />
2.0<br />
1.5<br />
1.0<br />
0.5<br />
0.0<br />
1.5 1.8 2.1 2.4<br />
Plant height (log cm)<br />
Part 2 Landscape protection and restoration 49<br />
farm<br />
forest (grazing)<br />
forest (burning)<br />
hoop pine plantation<br />
Figure 22.2 Lantana fruit production in 2008 as a function <strong>of</strong> plant height in the four<br />
populations surveyed<br />
(a)<br />
100<br />
Lantana plants flowering (%)<br />
80<br />
60<br />
40<br />
20<br />
(b)<br />
100<br />
Lantana plants fruiting (%)<br />
0<br />
Feb. Apr. June Aug. Oct. Dec. Feb. Apr. June Aug. Oct. Dec. Feb. Apr<br />
2009<br />
Date<br />
2010 2011<br />
80<br />
60<br />
40<br />
20<br />
farm<br />
forest (grazing)<br />
forest (burning)<br />
hoop pine<br />
plantation<br />
0<br />
Feb. Apr. June Aug. Oct. Dec. Feb. Apr. June Aug. Oct. Dec. Feb. Apr<br />
2009<br />
Date<br />
2010 2011<br />
Figure 22.3 Pattern <strong>of</strong> (a) flowering and (b) fruiting <strong>of</strong> lantana over two years in the four<br />
populations surveyed
Soil-stored seed abundance (seeds m –2 )<br />
(a)<br />
5000<br />
4000<br />
3000<br />
2000<br />
1000<br />
(b)<br />
Soil-stored seed germination (%)<br />
(c)<br />
Seed germination (%)<br />
0<br />
12<br />
10<br />
8<br />
6<br />
4<br />
2<br />
0<br />
50<br />
45<br />
40<br />
35<br />
30<br />
25<br />
20<br />
15<br />
10<br />
5<br />
0<br />
2008<br />
2009<br />
2010<br />
standard error<br />
Farm Forest (grazing) Forest (burning) Hoop pine plantation<br />
Site<br />
2008<br />
2009<br />
2010<br />
standard error<br />
Farm Forest (grazing) Forest (burning) Hoop pine plantation<br />
Site<br />
fresh seeds<br />
1-year-old seeds<br />
2-year-old seeds<br />
standard error<br />
Significance<br />
Site p < 0.02<br />
Year p < 0.02<br />
Site × year p < 0.001<br />
Significance<br />
Site<br />
Year<br />
Site × year<br />
Significance<br />
Site<br />
Year<br />
Site × year<br />
p < 0.05<br />
Not significant<br />
p < 0.05<br />
Farm Forest (grazing) Forest (burning) Hoop pine plantation<br />
Site<br />
Periodic but slow/moderate burning <strong>of</strong><br />
a lantana infestation as a management<br />
tool appears not to tilt the population<br />
to negative growth, although it can<br />
reduce soil-stored seed viability and<br />
abundance (which can be as high as<br />
1000 seeds m –2 ). Approximately 25% <strong>of</strong><br />
fresh lantana seeds remain viable even<br />
after three years <strong>of</strong> burial, confirming<br />
that seed persistence <strong>of</strong> the weed can be<br />
long (Figure 22.4).<br />
Environmental variability is the norm<br />
rather than the exception. Over three<br />
years, our surveys across varying<br />
landscape and land-use types have<br />
enabled us to capture such variability.<br />
The next task is to build robust<br />
population growth models and then<br />
combine the demographic information<br />
collected with economic data<br />
(e.g. control cost per plant or per hectare)<br />
and environmental data (e.g. long-term<br />
rainfall trend). This will lead to better<br />
informed decisions on the feasibility <strong>of</strong><br />
local control/eradication <strong>of</strong> the weed.<br />
Funding in 2010–11<br />
• Queensland Government<br />
• Land Protection Fund ($37 000)<br />
Collaborators<br />
• S. Raghu (CSIRO Ecosystem Sciences,<br />
Brisbane)<br />
• Joe Scalan (Biosecurity Queensland,<br />
Toowoomba)<br />
More information<br />
Key publication<br />
Osunkoya, OO, Perrett, C & Fernando, C<br />
2010, ‘Population viability analysis<br />
models for Lantana camara L.<br />
(Verbenaceae): a weed <strong>of</strong> national<br />
significance’, in SM Zydenbos (ed.),<br />
Proceedings <strong>of</strong> the 17th Australasian<br />
Weeds Conference, New Zealand Plant<br />
Protection Society, Christchurch, New<br />
Zealand, pp. 99–102.<br />
For further information on this research<br />
project and access to key publications,<br />
visit the invasive plant and animal science<br />
pages on the Biosecurity Queensland<br />
website at www.biosecurity.qld.gov.au<br />
50 <strong>Technical</strong> <strong>highlights</strong>: research projects 2010–11<br />
p < 0.02<br />
p < 0.05<br />
p < 0.05<br />
Figure 22.4 Seed trait dynamics <strong>of</strong> lantana in each <strong>of</strong> the four populations surveyed: (a) soilstored<br />
seed abundance, (b) soil-stored seed germination and (c) seed germination in relation to<br />
time since soil burial
23. Impacts <strong>of</strong> environmental weeds on soil processes<br />
Project dates<br />
January 2010 – June 2012<br />
Project leader<br />
Dr Olusegun Osunkoya<br />
Ecosciences Precinct<br />
Tel: (07) 3255 4474<br />
Email: olusegun.osunkoya@deedi.qld.gov.au<br />
Other staff in 2010–11<br />
Christine Perrett and Cameron Clark<br />
Objective<br />
Document the impacts <strong>of</strong> environmental<br />
weeds on soil processes.<br />
Rationale<br />
The presence <strong>of</strong> aggressive exotic<br />
plants poses a serious threat to natural<br />
ecosystems. Lantana (Lantana camara)<br />
and various weedy vines—such as cat’s<br />
claw creeper (Macfadyena unguis-cati)<br />
and Madeira vine (Anredera cordifolia)—<br />
are exotic weeds <strong>of</strong> great significance in<br />
Queensland and nationally. Currently,<br />
there is little quantitative information on<br />
changes in below-ground (soil) ecosystem<br />
properties mediated by the presence <strong>of</strong><br />
these invasive species, including changes<br />
in physicochemical properties, insect<br />
diversity and microbial activity.<br />
Methods<br />
At eight cat’s claw creeper field sites <strong>of</strong><br />
varying habitat and land-use type in the<br />
Brisbane – Gold Coast region, we sample:<br />
• surface active (epigaeic) and<br />
subterranean soil (hypogaeic) ants<br />
in infested and uninfested areas<br />
spanning both riparian and nonriparian<br />
habitats to investigate<br />
patterns <strong>of</strong> ant species composition<br />
and functional grouping in response<br />
to patch invasion status, landscape<br />
type and habitat stratum<br />
• soil beneath and away from<br />
established cat’s claw creeper patches<br />
(4 samples per site) to document the<br />
likely effect <strong>of</strong> the weed on 23 soil<br />
physicochemical properties<br />
• leaves <strong>of</strong> cat’s claw creeper and<br />
co-occurring native vines (Parsonsia<br />
straminea and Smilax australis)<br />
and introduced but low-impact<br />
vines (corky passionfruit, Passiflora<br />
suberosa) to explore differences in<br />
leaf chemistry between invasive and<br />
non-invasive species.<br />
Collected data is then subjected to<br />
univariate as well as multivariate<br />
ordination techniques.<br />
Progress in 2010–11<br />
Invasion effect on soil ant<br />
assemblage<br />
The epigaeic and subterranean strata<br />
supported markedly different ant<br />
assemblages, and ant communities also<br />
differed between riparian and nonriparian<br />
habitats. However, cat’s claw<br />
creeper invasion had a limited impact.<br />
There was a tendency for ant abundance<br />
and species richness to be lower in<br />
infested patches, and overall species<br />
composition was different between<br />
infested and uninfested patches, but<br />
these differences were relatively small,<br />
and did not occur consistently<br />
across sites.<br />
Our study has shown that ant<br />
communities are surprisingly resilient<br />
to invasion by cat’s claw creeper, and<br />
serves as a warning against making<br />
assumptions about invasion impacts<br />
based on visual appearances. A paper<br />
detailing research findings has been<br />
published in Biological Invasions<br />
(Osunkoya et al. 2011).<br />
Invasion effect on soil<br />
physicochemical properties<br />
A significant site effect was more<br />
frequently observed than an effect due<br />
to invasion status. Nonetheless, after<br />
controlling for site differences, about<br />
50% <strong>of</strong> the 23 soil traits examined<br />
differed significantly between infested<br />
and non-infested soils (Table 23.1).<br />
In soils supporting cat’s claw creeper,<br />
the following were significantly<br />
elevated: moisture, pH, calcium, organic<br />
carbon (OC), total carbon (TC), total<br />
nitrogen (TN) [but not exchangeable<br />
nitrogen in the form <strong>of</strong> ammonium or<br />
nitrate], magnesium, sulfur, chloride<br />
and electrical conductivity (EC).<br />
Exchangeable sodium and iron (which<br />
can be toxic to plant growth if present<br />
in excessive levels) were present at<br />
lower levels (Figure 23.1). These results<br />
indicate that cat’s claw creeper—like<br />
lantana (see <strong>Technical</strong> <strong>highlights</strong><br />
2009–10 and Osunkoya & Perrett 2011)—<br />
can improve soil fertility and influence<br />
nutrient cycling, making the substratum<br />
ideal for its own growth. This might<br />
explain the ability <strong>of</strong> the weed to outcompete<br />
other species, especially<br />
native ones.<br />
Leaf chemistry <strong>of</strong> cat’s claw<br />
creeper v. non-invasive species<br />
As for the soil data, leaf chemistry <strong>of</strong><br />
cat’s claw creeper and non-invasive<br />
species varied more across survey<br />
sites than between invasion status<br />
(Table 23.2). Nonetheless, following<br />
removal <strong>of</strong> the site effect, about 75%<br />
<strong>of</strong> nutrients tested in cat’s claw creeper<br />
were significantly different from<br />
those in low-impact introduced vines.<br />
Cat’s claw creeper leaves possess more<br />
nitrogen, phosphorus, potassium,<br />
aluminium, boron, cadmium, cobalt,<br />
copper, iron and molybdenum but<br />
significantly less calcium, magnesium<br />
and manganese than the other vines.<br />
This trend <strong>of</strong> higher nutrient load<br />
(especially nitrogen, phosphorus and<br />
potassium) for cat’s claw creeper is in<br />
line with invasive plants’ preference<br />
for disturbed habitats commonly<br />
associated with high pulses <strong>of</strong> nutrient<br />
input. Calcium has been implicated in<br />
formation <strong>of</strong> oxalate crystals in leaves<br />
for defence. The significantly lower level<br />
<strong>of</strong> calcium in cat’s claw creeper leaves<br />
despite a higher level <strong>of</strong> this nutrient in<br />
the soil could be due to a reduced level<br />
<strong>of</strong> herbivory from natural enemies in<br />
novel environments lowering the need to<br />
accumulate defence materials.<br />
Part 2 Landscape protection and restoration 51
Table 23.1 Two-way analysis <strong>of</strong> variance (ANOVA) summary results <strong>of</strong> soil physicochemical properties in patches infested with and patches not<br />
infested with cat’s claw creeper across six sites in the Brisbane – Gold Coast region<br />
Summary ANOVA Group mean a (± SE b )<br />
Soil trait Site Invasion Site × invasion Infested Uninfested<br />
Air dry moisture (%) p ≤ 0.001 p ≤ 0.01 NS c 3.16 ± 0.28 2.54 ± 0.23<br />
Soil macronutrients<br />
Organic carbon (%) p ≤ 0.001 p ≤ 0.01 NS 4.09 ± 0.34 3.48 ± 0.28<br />
Total carbon (%) p ≤ 0.001 p ≤ 0.001 NS 4.74 ± 0.36 3.99 ± 0.28<br />
Total nitrogen (%) p ≤ 0.001 p ≤ 0.001 NS 0.35 ± 0.03 0.28 ± 0.02<br />
Exchangeable ions and micronutrients<br />
Nitrate nitrogen (mg kg –1 ) p ≤ 0.001 NS NS 17.71 ± 2.10 15.17 ± 1.30<br />
Nitrate ammonia (mg kg –1 ) p ≤ 0.001 NS p ≤ 0.05 3.10 ± 0.50 3.40 ± 0.59<br />
Phosphorus (mg kg –1 ) p ≤ 0.001 NS NS 29.38 ± 3.77 28.42 ± 5.06<br />
Potassium (meq 100 g –1 ) p ≤ 0.001 NS NS 0.73 ± 0.07 0.62 ± 0.08<br />
Calcium (meg 100 g –1 ) p ≤ 0.001 p ≤ 0.05 NS 15.69 ± 2.04 12.03 ± 1.79<br />
Exchangeable sodium (meq 100 g –1 ) p ≤ 0.001 p ≤ 0.01 NS 0.05 ± 0.01 0.09 ± 0.02<br />
Total sodium (meq 100 g –1 ) p ≤ 0.001 NS NS 0.11 ± 0.02 0.14 ± 0.02<br />
Magnesium (meq 100 g –1 ) p ≤ 0.001 p ≤ 0.10 NS 5.55 ± 0.55 4.74 ± 0.59<br />
Copper (mg kg –1 ) p ≤ 0.001 NS NS 1.29 ± 0.21 1.35 ± 0.23<br />
Iron (mg kg –1 ) p ≤ 0.001 p ≤ 0.10 NS 87.10 ± 10.12 109.64 ± 10.12<br />
Manganese (mg kg –1 ) p ≤ 0.001 NS NS 42.52 ± 7.42 41.46 ± 6.90<br />
Zinc (mg kg –1 ) p ≤ 0.01 NS NS 4.27 ± 1.12 3.47 ± 1.15<br />
Sulfur (mg kg –1 ) p ≤ 0.001 p ≤ 0.10 NS 12.54 ± 1.11 10.62 ± 1.37<br />
Chemical characteristics<br />
pH p ≤ 0.001 p ≤ 0.01 NS 6.23 ± 0.14 5.90 ± 0.14<br />
Electrical conductivity (dS m –1 ) p ≤ 0.001 p ≤ 0.001 NS 0.10 ± 0.01 0.07 ± 0.01<br />
Chloride (mg kg –1 )<br />
Soil texture<br />
p ≤ 0.01 p ≤ 0.01 p ≤ 0.10 24.96 ± 0.78 18.60 ± 2.58<br />
Coarse sand (%) p ≤ 0.001 NS NS 23.83 ± 1.99 24.42 ± 2.41<br />
Fine sand (%) p ≤ 0.001 NS NS 33.96 ± 2.14 35.58 ± 1.84<br />
Silt (%) p ≤ 0.001 NS NS 19.50 ± 1.48 20.08 ± 1.75<br />
Clay (%) p ≤ 0.001 NS NS 25.83 ± 1.68 23.83 ± 1.46<br />
a Group means have been pooled across two habitats (riparian and non-riparian) and six survey sites.<br />
b SE = standard error.<br />
c NS = not significant.<br />
52 <strong>Technical</strong> <strong>highlights</strong>: research projects 2010–11
(S, Mn) Axis II [32%] (pH, P, Mg, K)<br />
4<br />
2<br />
0<br />
–2<br />
–4<br />
Ipswich<br />
Ipswich<br />
Carindale<br />
Boonah<br />
Nerang<br />
Moogerah<br />
Boonah<br />
Moogerah<br />
Nerang<br />
Oxley<br />
Carindale<br />
–6<br />
–6 –4 –2 0 2 4<br />
Axis I [41%] (TN, OC, TC, Ca, Na, EC)<br />
Table 23.2 Two-way ANOVA summary results <strong>of</strong> leaf chemistry in cat’s claw creeper compared to co-occurring introduced non-invasive<br />
(P. suberosa) and native (P. straminea and S. australis) species across six sites in the Brisbane – Gold Coast region<br />
Summary ANOVA Group meana (± SEb )<br />
Leaf trait Site Invasion Site × invasion Invasive Non-invasive<br />
Macronutrients (%)<br />
Total nitrogen p ≤ 0.001 p ≤ 0.001 NSc 2.88 ± 0.01 2.06 ± 0.09<br />
Total phosphorus p ≤ 0.001 p ≤ 0.001 p ≤ 0.001 0.42 ± 0.03 0.26 ± 0.02<br />
Potassium p ≤ 0.001 p ≤ 0.01 NS 2.45 ± 0.12 1.82 ± 0.11<br />
Calcium NS p ≤ 0.01 p ≤ 0.05 1.65 ± 0.09 2.45 ± 0.24<br />
Magnesium NS p ≤ 0.001 NS 0.26 ± 0.02 0.59 ± 0.07<br />
Sodium p ≤ 0.001 NS p ≤ 0.01 0.04 ± 0.01 0.06 ± 0.01<br />
Sulphur<br />
Micronutrients (mg kg<br />
p ≤ 0.01 NS NS 0.19 ± 0.02 0.23 ± 0.02<br />
–1 )<br />
Aluminium p ≤ 0.05 p ≤ 0.05 NS 82.38 ± 9.62 56.20 ± 9.28<br />
Boron NS p ≤ 0.001 p ≤ 0.05 80.72 ± 4.55 40.41 ± 3.09<br />
Cadmium p ≤ 0.001 p ≤ 0.01 NS 0.04 ± 0.01 0.02 ± 0.01<br />
Cobalt p ≤ 0.001 p ≤ 0.001 p ≤ 0.001 0.26 ± 0.02 0.16 ± 0.02<br />
Copper p ≤ 0.001 p ≤ 0.05 p ≤ 0.01 17.14 ± 1.62 13.47 ± 1.23<br />
Iron p ≤ 0.001 p ≤ 0.001 NS 114.82 ± 11.38 75.86 ± 9.80<br />
Manganese p ≤ 0.001 p ≤ 0.001 p ≤ 0.001 70.79 ± 80.5 186.21 ± 69.78<br />
Molybdenum p ≤ 0.001 p ≤ 0.001 p ≤ 0.001 1.56 ± 0.11 0.28 ± 0.09<br />
Lead NS NS NS 0.54 ± 0.02 0.54 ± 0.03<br />
Zinc NS NS NS 33.74 ± 1.91 37.57 ± 2.65<br />
a Group means have been pooled across two habitats (riparian and non-riparian) and six survey sites.<br />
b SE = standard error.<br />
c NS = not significant.<br />
Oxley<br />
Soil condition<br />
uninfested<br />
infested<br />
Figure 23.1 Ordination <strong>of</strong> soils underneath (closed symbols) and away from (open symbols) cat’s claw creeper patches across six sites <strong>of</strong> varying<br />
land use: arrows indicate direction and magnitude <strong>of</strong> soil traits driving each axis; percentages refer to data variation captured by each axis<br />
Part 2 Landscape protection and restoration 53
Ordination indicated that axes I–III<br />
(with 25%, 22% and 16% explanatory<br />
power, respectively) are needed to<br />
explain differences in leaf chemistry <strong>of</strong><br />
the investigated species (Figure 23.2).<br />
However, the major difference between<br />
cat’s claw creeper and other vines lies<br />
in the combination <strong>of</strong> axes II and III.<br />
Phosphorus and molybdenum (on axis<br />
II) and nitrogen, potassium, aluminium,<br />
copper, iron and cobalt ions (on axis<br />
III) were the major driver variables.<br />
Interestingly, leaf chemistry <strong>of</strong> the<br />
native P. straminea is the closest to cat’s<br />
claw creeper <strong>of</strong> all non-invasive species<br />
tested, confirming the <strong>of</strong>ten-observed<br />
overabundance <strong>of</strong> this native vine in<br />
remnant vegetation and the notion that the<br />
species has to be managed in its own right.<br />
Funding in 2010–11<br />
Queensland Government<br />
Collaborators<br />
• Dr Tanya Scharaschkin (Queensland<br />
University <strong>of</strong> Technology, Science and<br />
Engineering Faculty)<br />
• Dr Alan Andersen (CSIRO Ecosystem<br />
Sciences, Darwin)<br />
Axis III [16%] ( N, K, Al, Cu, Fe, Co)<br />
4<br />
2<br />
0<br />
–2<br />
–4<br />
–6<br />
–4<br />
–2<br />
More information<br />
Key publications<br />
Axis I [25%] (Ca, Mg, Na, S, Zn)<br />
Osunkoya, OO, Polo, C & Andersen, AN<br />
2011, ‘Invasion impacts on biodiversity:<br />
responses <strong>of</strong> ant communities to<br />
infestation by cat’s claw creeper,<br />
Macfadyena unguis-cati (Bignoniaceae)<br />
in subtropical Australia’, Biological<br />
Invasions 13(10): 2289–302.<br />
Osunkoya, OO & Perrett, C 2011,<br />
‘Lantana camara L. (Verbenaceae)<br />
invasion effects on soil physicochemical<br />
properties’, Biology and Fertility <strong>of</strong> Soils<br />
47(3): 349–55.<br />
0 0<br />
2 –2<br />
Axis II [22%] (P, Mo)<br />
Species<br />
cat’s claw creeper<br />
P. suberosa<br />
P. straminea<br />
S. australis<br />
Osunkoya, OO, Pyle, K, Scharaschkin, T<br />
& Dhileepan, K 2009, ‘What lies<br />
beneath? The pattern and abundance<br />
<strong>of</strong> the subterranean tuber bank <strong>of</strong><br />
the invasive liana cat’s claw creeper,<br />
Macfadyena unguis-cati (Bignoniaceae)’,<br />
Australian Journal <strong>of</strong> Botany 57(2):<br />
132–8.<br />
For further information on this research<br />
project and access to key publications,<br />
visit the invasive plant and animal science<br />
pages on the Biosecurity Queensland<br />
website at www.biosecurity.qld.gov.au<br />
54 <strong>Technical</strong> <strong>highlights</strong>: research projects 2010–11<br />
4<br />
Figure 23.2 Ordination on three principal axes <strong>of</strong> leaf chemistry in cat’s claw creeper and<br />
co-occurring introduced non-invasive (P. suberosa) and native (P. straminea and S. australis)<br />
species: each data point represents a single plant; arrows indicate direction and magnitude <strong>of</strong><br />
leaf traits driving each axis; percentages refer to data variation captured by each axis<br />
–4<br />
2<br />
4<br />
6
24. Cabomba (Cabomba caroliniana) ecology<br />
Project dates<br />
October 2010 – July 2012<br />
Project leader<br />
Dr Tobias Bickel<br />
Ecosciences Precinct<br />
Tel: (07) 3255 4476<br />
Email: tobias.bickel@deedi.qld.gov.au<br />
Other staff in 2010–11<br />
Cameron Clark<br />
Objectives<br />
• Research the ecological habitat<br />
requirements and competitiveness <strong>of</strong><br />
cabomba.<br />
• Investigate the regeneration ability<br />
and establishment <strong>of</strong> cabomba<br />
fragments to predict dispersal.<br />
Rationale<br />
Cabomba (Cabomba caroliniana) is a<br />
submerged aquatic weed originating from<br />
South America. It is a popular aquarium<br />
species and was introduced to the wild<br />
worldwide through intentional propagation<br />
for the aquatic plant trade and disposal <strong>of</strong><br />
surplus aquarium material. Today, it is a<br />
serious aquatic weed in many countries,<br />
including Australia, the United States<br />
and China. Cabomba was first recorded in<br />
Australia in 1967 and is today naturalised<br />
in several states. It is a WONS and a<br />
Class 2 declared weed in Queensland.<br />
Even though cultivation and sale <strong>of</strong><br />
cabomba is now prohibited, the plant is<br />
increasing its range and could potentially<br />
establish in large parts <strong>of</strong> Australia with<br />
suitable habitat. Cabomba predominantly<br />
reproduces through vegetative propagules<br />
(stem fragments); viable seeds have so far<br />
been observed only in Northern Territory<br />
populations. Cabomba readily spreads<br />
within catchments through the movement<br />
<strong>of</strong> fragments via water currents,<br />
particularly in floodwaters. However,<br />
humans are the main vector for dispersal<br />
between waterbodies, mainly through<br />
boating and fishing activities (fouling <strong>of</strong><br />
fragments in equipment).<br />
Once established, cabomba has serious<br />
environmental and economic impacts<br />
and is difficult to control due to limited<br />
availability <strong>of</strong> effective control options.<br />
While there is general knowledge in<br />
aquarium literature about culturing<br />
conditions for cabomba, there is little<br />
scientific data available about the<br />
ecology <strong>of</strong> cabomba, both from its native<br />
and introduced range.<br />
Such knowledge is necessary to predict<br />
in which habitats cabomba is likely to<br />
establish. This will allow concentrated<br />
monitoring in areas deemed high risk,<br />
and therefore will improve the likelihood<br />
<strong>of</strong> detecting cabomba infestations in<br />
early stages, when successful removal<br />
is viable. A better understanding <strong>of</strong><br />
cabomba ecology is also crucial for<br />
mitigating ecological and economic<br />
impacts <strong>of</strong> this serious pest.<br />
Methods<br />
Cabomba regeneration—<br />
nutrients in solution<br />
Cabomba fragments (each consisting<br />
<strong>of</strong> a stem piece with a single node and<br />
one leaf pair) are incubated in shallow<br />
plastic containers filled with culture<br />
solution. There are five treatments<br />
(five replicates each): no nutrients,<br />
trace elements only, low nutrients<br />
(0.5 mg nitrogen L –1 ), medium nutrients<br />
(1 mg nitrogen L –1 ) and high nutrients<br />
(5 mg nitrogen L –1 ).<br />
These nutrient concentrations are<br />
representative <strong>of</strong> trophic statuses <strong>of</strong><br />
freshwater systems: ultra-oligotrophic<br />
(trace elements only), oligotrophic (low<br />
nutrients), mesotrophic (medium nutrients)<br />
and eutrophic (high nutrients). We inspect<br />
fragments weekly and assess the number<br />
<strong>of</strong> regenerating fragments (new shoot<br />
development from nodes).<br />
Regeneration (%)<br />
70<br />
60<br />
50<br />
40<br />
30<br />
20<br />
10<br />
no nutrients<br />
trace elements only<br />
low nutrients<br />
medium nutrients<br />
high nutrients<br />
Cabomba establishment—<br />
substrate types<br />
We establish 16 outdoor mesocosms<br />
(each 800 L) with a 10 cm substrate<br />
layer comprising a lower 5 cm layer <strong>of</strong><br />
substrate mixed with topsoil and an upper<br />
5 cm layer <strong>of</strong> clean substrate to prevent<br />
nutrient leaching. There are four substrate<br />
treatments (four replicates each): sand<br />
(< 0.5 mm), fine gravel (< 5 mm), coarse<br />
gravel (< 20 mm) and cobbles (> 100 mm).<br />
The tanks are filled with rainwater and<br />
seeded with 75 g wet mass <strong>of</strong> cabomba<br />
material consisting <strong>of</strong> approximately 100<br />
stem fragments (a mix <strong>of</strong> single-node<br />
fragments and longer stem pieces). After<br />
8 months we drain the mesocosms and<br />
measure the total cabomba wet mass and<br />
stem density. Water quality is monitored<br />
throughout the experiment.<br />
Cabomba regeneration—<br />
substrate quality and pH<br />
Four 100 L aquariums are filled with a<br />
mixture <strong>of</strong> tap water and distilled water<br />
in the laboratory and trace elements and<br />
micronutrients are added. In three tanks,<br />
we adjust the pH through CO 2 injection<br />
to pH 6.5, 7.0 and 8.0; the fourth tank<br />
does not receive added CO 2 and varies in<br />
pH from 7.5 to 8.0. In each tank we plant<br />
10 cm long apical cabomba shoots in little<br />
pots filled with four different mixtures <strong>of</strong><br />
sand and topsoil: sand only, 25% topsoil,<br />
50% topsoil and 100% topsoil. There are<br />
three pots <strong>of</strong> each substrate quality per<br />
tank. Shoot growth and establishment<br />
<strong>of</strong> new shoots is then monitored over<br />
6 weeks, after which we harvest all<br />
cabomba and measure the dry mass <strong>of</strong><br />
shoots and roots.<br />
0<br />
0 1 2 3 4 5 6 7 8 9 10<br />
Weeks after fragmentation<br />
Figure 24.1 Regeneration <strong>of</strong> cabomba fragments (see Photo 24.2) as affected by nutrient availability<br />
Part 2 Landscape protection and restoration 55
Progress in 2010–11<br />
Cabomba regeneration—<br />
nutrients in solution<br />
Cabomba regenerated readily from<br />
single-node fragments, independent<br />
<strong>of</strong> nutrient availability in the culture<br />
solution (Figure 24.1 and Photo 24.1).<br />
Only 4 weeks after fragmentation,<br />
about 50% <strong>of</strong> all fragments grew<br />
new shoots. Towards the end <strong>of</strong> the<br />
experiment, there was a decrease in<br />
cabomba health in the high and medium<br />
nutrient concentrations due to excessive<br />
algal growth. Overall this means that<br />
cabomba does not depend on nutrients<br />
available in the water to regenerate,<br />
but is probably able to use internally<br />
stored nutrients for initial growth.<br />
Consequently, cabomba would be able<br />
to establish from single-node fragments<br />
even in habitats with low nutrient<br />
availability (oligotrophic systems).<br />
Cabomba establishment—<br />
substrate types<br />
The experiment was conducted from<br />
March to December 2010. There was a<br />
pronounced difference between cabomba<br />
establishment in the mesocosms with<br />
different substrate types. Cabomba<br />
clearly prefers fine substrates (sand)<br />
and did not establish well even in fairly<br />
fine gravel (Figure 24.2). However, there<br />
was a fairly high variability in cabomba<br />
establishment, even within the same<br />
substrate treatment, indicating that other<br />
factors are also important. Nevertheless,<br />
while two <strong>of</strong> the sand mesocosms were<br />
completely filled with cabomba after<br />
8 months (Photo 24.2), there was very<br />
little establishment <strong>of</strong> shoots in other<br />
substrate types. This clearly shows that<br />
cabomba establishment is limited to<br />
suitable substrates.<br />
Photo 24.1 Cabomba fragments<br />
Shoot wet mass (g m –2 )<br />
1200<br />
1000<br />
800<br />
600<br />
400<br />
200<br />
0<br />
sand fine gravel coarse gravel cobble<br />
Substrate type<br />
standard deviation<br />
Figure 24.2 Cabomba establishment and growth, measured as shoot wet mass, as affected by<br />
substrate type<br />
Photo 24.2 A fine sand mesocosm with strong cabomba growth after 8 months<br />
56 <strong>Technical</strong> <strong>highlights</strong>: research projects 2010–11
Cabomba regeneration—<br />
substrate quality and pH<br />
Cabomba fragments grew best in<br />
substrates with a low organic content,<br />
but also did well in substrates with a<br />
large proportion <strong>of</strong> topsoil (Figure 24.3).<br />
The sand-only treatment, which<br />
lacked organic content, was the only<br />
substrate that did not support good<br />
cabomba growth. However, growth in<br />
substrates was also influenced by the<br />
pH (Figure 24.3 and Photo 24.3). The<br />
best growth was achieved at pH 6.5 in<br />
the substrate with 25% topsoil. This<br />
shows that cabomba prefers slightly<br />
acidic conditions and the pH <strong>of</strong> the<br />
water is an overriding factor in overall<br />
growth performance. This experiment<br />
also indicates that cabomba depends<br />
upon organic content in the substrate<br />
for healthy growth. One possible reason<br />
for this could be that cabomba might<br />
not be able to take up all its nutrient<br />
requirements from water alone, but also<br />
depends on nutrient supply through the<br />
substrate.<br />
Conclusions<br />
Cabomba is able to regenerate successfully<br />
even from single-node fragments. After<br />
only 4 weeks, up to 50% <strong>of</strong> all propagules<br />
produced new shoots. Regeneration does not<br />
appear to depend on nutrient concentrations<br />
in the water. The pH <strong>of</strong> the water seems<br />
to be an overall limiting factor, with the<br />
plant preferring water that is slightly acidic.<br />
Cabomba appears to be able to establish<br />
even in nutrient-poor waters as long as<br />
nutrients are available in the substrate.<br />
Funding in 2010–11<br />
Land Protection Fund ($120 000)<br />
Average shoot dry mass (g)<br />
0.6<br />
0.5<br />
0.4<br />
0.3<br />
0.2<br />
0.1<br />
0<br />
Collaborators<br />
all pH treatments<br />
pH 6.5<br />
pH 7<br />
pH 8<br />
pH variable<br />
standard deviation<br />
0 25 50 100<br />
Substrate quality (percentage topsoil)<br />
Figure 24.3 Cabomba establishment and growth, measured as shoot dry mass, as affected by<br />
substrate quality and pH <strong>of</strong> the water<br />
Photo 24.3 Cabomba shoots growing in an experimental aquarium to investigate the<br />
influence <strong>of</strong> substrate quality on growth<br />
• Brisbane City Council<br />
• CSIRO<br />
• Seqwater<br />
• National Aquatic Weed Management<br />
Group<br />
• Noosa and District Landcare<br />
• <strong>Department</strong> <strong>of</strong> <strong>Primary</strong> <strong>Industries</strong>,<br />
Victoria<br />
More information<br />
For further information on this<br />
research project, visit the invasive<br />
plant and animal science pages on the<br />
Biosecurity Queensland website at<br />
www.biosecurity.qld.gov.au<br />
Part 2 Landscape protection and restoration 57
Part 3 Pest animal management<br />
25. Livestock guardian dog/wild dog (Canis lupus familiaris and C. l. dingo) interaction study<br />
Project dates<br />
May 2009 – December 2011<br />
Project leader<br />
Dr Lee Allen<br />
Robert Wicks Pest Animal Research<br />
Centre<br />
Tel: (07) 4688 1397<br />
Email: lee.allen@deedi.qld.gov.au<br />
Objectives<br />
• Investigate the spatial and temporal<br />
movements <strong>of</strong> guardian dogs in<br />
relation to sheep and adjacent wild<br />
dogs, in particular the degree to<br />
which guardian dogs and wild dogs<br />
intermix.<br />
• Evaluate mesopredator and native<br />
wildlife responses to the presence <strong>of</strong><br />
livestock guardian dogs.<br />
• Assess whether there is any<br />
interbreeding between guardian dogs<br />
and wild dogs.<br />
• Develop and disseminate<br />
recommendations for best practice<br />
guardian dog management.<br />
Rationale<br />
Wild dogs (Canis lupus familiaris and<br />
C. l. dingo) include dingoes as well as<br />
hybrids <strong>of</strong> dingoes and domestic dogs. It<br />
is believed that they deliver biodiversity<br />
benefits by suppressing mesopredators<br />
(foxes and feral cats) and preying on<br />
overabundant large macropod species.<br />
However, they are also a threat to sheep<br />
and goat production—past satellite<br />
tracking <strong>of</strong> wild dogs shows that 25%<br />
<strong>of</strong> males disperse more than 100 km<br />
and up to 500 km from their natal<br />
areas. The frequency and magnitude <strong>of</strong><br />
these movements make it unrealistic to<br />
establish buffers to protect sheep and<br />
goat producers from livestock predation.<br />
Livestock guardian dogs can be<br />
considered ‘placebo wild dogs’ in a<br />
sheep production environment. The<br />
initial study site, Dunluce Station, near<br />
Hughenden, runs 20 000 sheep with<br />
minimal annual predation loss, yet is<br />
surrounded by beef cattle properties<br />
with known wild dog populations and<br />
predation losses. Prior to using guardian<br />
dogs in 2001, land managers regularly<br />
baited with 1080 (sodium fluoroacetate)<br />
and shot wild dogs, yet suffered 15%<br />
annual loss <strong>of</strong> sheep to wild dog attacks.<br />
Given such apparent benefits, guardian<br />
animals could prove to be a future<br />
management imperative for protecting<br />
sheep and goats from the ingress <strong>of</strong><br />
dispersing wild dogs. Although guardian<br />
dogs are increasingly used by graziers,<br />
there is currently very little known about<br />
how guardian dogs ‘work’ in Australia—<br />
particularly in extensive grazing<br />
systems—and even less about their<br />
night-time movements and interaction<br />
with wild dogs. Anecdotal accounts<br />
suggest some guardian dogs are effective<br />
at preventing wild dogs from attacking<br />
livestock, while others have been seen<br />
associating with wild dog packs.<br />
A critical management concern is the<br />
potential for guardian dogs to interbreed<br />
with wild dogs, producing larger, more<br />
aggressive and destructive hybrids. In this<br />
study, we investigate interbreeding on<br />
two properties with different approaches<br />
to the management <strong>of</strong> guardian dogs.<br />
On Dunluce Station, all working dogs<br />
are desexed according to best practice<br />
guidelines. On the second study site—<br />
Stratford Station, a beef cattle property<br />
south <strong>of</strong> Jericho in central western<br />
Queensland—guardian dogs are not<br />
desexed, are not bonded to the cattle and<br />
return to the homestead each morning.<br />
Methods<br />
Spatial and temporal movements<br />
We place global positioning system<br />
(GPS) collars on maremma guardian<br />
dogs to record half-hourly locations for<br />
over 12 months (downloaded quarterly),<br />
monitoring their daily movement<br />
patterns and annual seasonal changes in<br />
activity. We are particularly interested<br />
in activity pattern differences between<br />
individual guardian dogs in relation to<br />
their gender and social status (as seen<br />
in wild dogs and reported by guardian<br />
dog owners) and how sheep paddocks<br />
and adjacent paddocks are patrolled.<br />
Concurrently, we capture wild dogs<br />
in adjoining paddocks (< 5 km from<br />
sheep) and fit them with GPS/Argos<br />
transmitters recording hourly locations.<br />
We overlay GPS location data for wild<br />
dogs and maremmas on satellite imagery<br />
<strong>of</strong> the properties using geographical<br />
information systems to identify any<br />
overlap <strong>of</strong> movements and territory<br />
boundaries. If any overlap exists, we<br />
investigate the temporal relationships<br />
between guardian dogs and wild dogs.<br />
Interbreeding<br />
DNA is collected from tissue samples<br />
or blood at the time <strong>of</strong> collaring and<br />
from dogs shot or trapped locally. It<br />
is analysed for genetic evidence <strong>of</strong><br />
interbreeding.<br />
Biodiversity impacts<br />
Simultaneously, we monitor the activity<br />
(a measure <strong>of</strong> relative abundance)<br />
<strong>of</strong> wild dogs, guardian dogs (much<br />
greater foot length), macropods, foxes<br />
and feral cats within and outside<br />
the protected paddocks from spoors<br />
at tracking stations, using activity<br />
index methodology (Allen et al. 1996).<br />
Tracking stations 1 km apart are<br />
monitored for three consecutive days.<br />
Progress in 2010–11<br />
Spatial and temporal movements<br />
We monitored half-hourly locations <strong>of</strong><br />
eight maremmas and hourly locations<br />
<strong>of</strong> six wild dogs on Dunluce Station for<br />
six months. Collars were recovered and<br />
downloaded in October 2010. For five <strong>of</strong><br />
the six wild dogs, 864 hourly locations<br />
were recorded within the sheep paddocks<br />
or adjacent paddocks where one or more<br />
guardian dogs patrolled (Figure 25.1).<br />
While many wild dog forays into sheep<br />
paddocks occurred overnight (twice as<br />
many night-time locations as day-time<br />
locations), and came from refuge areas<br />
on the Flinders River 20 km away, some<br />
stayed in the open grazing paddocks for<br />
up to two days (Figure 25.2).<br />
During these intrusions, guardian<br />
dogs appeared to remain more or less<br />
stationary, closely associated with the<br />
sheep, and showed no obvious pursuit<br />
<strong>of</strong> wild dogs. At times wild dogs circled<br />
the maremma locations or camped<br />
during the middle <strong>of</strong> the day in paddocks<br />
containing sheep, yet remarkably no<br />
sheep were attacked (Figure 25.3).<br />
58 <strong>Technical</strong> <strong>highlights</strong>: research projects 2010–11
Figure 25.1 Wild dog GPS locations—up to 20% were in sheep paddocks or adjacent paddocks patrolled by maremmas<br />
Figure 25.2 Wild dog forays <strong>of</strong> more than 20 km from refuge areas on the Flinders River to sheep paddocks<br />
Part 3 Pest animal management 59
Figure 25.3 Locations <strong>of</strong> five maremmas (highlighted in pink) when a wild dog foraged in their<br />
sheep paddock<br />
Interbreeding<br />
DNA analysis <strong>of</strong> blood samples taken<br />
from wild dogs showed no evidence <strong>of</strong><br />
interbreeding between maremmas and<br />
wild dogs on Dunluce Station. However,<br />
all working maremmas on Dunluce<br />
Station are desexed or treated to prevent<br />
interbreeding.<br />
Biodiversity impacts<br />
The activity <strong>of</strong> rodents and birds (likely<br />
prey for feral cats and foxes) was similar<br />
for both sheep and cattle paddocks and<br />
was independent <strong>of</strong> the activity <strong>of</strong> foxes,<br />
maremmas and wild dogs. Fox and wild<br />
dog activity fluctuated between surveys,<br />
but these animals were mostly detected<br />
in the sheep–maremma paddocks rather<br />
than the cattle paddocks. No wild dogs<br />
were detected during the July survey<br />
(at whelping), yet tracking showed they<br />
were still making incursions into the<br />
area at this time.<br />
In April 2011, we captured and collared<br />
eight wild dogs and six maremmas<br />
on Stratford Station. We will conduct<br />
wildlife surveys and DNA analysis <strong>of</strong><br />
wild dogs similar to those on Dunluce<br />
Station.<br />
60 <strong>Technical</strong> <strong>highlights</strong>: research projects 2010–11
Activity index <strong>of</strong> abundance<br />
Activity index <strong>of</strong> abundance<br />
(a)<br />
0.16<br />
0.14<br />
0.12<br />
0.10<br />
0.08<br />
0.06<br />
0.04<br />
0.02<br />
0.00<br />
(b)<br />
2.00<br />
1.80<br />
1.60<br />
1.40<br />
1.20<br />
1.00<br />
0.80<br />
0.60<br />
0.40<br />
0.20<br />
0.00<br />
Funding in 2010–11<br />
• Australian Pest Animal Research<br />
Program, Australian Government<br />
<strong>Department</strong> <strong>of</strong> Agriculture, Fisheries<br />
and Forestry (DAFF) ($30 000)<br />
• Queensland Government<br />
Collaborators<br />
April July October April July October<br />
Cattle paddocks Sheep–maremma paddocks<br />
Paddock type and survey date<br />
April July October April July October<br />
Cattle paddocks<br />
Sheep–maremma paddocks<br />
Paddock type and survey date<br />
• Ninian Stewart-Moore (Dunluce owner,<br />
Leading Sheep North and Central West<br />
regional committee member)<br />
• Robyn and Terry Brennan (Stratford<br />
Station owners, Desert Channels<br />
Queensland)<br />
dingoes<br />
foxes<br />
cats<br />
maremmas<br />
macropods<br />
rodents<br />
bustards<br />
other birds<br />
Figure 25.4 The activity <strong>of</strong> (a) predators and (b) wildlife at Dunluce Station in the sheep–<br />
maremma paddocks compared to the cattle-only paddocks as detected during surveys in April,<br />
July and October 2010<br />
More information<br />
Key publication<br />
Allen, L & Byrne, D 2011, ‘How do<br />
guardian dogs “work”?’, in G Saunders<br />
& C Lane (eds), Proceedings <strong>of</strong> the 15th<br />
Australasian Vertebrate Pest Conference,<br />
Invasive Animals Cooperative Research<br />
Centre, Sydney, p.158.<br />
For further information on this research<br />
project and access to key publications,<br />
visit the invasive plant and animal science<br />
pages on the Biosecurity Queensland<br />
website at www.biosecurity.qld.gov.au<br />
Part 3 Pest animal management 61
26. Assessing the role <strong>of</strong> harvesting in feral pig (Sus scr<strong>of</strong>a) management<br />
Project dates<br />
January 2007 – December 2010<br />
(completed)<br />
Project leader<br />
Dr Matt Gentle<br />
Robert Wicks Pest Animal Research Centre<br />
Tel: (07) 4688 1033<br />
Email: matthew.gentle@deedi.qld.gov.au<br />
Other staff in 2010–11<br />
James Speed and David Aster<br />
Objectives<br />
• Survey landholders in the western<br />
Darling Downs to determine the<br />
distribution <strong>of</strong> pig damage, its<br />
perceived cost and the control<br />
methods employed.<br />
• Estimate the density–impact<br />
relationship for pigs damaging grain<br />
crops.<br />
• Quantify the effectiveness <strong>of</strong><br />
commercial and recreational<br />
harvesting for managing feral pig<br />
populations.<br />
Rationale<br />
Pest managers <strong>of</strong>ten encourage<br />
commercial and recreational harvesting<br />
<strong>of</strong> feral pigs (Sus scr<strong>of</strong>a) because this is<br />
considered essentially a ‘free’ reduction<br />
in pest density. However, little is known<br />
about the effectiveness <strong>of</strong> such an<br />
approach in managing pig populations.<br />
Also, it is questionable whether Australian<br />
governments should remain passive<br />
observers in the commercial use <strong>of</strong> pest<br />
animals or pursue markets more actively<br />
and subsidise harvests in unpr<strong>of</strong>itable<br />
areas or at unpr<strong>of</strong>itable times.<br />
This project is a critical component <strong>of</strong><br />
an ongoing program by the Queensland<br />
Murray–Darling Committee (QMDC)<br />
to coordinate the control <strong>of</strong> feral pigs,<br />
foxes and feral cats in the region. By<br />
evaluating the impacts <strong>of</strong> commercial<br />
and recreational pig harvesting<br />
compared to a coordinated control<br />
program, particularly in relation to crop<br />
damage, the project helps determine<br />
the optimum mix <strong>of</strong> harvesting and<br />
conventional control (i.e. baiting)<br />
and guides decision-making by<br />
pest managers.<br />
Methods<br />
We survey landholders throughout the<br />
QMDC area (the Border Rivers Maranoa–<br />
Balonne Natural Resource Management<br />
Region) using a combination <strong>of</strong><br />
telephone and postal surveys. In addition<br />
to identifying hot spots <strong>of</strong> damage and<br />
areas with little control, the survey<br />
facilitates the selection <strong>of</strong> study sites for<br />
more intensive assessments <strong>of</strong> damage<br />
and density. Importantly, these surveys<br />
also raise awareness <strong>of</strong> the project<br />
throughout the rural community.<br />
On six study sites, which encompass<br />
a range <strong>of</strong> pig densities, we then<br />
estimate both pig density and<br />
lost grain production using a<br />
combination <strong>of</strong> helicopter surveys<br />
and ground assessments. Study sites<br />
are predominantly grain-cropping<br />
properties, which are monitored<br />
twice during the maturation <strong>of</strong> the<br />
crop—early (post-emergence) and at<br />
harvest. The aerial pig-density surveys<br />
are conducted using a four-seater<br />
helicopter (Robinson-44 TM ) flying along<br />
predetermined transects through each<br />
study area.<br />
We assess pig damage by estimating<br />
the density <strong>of</strong> damage patches through<br />
line transect techniques and visually<br />
estimating the level <strong>of</strong> damage by<br />
comparing the yield within each<br />
damaged patch to the yield in an<br />
adjacent, undamaged crop area.<br />
To monitor feral pig harvesting,<br />
we collate data from five wild-boar<br />
processing companies on the number <strong>of</strong><br />
pigs harvested locally from our study<br />
sites and regionally across Queensland.<br />
Processing companies record the<br />
number <strong>of</strong> pigs harvested from each<br />
<strong>of</strong> the 215 field chiller locations<br />
throughout Queensland, which allows an<br />
investigation <strong>of</strong> the spatial patterns in<br />
harvesting. We also collate aerial survey<br />
data collected as part <strong>of</strong> the annual<br />
macropod monitoring program (courtesy<br />
<strong>of</strong> DERM) to calculate feral pig densities<br />
at each <strong>of</strong> the Queensland survey blocks.<br />
We can then compare densities with<br />
the numbers harvested to estimate<br />
harvest rates across survey blocks. This<br />
requires the cooperation <strong>of</strong> individual<br />
harvesters, the game industry and Safe<br />
Food Queensland. We also monitor other<br />
control activities undertaken at each site<br />
through discussions with landholders.<br />
This research is conducted under an<br />
animal ethics permit, CA 2007/09/211.<br />
Findings<br />
Pig damage is common throughout<br />
the QMDC area, with 63% <strong>of</strong> survey<br />
respondents reporting losses.<br />
Commodities reported as damaged<br />
include cereals, vegetables, legume<br />
crops, and lambs (by predation). Cereal<br />
crops in particular suffered considerable<br />
damage; these included sorghum (8.3%),<br />
wheat (3.3%) and barley (13.4%).<br />
Lamb predation was also high (16.1%).<br />
However, damage figures calculated<br />
from field assessments (sorghum 1.3%<br />
and wheat < 0.4%) appear low relative<br />
to both landholder perceptions and<br />
previous studies. Caley (1993) reported<br />
40% damage to sorghum crops and<br />
Pavlov (1980) found 4–7% damage<br />
in wheat crops. These results may<br />
reflect seasonal conditions at study<br />
sites or pig densities at the time <strong>of</strong><br />
assessments. Nevertheless, assuming<br />
that the conservative field estimates<br />
are representative <strong>of</strong> feral pig damage<br />
throughout the QMDC area, the mean<br />
annual loss per sorghum producer is<br />
$843 and per wheat producer is $448.<br />
Awareness <strong>of</strong> this impact will help to<br />
justify and promote feral pig control<br />
measures.<br />
Results from aerial surveys on the<br />
study sites (conducted from November<br />
2007 to April 2010) and the macropod<br />
monitoring program (conducted<br />
annually from 1991 to 2010) demonstrate<br />
that feral pig populations are both<br />
widespread and persistent throughout<br />
Queensland, reaching high densities<br />
when conditions are favourable.<br />
Populations in the QMDC area can<br />
reach high densities—4.4 pigs km –2 were<br />
recorded at Southwood in March 2008<br />
(Figure 26.1) and historical records show<br />
densities <strong>of</strong> 6.3 pigs km –2 at Westmar in<br />
1999. Predominant land management<br />
practices in the region <strong>of</strong>fer fragmented<br />
landscapes with vast cropping and<br />
grazing areas, natural watercourses and<br />
stock waters, which provide pigs access<br />
to water, shelter and sufficient food to<br />
maintain relatively high densities.<br />
62 <strong>Technical</strong> <strong>highlights</strong>: research projects 2010–11
Feral pigs have long been established<br />
throughout the region and should<br />
have reached a long-term equilibrium<br />
abundance. This equilibrium is dynamic<br />
and is best considered as an average<br />
density around which the population<br />
fluctuates, but with no long-term trend.<br />
The survey data provides additional<br />
empirical evidence that the density <strong>of</strong><br />
feral pigs is not constant but fluctuates<br />
from year to year, most likely as<br />
determined by environmental influences.<br />
Density (pigs km –2 )<br />
5<br />
4<br />
3<br />
2<br />
1<br />
0<br />
Oct. Jan.<br />
2007<br />
2008<br />
Survey date<br />
In an effort to reduce abundance<br />
and associated damage, landholders<br />
commonly control feral pig populations<br />
through poisoning, trapping and<br />
harvesting. However, to maintain<br />
reduced densities <strong>of</strong> feral pigs, higher<br />
rates <strong>of</strong> population growth following<br />
control must be stopped. On all QMDC<br />
study sites, regardless <strong>of</strong> harvesting and<br />
control activities, the rate <strong>of</strong> population<br />
growth was not significantly different<br />
from zero, indicating that populations<br />
were stable—although fluctuating—<br />
during the course <strong>of</strong> the study. There<br />
was no clear decline in abundance.<br />
Control activities had, at best, been able<br />
to suppress growth.<br />
Crowders Creek Kindon<br />
Minnel Nindigully<br />
Southwood Talwood<br />
Apr. July Oct. Jan. Apr. July Oct. Jan. Apr.<br />
2009 2010<br />
Figure 26.1 Feral pig density on the six study sites, calculated from aerial surveys<br />
Harvest rate (%)<br />
100<br />
90<br />
80<br />
70<br />
60<br />
50<br />
40<br />
30<br />
20<br />
10<br />
0<br />
0 0.2 0.4 0.6 0.8 1.0 1.2 1.4 1.6<br />
Density (pigs km –2 )<br />
The ineffectiveness <strong>of</strong> commercial<br />
harvesting is not surprising, considering<br />
the low harvest rates relative to the<br />
maximum rate <strong>of</strong> population growth<br />
(r max ) that can be achieved under ideal<br />
environmental conditions. For a feral<br />
pig population growing at r max , between<br />
60 and 70% <strong>of</strong> the population needs<br />
to be removed each year to keep it<br />
stable. Harvest rates only occasionally<br />
exceeded r max and such occurrences were<br />
not maintained across sites and years<br />
(Figure 26.2). Moreover, harvest rates<br />
were elevated only at low densities. This<br />
indicates that while harvest rates may<br />
be sufficiently high to hold populations<br />
at low densities, the population is likely<br />
to recover following an increase in food<br />
supply or a reduction in harvest effort.<br />
References<br />
Caley, P 1993, The ecology and<br />
management <strong>of</strong> feral pigs in the wet-dry<br />
tropics <strong>of</strong> the Northern Territory, MAppSc<br />
Thesis, University <strong>of</strong> Canberra, Canberra.<br />
Pavlov, PM 1980, The diet and general<br />
ecology <strong>of</strong> the feral pig (Sus scr<strong>of</strong>a) at<br />
Girilambone, NSW, MSc Thesis, Monash<br />
University, Melbourne.<br />
Funding in 2010–11<br />
• QMDC ($51 000)<br />
• Queensland Government<br />
Collaborators<br />
• QMDC<br />
• Safe Food Queensland<br />
• Australian Quarantine and Inspection<br />
Service<br />
• Game and meat processors<br />
More information<br />
Key publication<br />
Gentle, M, Pople, T, Speed, J & Aster, D<br />
2011, Assessing the role <strong>of</strong> harvesting<br />
in feral pig (Sus scr<strong>of</strong>a) management,<br />
Final report to the Queensland Murray–<br />
Darling Committee, Toowoomba.<br />
For further information on this<br />
research project and access to key<br />
publications, visit the invasive plant<br />
and animal science pages on the<br />
Biosecurity Queensland website at<br />
www.biosecurity.qld.gov.au<br />
Part 3 Pest animal management 63<br />
2007<br />
2008<br />
2009<br />
2010<br />
Figure 26.2 Commercial harvesting rate and feral pig density for Queensland macropod survey<br />
blocks, 2007–2010 (excluding blocks where no feral pigs were observed during surveys)
27. Assessing feral pig (Sus scr<strong>of</strong>a) damage to crops using remote sensing<br />
Project dates<br />
February 2009 – December 2010<br />
(completed)<br />
Project leader<br />
Dr Matt Gentle<br />
Robert Wicks Pest Animal Research<br />
Centre<br />
Tel: (07) 4688 1033<br />
Email: matthew.gentle@deedi.qld.gov.au<br />
Other staff in 2010–11<br />
James Speed<br />
Objectives<br />
Assess the use <strong>of</strong> satellite imagery and<br />
geographical information systems to<br />
measure feral pig damage to grain crops.<br />
Key objectives are:<br />
• Undertake field assessments <strong>of</strong> crops<br />
to identify and map areas <strong>of</strong> pig<br />
damage.<br />
• Investigate methods for using satellite<br />
imagery and/or aerial photography to<br />
determine the extent <strong>of</strong> pig damage in<br />
grain crops.<br />
• Given the success <strong>of</strong> objective 2,<br />
construct and validate a model to<br />
define pig damage from all available<br />
field data sets.<br />
Rationale<br />
Current methods <strong>of</strong> determining levels<br />
<strong>of</strong> feral pig (Sus scr<strong>of</strong>a) damage rely<br />
on landholder surveys or intensive and<br />
costly field assessments. Surveys <strong>of</strong><br />
landholders usually indicate the level<br />
<strong>of</strong> damage perceived by landholders<br />
rather than actual measurements. The<br />
relationship between this subjective<br />
(and usually qualitative) measure and<br />
actual damage is unknown. However,<br />
quantitative assessments are very<br />
labour-intensive and not practical for<br />
broadscale assessments <strong>of</strong> damage.<br />
An earlier study by Caley (1993)<br />
investigated feral pig damage to<br />
sorghum and maize crops in the<br />
Northern Territory by using a<br />
combination <strong>of</strong> exclosures and visual<br />
assessments. Although these techniques<br />
were suitable for assessing damage to<br />
grain crops, Caley (1993) recommended<br />
that future studies should use aerial<br />
photography to quantify pig damage<br />
in sorghum crops. The use <strong>of</strong> satellite<br />
imagery is a logical extension <strong>of</strong> this<br />
recommendation. Satellite imagery<br />
<strong>of</strong>fers the potential <strong>of</strong> determining the<br />
nature, extent and location <strong>of</strong> damage<br />
and its relationship with aspects <strong>of</strong> the<br />
environment.<br />
Methods<br />
Wheat crops in the Moonie–Goondiwindi<br />
area <strong>of</strong> southern Queensland are field<br />
surveyed for feral pig damage. Targeted<br />
crop types and paddock locations<br />
include those known to have historically<br />
suffered high levels <strong>of</strong> damage. We<br />
record the location <strong>of</strong> trampled patches<br />
(using a GPS), area damaged and<br />
intensity <strong>of</strong> damage within this area<br />
(e.g. 80% loss), along with species<br />
responsible for the damage.<br />
We use the data to establish<br />
characteristics <strong>of</strong> feral pig damage in<br />
crops, including the location and typical<br />
areal extent <strong>of</strong> pig damage. Using this<br />
information, we specify a minimum<br />
mapping unit and image pixel size<br />
suitable for mapping pig damage. This<br />
allows us to select suitable image data,<br />
including government archive SPOT<br />
(satellite pour l’observation de la terre),<br />
Ikonos, Quickbird and Geoeye.<br />
Then we analyse imagery (recorded at<br />
the same time as field data) to determine<br />
unique characteristics <strong>of</strong> feral pig<br />
damage that could be used to develop<br />
a suitable mapping approach. Once a<br />
suitable approach is developed, we apply<br />
it to other current and archival imagery<br />
to identify areas <strong>of</strong> pig damage.<br />
Findings<br />
We were able to identify many patches <strong>of</strong><br />
feral pig damage in field assessments and<br />
successfully captured suitable Quickbird<br />
imagery. However, we were unsuccessful<br />
in using satellite imagery to identify<br />
feral pig damage in wheat crops. Despite<br />
several attempts using visual or pixelbased<br />
approaches, there was no apparent<br />
match between field survey points and<br />
evident damage in the images.<br />
Firstly, patches <strong>of</strong> feral pig damage<br />
recorded during field assessments were<br />
typically small, <strong>of</strong>ten only marginally<br />
larger than a single pixel in the image.<br />
However, even the numerous large<br />
patches <strong>of</strong> feral pig damage recorded<br />
(e.g. an area <strong>of</strong> close to 70 m × 70 m at<br />
Southwood) could not be successfully<br />
distinguished in the imagery.<br />
Secondly, regardless <strong>of</strong> the size <strong>of</strong> the<br />
damaged area, the characteristics <strong>of</strong> pig<br />
damage were difficult to distinguish<br />
from underlying damage associated<br />
with dryland cropping systems,<br />
including damage from poor crop<br />
establishment, wind and scalding. For<br />
example, gilgais (soil depressions)<br />
are common in the study area and<br />
typically fill with water during wet<br />
periods. These and other variations<br />
in soil conditions are responsible for<br />
significant natural variation in crop<br />
establishment and yield, which could<br />
easily be mistaken for feral pig damage<br />
on imagery. Additionally, wheat<br />
crops have a relatively open canopy,<br />
particularly as the crop matures and<br />
approaches ripening (grain-fill), which<br />
further complicates differentiation from<br />
damaged areas.<br />
Thirdly, determining the cause <strong>of</strong> crop<br />
damage during field assessments is not<br />
straightforward. Some interpretation<br />
by the observer is usually required<br />
through inspecting field signs either<br />
on the ground or on damaged plants.<br />
Some ground-truthing <strong>of</strong> crop damage<br />
identified on satellite imagery would<br />
always be required to establish the<br />
species responsible.<br />
64 <strong>Technical</strong> <strong>highlights</strong>: research projects 2010–11
Furthermore, the capture process<br />
associated with Quickbird images can<br />
prove problematic. Factors impeding<br />
successful image capture include the<br />
size and shape <strong>of</strong> the capture area<br />
(areas > 18 km wide need to be captured<br />
in at least two passes), significant cloud<br />
cover at the time <strong>of</strong> pass and the priority<br />
<strong>of</strong> other pending image capture requests.<br />
Those results, when combined with the<br />
cost, analytical difficulties, practicalities<br />
and logistical issues with data collection,<br />
indicate that using satellite imagery<br />
for assessing feral pig damage to<br />
grain crops currently has serious<br />
deficiencies. Further studies should only<br />
be considered if new advances in image<br />
capture (e.g. inclusion <strong>of</strong> middle-infrared<br />
bands) or analysis have been made.<br />
Reference<br />
Caley, P 1993, The ecology and<br />
management <strong>of</strong> feral pigs in the wetdry<br />
tropics <strong>of</strong> the Northern Territory,<br />
MAppSc Thesis, University <strong>of</strong> Canberra,<br />
Canberra.<br />
Funding in 2010–11<br />
• Australian Pest Animal Research<br />
Program, DAFF ($22 000)<br />
• Queensland Government<br />
Collaborator<br />
Pr<strong>of</strong>. Stuart Phinn (Centre for Spatial<br />
Environmental Research, The University<br />
<strong>of</strong> Queensland)<br />
More information<br />
Key publication<br />
Gentle, M, Phinn, S & Speed, J 2011,<br />
Assessing pig damage in agricultural<br />
crops with remote sensing, Final<br />
report to the Australian Government<br />
<strong>Department</strong> <strong>of</strong> Agriculture, Fisheries and<br />
Forestry, Canberra.<br />
For further information on this research<br />
project and access to key publications,<br />
visit the invasive plant and animal science<br />
pages on the Biosecurity Queensland<br />
website at www.biosecurity.qld.gov.au<br />
Part 3 Pest animal management 65
28. Non‑target impacts <strong>of</strong> 1080 meat baits for feral pigs (Sus scr<strong>of</strong>a)<br />
Project dates<br />
June 2010 – June 2012<br />
Project leader<br />
Dr Matt Gentle<br />
Robert Wicks Pest Animal Research Centre<br />
Tel: (07) 4688 1033<br />
Email: matthew.gentle@deedi.qld.gov.au<br />
Other staff in 2010–11<br />
James Speed, Tony Pople and Michael<br />
Brennan<br />
Objective<br />
Quantify the population-level impact<br />
on non-target species, specifically birds,<br />
from 1080 meat baiting practices used<br />
for feral pig control.<br />
Rationale<br />
Bait containing 1080 (sodium<br />
fluoroacetate) is widely used for<br />
the routine control <strong>of</strong> feral pigs in<br />
Queensland. Meat baits are popular in<br />
western and northern pastoral areas<br />
since they can be distributed aerially.<br />
Although much research has assessed the<br />
effectiveness <strong>of</strong> baiting practices, little<br />
is known about the long-term impact <strong>of</strong><br />
such practices on other species.<br />
The APVMA conducted a review into<br />
the use <strong>of</strong> 1080 meat baits for feral pig<br />
control. This review indicated that the<br />
practice may be harmful to a range <strong>of</strong><br />
non-target animals, largely because<br />
<strong>of</strong> species’ sensitivity to 1080 (i.e. the<br />
toxicity <strong>of</strong> 1080). These concerns are<br />
supported by field observations from<br />
south-western and northern Queensland<br />
indicating some bait uptake by non-target<br />
species. Species observed include corvid<br />
and raptor species such as the Australian<br />
raven (Corvus coronoides), Australian<br />
magpie (Gymnorhina tibicen), whistling<br />
kite (Haliastur sphenurus), black kite<br />
(Milvus migrans) and wedge-tailed eagle<br />
(Aquila audax), and varanid species such<br />
as Gould’s goanna (Varanus gouldii) and<br />
the lace monitor (Varanus varius).<br />
Published susceptibility data indicates<br />
that many <strong>of</strong> these species are<br />
(theoretically) at risk through primary<br />
poisoning from 1080 meat baits. For<br />
example, for an average adult Australian<br />
raven (<strong>of</strong> body weight 585 g), about<br />
3 mg <strong>of</strong> 1080 (less than 5% <strong>of</strong> the 1080<br />
content in one bait) would be a lethal<br />
dose. However, it is not certain that this<br />
theoretical risk translates into a real<br />
impact. Occasionally, bird carcasses<br />
(primarily raptors) have been found<br />
following baiting operations and, in<br />
some cases, laboratory analyses have<br />
confirmed 1080 poisoning as the cause<br />
<strong>of</strong> death. Yet we are unsure whether<br />
these cases represent a level <strong>of</strong> mortality<br />
that could threaten species’ population<br />
viability or disrupt some ecological<br />
function performed by these species.<br />
No trial to date has demonstrated any<br />
population impact on non-target species.<br />
By examining such impacts, this project<br />
helps ensure that baiting operations<br />
are acceptably target-specific, and that<br />
1080 use is responsible and ecologically<br />
sustainable.<br />
Methods<br />
Population counts<br />
To detect any changes in the abundance<br />
<strong>of</strong> non-target species following standard<br />
aerial baiting operations, we count birds<br />
(targeting raptor and corvid species)<br />
before and after baiting on treatment<br />
sites and on control sites not exposed<br />
to baiting. These counts occur along<br />
driven transects for up to 10 days in<br />
each period. All data is recorded using<br />
distance-sampling techniques to provide<br />
density estimates and is analysed using<br />
the computer program Distance 6.0.<br />
Monitoring <strong>of</strong> individual birds<br />
We also monitor individual birds <strong>of</strong> a<br />
susceptible non-target species during<br />
a 1080 baiting campaign to determine<br />
levels <strong>of</strong> mortality due to baiting. Up<br />
to 15 individual Australian ravens<br />
are trapped and fitted with radio<br />
transmitters via elasticised harnesses<br />
on each treatment site and a control site.<br />
We then monitor their mortality for 2–6<br />
weeks post-baiting, depending on the<br />
level <strong>of</strong> harness/transmitter failure.<br />
Monitoring <strong>of</strong> bait uptake and<br />
carcass searches<br />
During baiting, we further monitor a<br />
sample <strong>of</strong> bait stations (up to 40) daily<br />
via remote photography or soil plots<br />
to determine the proportion <strong>of</strong> baits<br />
removed and the identity <strong>of</strong> species<br />
removing baits. All monitored baits<br />
have radio transmitters incorporated<br />
to report the fate <strong>of</strong> removed baits,<br />
for example moved (transmitter found<br />
within bait) or consumed (transmitter<br />
found without bait).<br />
We also search and collect carcasses<br />
<strong>of</strong> non-target species for toxicological<br />
analyses to confirm the cause <strong>of</strong> death.<br />
This research is conducted under an<br />
animal ethics permit, CA 2009-06-360.<br />
Progress in 2010–11<br />
We completed a preliminary population<br />
count trial at Culgoa Floodplain National<br />
Park and three nearby properties (Kulki,<br />
North Kulki and Tambingey) south <strong>of</strong><br />
Bollon, south-western Queensland, in<br />
May–June 2011. Culgoa Floodplain<br />
National Park was aerially baited for<br />
feral pigs as part <strong>of</strong> routine management<br />
and served as the treatment site; Kulki,<br />
North Kulk and Tambingey served as<br />
control sites.<br />
Density estimates were calculated for<br />
species where a sufficient number <strong>of</strong><br />
sightings were recorded in the prebaiting<br />
period. Initially, separate<br />
detection functions were calculated for<br />
each site/species combination, but some<br />
were subsequently pooled (to obtain a<br />
global detection function) where they<br />
were not significantly different.<br />
66 <strong>Technical</strong> <strong>highlights</strong>: research projects 2010–11
Photo 28.1 An Australian raven inspecting a goat carcass at an unset bait station near Culgoa<br />
Floodplain National Park, south-western Queensland<br />
Density (birds km –2 )<br />
6<br />
5<br />
4<br />
3<br />
2<br />
1<br />
0<br />
Culgoa Tambingey Kulki North Kulki<br />
Monitoring site<br />
pre-baiting<br />
post-baiting<br />
standard error<br />
Figure 28.1 Pre-baiting and post-baiting densities <strong>of</strong> Australian raven at four monitoring sites<br />
in south-western Queensland<br />
Densities <strong>of</strong> the Australian magpie, pied<br />
butcherbird and wedge-tailed eagle were<br />
not significantly different pre-baiting<br />
and post-baiting at Culgoa Floodplain<br />
National Park or the control sites.<br />
The abundance <strong>of</strong> Australian ravens,<br />
however, significantly increased—<br />
effectively doubled—following baiting<br />
at Culgoa Floodplain National Park<br />
(Figure 28.1). Raven densities also<br />
appeared to increase at Kulki and North<br />
Kulki post-baiting, but these differences<br />
were not statistically significant.<br />
Densities on Tambingey were stable<br />
during the same period.<br />
While results to date suggest minimal,<br />
if any, impact on susceptible bird<br />
species, further monitoring is required<br />
to investigate effects on long-term<br />
abundance. Further replication during<br />
the October–November 2011 baiting<br />
period will also help account for<br />
any confounding effects from bird<br />
movements (emigration or immigration)<br />
and bait distribution (e.g. increased food<br />
availability).<br />
Funding in 2010–11<br />
Queensland Government<br />
Collaborators<br />
• DERM<br />
• The University <strong>of</strong> Queensland<br />
More information<br />
Key publication<br />
Gentle, M 2010, ‘What gets killed by<br />
meat baits for feral pigs?’, in Proceedings<br />
<strong>of</strong> the 3rd Queensland Pest Animal<br />
Symposium, Gladstone, Queensland.<br />
For further information on this research<br />
project and access to key publications,<br />
visit the invasive plant and animal science<br />
pages on the Biosecurity Queensland<br />
website at www.biosecurity.qld.gov.au<br />
Part 3 Pest animal management 67
29. Feral pig (Sus scr<strong>of</strong>a) best practice research in northern Queensland<br />
Project dates<br />
July 2009 – June 2012<br />
Project leader<br />
Dr Jim Mitchell<br />
Tropical Weeds Research Centre<br />
Tel: (07) 4761 5734<br />
Email: jim.mitchell@deedi.qld.gov.au<br />
Other staff in 2010–11<br />
Brian Ross<br />
Objective<br />
Improve feral pig management in the dry<br />
tropics <strong>of</strong> northern Queensland.<br />
Rationale<br />
Large numbers <strong>of</strong> feral pigs continue<br />
to cause environmental and economic<br />
impacts in the dry tropics <strong>of</strong> northern<br />
Queensland. While there are several<br />
control techniques available for feral<br />
pigs, refinement <strong>of</strong> these is important to<br />
improve efficacy and minimise nontarget<br />
impacts. For broadscale control,<br />
ground and aerial baiting are two <strong>of</strong> the<br />
most practical and efficient options, but<br />
these need to be timely and strategic.<br />
Research over several years has focused<br />
on establishing appropriate baiting<br />
densities and practices (e.g. strategic<br />
versus blanket baiting). The next step<br />
is to determine whether concentrated<br />
repeat baiting can <strong>of</strong>fer better control<br />
than a one-<strong>of</strong>f baiting program.<br />
Methods<br />
Along the frontage <strong>of</strong> the Burdekin<br />
and Star rivers (north <strong>of</strong> Charters<br />
Towers), we establish nine experimental<br />
areas (10 × 1 km) in blocks <strong>of</strong> three.<br />
Within each block we randomly assign<br />
experimental areas to one <strong>of</strong> three<br />
treatments: nil treatment (no baiting),<br />
standard baiting (once only) or pulse<br />
baiting (baiting at monthly intervals for<br />
three consecutive months).<br />
We distribute the standard 1080 pigstrength<br />
formulation (72 mg in each<br />
500 g meat bait) from an aircraft at<br />
a density <strong>of</strong> 12 baits km –2 . Following<br />
baiting, we monitor population<br />
knockdown through activity transects<br />
and camera-capture sampling.<br />
Progress in 2010–11<br />
In September 2010, we undertook initial<br />
aerial baiting for both the standard (one<strong>of</strong>f)<br />
and pulse baiting treatments. This<br />
was followed by further baiting in the<br />
pulse baiting treatment areas in October<br />
and November 2010. Monitoring revealed<br />
no significant differences in the feral pig<br />
populations before and after treatments.<br />
This was most likely associated with<br />
prolonged rainfall during 2010, which<br />
created an abundance <strong>of</strong> waterholes and<br />
allowed pigs to remain widely dispersed.<br />
Normally during the dry season<br />
feral pigs tend to concentrate around<br />
remaining permanent waterbodies,<br />
which allows control activities to be<br />
targeted to these areas. Because baiting<br />
was concentrated in strips along the<br />
edges <strong>of</strong> the rivers, a number <strong>of</strong> feral<br />
pigs may not have come in contact with<br />
the baits. A repeat <strong>of</strong> this project will be<br />
considered if additional external funding<br />
becomes available.<br />
Funding in 2010–11<br />
• Land Protection Fund ($128 000)<br />
• Queensland Government<br />
More information<br />
For further information on this research<br />
project, visit the invasive plant and<br />
animal science pages on the<br />
Biosecurity Queensland website at<br />
www.biosecurity.qld.gov.au<br />
68 <strong>Technical</strong> <strong>highlights</strong>: research projects 2010–11
30. Adaptive management <strong>of</strong> rabbits (Oryctolagus cuniculus)<br />
in south‑eastern Queensland<br />
Project dates<br />
2000–2012<br />
Project leader<br />
Dr David Berman<br />
Robert Wicks Pest Animal Research Centre<br />
Tel: (07) 4688 1294<br />
Email: david.berman@deedi.qld.gov.au<br />
Other staff in 2010–11<br />
Michael Brennan<br />
Objectives<br />
Establish landholder-driven,<br />
scientifically monitored rabbit-control<br />
programs in the Darling Downs –<br />
Moreton Rabbit Board (DDMRB) area to:<br />
• measure the benefits <strong>of</strong> rabbit control<br />
to biodiversity, agriculture and<br />
pastoralism<br />
• demonstrate the importance <strong>of</strong><br />
targeting control activities in key<br />
breeding places (sources)<br />
• refine control strategies and<br />
methods to reduce cost and increase<br />
effectiveness<br />
• measure the cost <strong>of</strong> eradicating small,<br />
isolated rabbit populations.<br />
Rationale<br />
In south-eastern Queensland, a rabbitpro<strong>of</strong><br />
fence maintained by the DDMRB<br />
has protected large areas from rabbits<br />
since 1906. This area is unique because<br />
it is highly suitable for rabbits, yet has<br />
never experienced the damage caused by<br />
plagues <strong>of</strong> uncontrolled rabbits as seen<br />
in adjacent areas not protected by the<br />
rabbit-pro<strong>of</strong> fence. This situation is ideal<br />
for measuring the benefits <strong>of</strong> effective<br />
rabbit control to biodiversity and<br />
agriculture. Measuring these benefits<br />
and demonstrating control methods<br />
are essential to justify the expense <strong>of</strong><br />
controlling rabbits and to encourage<br />
landholders to control this pest.<br />
Rabbit incursions into the DDMRB area<br />
have occurred for many years and appear<br />
to be more frequent recently, although<br />
rabbits generally have not yet established<br />
permanent warren systems within this<br />
area. Genetic studies comparing rabbit<br />
populations inside and outside the DDMRB<br />
area can help identify the source <strong>of</strong> these<br />
rabbit incursions. Targeting these source<br />
areas could help prevent further incursions<br />
into the DDMRB area; it could also help<br />
minimise the cost and maximise the<br />
long-term effectiveness <strong>of</strong> rabbit control in<br />
south-eastern Queensland.<br />
Methods<br />
Benefits <strong>of</strong> rabbit control<br />
In the study site at Cottonvale, south<br />
<strong>of</strong> Warwick, we mark all warrens and<br />
log piles with steel posts and record the<br />
number <strong>of</strong> active and inactive burrows. We<br />
also establish rabbit-pro<strong>of</strong> and cattle-pro<strong>of</strong><br />
(with rabbit access) exclosures to identify<br />
the impacts <strong>of</strong> rabbits and separate these<br />
from impacts caused by cattle. To monitor<br />
rabbit and wildlife activity, we distribute<br />
sand tracking plots and also install<br />
movement-sensing cameras. Once we<br />
have measured the differences between<br />
lightly infested and heavily infested areas,<br />
we destroy warrens by ripping. Then we<br />
measure the effectiveness <strong>of</strong> this method<br />
for rabbit control as well as the associated<br />
rate and extent <strong>of</strong> recovery <strong>of</strong> pasture and<br />
biodiversity.<br />
Genetic studies<br />
We also obtain ear-tissue samples from<br />
rabbits at 19 locations both inside and<br />
outside the DDMRB area. Susan Fuller<br />
from the Queensland University <strong>of</strong><br />
Technology conducts genetic analyses on<br />
extracted rabbit DNA.<br />
Progress in 2010–11<br />
Benefits <strong>of</strong> rabbit control<br />
Research to date suggests that native<br />
plants and animals benefit significantly<br />
from low rabbit densities achieved by<br />
the rabbit-pro<strong>of</strong> fence and other control<br />
activities. The benefit to agricultural<br />
production is also significant but<br />
requires further quantification.<br />
Genetic studies<br />
Total DNA was extracted from ear-tissue<br />
samples obtained from 2007 to 2010 and<br />
nine loci were analysed. The analysis<br />
indicated five genetically distinct<br />
populations: Killarney, Hampton,<br />
Ipswich, Waterford West – Chambers Flat<br />
and Eukey–Cottonvale (Figure 30.1).<br />
The pie charts in Figure 30.1 show the<br />
proportion <strong>of</strong> sampled rabbits in each<br />
<strong>of</strong> these populations. Larger coloured<br />
areas are threatened by dispersing<br />
rabbits (i.e. are within 20 km <strong>of</strong> warrens<br />
reported via RabbitScan). There is likely<br />
to be limited rabbit movement between<br />
green, pink and blue areas.<br />
Figure 30.1 The genetic make-up <strong>of</strong> rabbit populations at 18 locations in south-eastern Queensland<br />
Part 3 Pest animal management 69
Rabbits within each site are highly<br />
genetically related, but gene flow<br />
(dispersal) between sites appears to<br />
be restricted. Cottonvale and Eukey<br />
rabbits showed a high degree <strong>of</strong> genetic<br />
similarity. Dalveen and Leslie Dam<br />
populations were also quite similar to the<br />
Eukey–Cottonvale populations, indicating<br />
that some restricted gene flow has<br />
occurred among these sites in the past.<br />
Rabbits from the clean and dirty side <strong>of</strong><br />
the fence at Cottonvale were genetically<br />
very similar, suggesting a shared<br />
ancestry. Geographically, the closest site<br />
to Cottonvale was Dalveen, and this site<br />
was composed <strong>of</strong> individuals that shared<br />
78% ancestry with the Eukey–Cottonvale<br />
populations. Therefore, rabbits that have<br />
recently invaded the clean side <strong>of</strong> the<br />
fence at Cottonvale and Dalveen are<br />
likely to have originated from the dirty<br />
side <strong>of</strong> the fence at Cottonvale, probably<br />
via occasional holes in the fence. Since,<br />
for rabbits, Eukey appears to be a more<br />
productive area than Cottonvale, it is<br />
likely that Eukey is the original source<br />
<strong>of</strong> rabbits. Eukey–Cottonvale is also the<br />
likely source <strong>of</strong> rabbit populations at<br />
Leslie Dam. Rabbits from Palgrave and<br />
Warwick display mixed ancestry. Rabbit<br />
populations in these areas are likely to<br />
have been founded by a combination <strong>of</strong><br />
migrants from Eukey–Cottonvale and<br />
Wallangarra. The rabbit population at<br />
Killarney was most likely founded by<br />
rabbits from Warwick.<br />
These results suggest that it is important<br />
not only to eradicate populations<br />
within the DDMRB area but also to<br />
control rabbits at Cottonvale, Eukey and<br />
Wallangarra to reduce the chance <strong>of</strong><br />
further invasions. These areas are the<br />
sources <strong>of</strong> rabbits invading at least the<br />
southern part <strong>of</strong> the DDMRB area.<br />
Therefore, control <strong>of</strong> rabbits in these<br />
areas has the potential to reduce rabbit<br />
numbers over a much larger surrounding<br />
area. Warren ripping at Cottonvale and<br />
Eukey (coordinated and partly funded<br />
by the QMDC) has significantly reduced<br />
rabbit populations to the extent that<br />
they may no longer be sources <strong>of</strong> rabbits<br />
for surrounding areas. Further work is<br />
required to ensure there are no large<br />
warren systems remaining, while ripping<br />
is also required at Wallangarra.<br />
Rabbits from Dalby, Gatton and<br />
Hampton displayed similar ancestry,<br />
but the sources <strong>of</strong> these populations<br />
are unknown. The sources <strong>of</strong> the<br />
Chambers Flat – Waterford West and<br />
Ipswich populations are also unknown.<br />
Additional tissue samples need to be<br />
collected from areas to the north <strong>of</strong> the<br />
DDMRB and the Tweed Heads area to<br />
identify possible sources <strong>of</strong> these rabbits.<br />
Funding in 2010–11<br />
Land Protection Fund ($20 000)<br />
Collaborators<br />
• Susan Fuller (Queensland University<br />
<strong>of</strong> Technology)<br />
• Mark Ridge (DDMRB)<br />
• Shane Cartwright (Queensland<br />
Murray–Darling Committee)<br />
• Harley West (Granite Borders<br />
Landcare)<br />
More information<br />
Key publications<br />
Berman, D, Brennan, M & Elsworth, P<br />
2011, ‘How can warren destruction by<br />
ripping control European wild rabbits<br />
(Oryctolagus cuniculus) on large<br />
properties in the Australian arid zone?’,<br />
Wildlife Research 38(1): 77–88.<br />
Brennan, M & Berman, D 2008, ‘The<br />
value <strong>of</strong> having no rabbits in South<br />
East Queensland’, in G Saunders &<br />
C Lane (eds), Proceedings <strong>of</strong> the 14th<br />
Australasian Vertebrate Pest Conference,<br />
The Vertebrate Pests Committee and the<br />
Invasive Animals Cooperative Research<br />
Centre, Canberra, p. 102.<br />
Scanlan, JC, Berman, DM & Grant, WE<br />
2006, ‘Population dynamics <strong>of</strong> the<br />
European rabbit (Oryctolagus cuniculus)<br />
in north-eastern Australia: simulated<br />
responses to control’, Ecological<br />
Modelling 196(1–2): 221–36.<br />
For further information on this research<br />
project and access to key publications,<br />
visit the invasive plant and animal science<br />
pages on the Biosecurity Queensland<br />
website at www.biosecurity.qld.gov.au<br />
70 <strong>Technical</strong> <strong>highlights</strong>: research projects 2010–11
31. Mapping the distribution and density <strong>of</strong> rabbits (Oryctolagus cuniculus) in Australia<br />
Project dates<br />
July 2008 – August 2012<br />
Project leader<br />
Dr David Berman<br />
Robert Wicks Pest Animal Research<br />
Centre<br />
Tel: (07) 4688 1294<br />
Email: david.berman@deedi.qld.gov.au<br />
Other staff in 2010–11<br />
Michael Brennan<br />
Objectives<br />
• Improve the understanding <strong>of</strong> the<br />
distribution and abundance <strong>of</strong> rabbits<br />
in Australia.<br />
• Produce a map <strong>of</strong> the distribution and<br />
abundance <strong>of</strong> rabbits that is suitable for:<br />
- estimating the extent <strong>of</strong> damage<br />
caused<br />
- efficiently planning control<br />
programs<br />
- monitoring the success <strong>of</strong> rabbit<br />
control at the regional, state and<br />
national levels.<br />
Rationale<br />
From an initial release in Victoria in<br />
1859, European rabbits (Oryctolagus<br />
cuniculus) have spread across the<br />
country and are viewed as Australia’s<br />
most serious vertebrate pest. During the<br />
past 60 years, rabbit populations have<br />
been suppressed significantly by the<br />
biological control agents myxoma virus<br />
and rabbit haemorrhagic disease virus<br />
(RHDV), and (in places) by conventional<br />
control. Yet it is difficult to measure the<br />
benefit <strong>of</strong> these control efforts because<br />
our knowledge <strong>of</strong> rabbit distribution<br />
and abundance Australia-wide has been<br />
inadequate.<br />
A map prepared as part <strong>of</strong> the National<br />
Land and Water Resources Audit 2007<br />
was based on predominantly qualitative<br />
information obtained from local experts,<br />
which makes comparisons between<br />
regions difficult.<br />
A map prepared for Queensland using<br />
Spanish rabbit flea release sites and<br />
soil type (Berman et al. 1998) proved<br />
a good representation <strong>of</strong> rabbit density<br />
and distribution, but its extension to the<br />
whole <strong>of</strong> Australia was compromised by<br />
data restricted largely to arid areas.<br />
To collect recent rabbit distribution<br />
and abundance data across Australia,<br />
the Rabbit Management Advisory<br />
Group initiated RabbitScan in May<br />
2009. RabbitScan gives all Australians<br />
a means to map rabbits using Google<br />
Earth ® technology. It is designed to allow<br />
community and school groups to report<br />
rabbit abundance. Records collected by<br />
RabbitScan, combined with existing<br />
records, will provide an improved<br />
understanding <strong>of</strong> rabbit distribution in<br />
Australia. RabbitScan has now given rise<br />
to FeralScan (www.feralscan.org.au),<br />
through which other pest animals are<br />
also mapped.<br />
Methods<br />
We provide scientific support for<br />
RabbitScan, promote the collection <strong>of</strong><br />
data via RabbitScan and search for<br />
published and unpublished historical<br />
records <strong>of</strong> rabbit occurrence and<br />
density. Using all available records <strong>of</strong><br />
rabbits (historical and RabbitScan),<br />
we determine the density <strong>of</strong> rabbit<br />
sites across various soil landscapes (as<br />
classified in the Atlas <strong>of</strong> Australian<br />
soils mapping units). This enables us<br />
to produce a map showing the relative<br />
suitability <strong>of</strong> areas for rabbits.<br />
We also attempt to identify key areas<br />
requiring priority treatment, which may<br />
be the sources <strong>of</strong> rabbits for surrounding<br />
areas. First, we overlay historical and<br />
RabbitScan data points (including a<br />
20 km buffer representing the area<br />
immediately threatened by dispersing<br />
rabbits). The area <strong>of</strong> overlap most<br />
likely represents the area where rabbit<br />
populations have been most stable.<br />
We then examine the proportion <strong>of</strong><br />
RabbitScan points with highest warren<br />
density within the area <strong>of</strong> overlap. These<br />
areas are likely to be the most productive<br />
breeding places for rabbits. We expect<br />
the highest warren densities to be<br />
located mainly in the area <strong>of</strong> overlap.<br />
We further investigate whether the<br />
density scores reported by RabbitScan<br />
respondents are correlated with latitude,<br />
which is known to have a major<br />
influence on rabbit distribution and<br />
abundance. We expect the density <strong>of</strong><br />
rabbits to be, on average, higher in the<br />
south than in the north.<br />
Progress in 2010–11<br />
From RabbitScan and other sources, we<br />
have obtained coordinates for a total <strong>of</strong><br />
9901 points where rabbits occur or have<br />
occurred in Australia. The area exposed<br />
to the impact <strong>of</strong> rabbits in Australia is<br />
at least 2 213 598 km 2 or 29% <strong>of</strong> the<br />
continent. The area within 20 km <strong>of</strong><br />
RabbitScan points with the highest<br />
warren density is 84 021 km 2 or 4% <strong>of</strong><br />
the total area exposed to the impact <strong>of</strong><br />
rabbits (Figure 31.1). Interestingly,<br />
82 <strong>of</strong> 111 points (74%) with the<br />
highest warren density were in the<br />
area <strong>of</strong> overlap between historical and<br />
RabbitScan points.<br />
Rabbit density as reported by<br />
RabbitScan respondents decreased<br />
with latitude (Figure 31.2), matching<br />
expectations from conventional<br />
scientific knowledge. This suggests<br />
that respondents are reliably reporting<br />
density estimates and that RabbitScan<br />
can be useful for monitoring trends<br />
within selected areas (catchments or<br />
council areas) <strong>of</strong> Australia.<br />
This work <strong>highlights</strong> the importance <strong>of</strong><br />
mapping the distribution and abundance<br />
<strong>of</strong> rabbits for identifying areas that<br />
require increased control efforts. The<br />
full value <strong>of</strong> RabbitScan will be realised<br />
once a few years <strong>of</strong> data have been<br />
collected and we can monitor the effects<br />
<strong>of</strong> control activities.<br />
Part 3 Pest animal management 71
RabbitScan and historical records<br />
RabbitScan records with the highest warren density<br />
Figure 31.1 The total area exposed to the impact <strong>of</strong> rabbits in Australia (both historically and as<br />
reported via RabbitScan) and areas with the highest warren density as reported via RabbitScan;<br />
data points are surrounded by 20 km buffers representing the areas immediately threatened by<br />
dispersing rabbits<br />
Rabbit density score<br />
4<br />
3<br />
2<br />
1<br />
0<br />
0<br />
–43.5 –41.5 –39.5 –37.5 –35.5 –33.5 –31.5 –29.5 –27.5 –25.5 –23.5 –21.5 –19.5 –17.5 –15.5<br />
Latitude (degrees south)<br />
standard error<br />
Figure 31.2 Rabbit density scores by latitude as reported by RabbitScan respondents and the<br />
sample sizes (shown as bars) for these latitudes<br />
Funding in 2010–11<br />
Land Protection Fund ($20 000)<br />
Collaborators<br />
• Rabbit Management Advisory Group<br />
• Brian Cooke (Invasive Animals<br />
Cooperative Research Centre;<br />
University <strong>of</strong> Canberra)<br />
• Susan Fuller and Grant<br />
Hamilton (Queensland University<br />
<strong>of</strong> Technology)<br />
More information<br />
Key publications<br />
Berman, D & Cooke, B 2008, ‘A method<br />
for mapping the distribution and<br />
density <strong>of</strong> rabbits and other vertebrate<br />
pests in Australia’, in G Saunders &<br />
C Lane (eds), Proceedings <strong>of</strong> the 14th<br />
Australasian Vertebrate Pest Conference,<br />
The Vertebrate Pests Committee and the<br />
Invasive Animals Cooperative Research<br />
Centre, Canberra, p. 103.<br />
Berman, D, Robertshaw, J & Gould, W<br />
1998, ‘Rabbits in Queensland: where<br />
have they been, what have they done<br />
and where are they now?’, in Proceedings<br />
<strong>of</strong> the 11th Australasian Vertebrate Pest<br />
Conference, Bunbury, Western Australia,<br />
pp. 395–9.<br />
For further information on this research<br />
project and access to key publications,<br />
visit the invasive plant and animal science<br />
pages on the Biosecurity Queensland<br />
website at www.biosecurity.qld.gov.au<br />
72 <strong>Technical</strong> <strong>highlights</strong>: research projects 2010–11<br />
1400<br />
1200<br />
1000<br />
800<br />
600<br />
400<br />
200<br />
Sample size (number <strong>of</strong> points)
32. Resistance to rabbit haemorrhagic disease virus in Australian rabbits<br />
(Oryctolagus cuniculus)<br />
Project dates<br />
July 2007 – 2013<br />
Project leader<br />
Peter Elsworth<br />
Robert Wicks Pest Animal Research<br />
Centre<br />
Tel: (07) 4652 1599<br />
Email: peter.elsworth@deedi.qld.gov.au<br />
Other staff in 2010–11<br />
David Berman and David Aster<br />
Objectives<br />
• Develop a test protocol for<br />
determining resistance to RHDV in<br />
rabbits.<br />
• Test rabbits from around Australia to<br />
determine if resistance is developing<br />
and to what level it has developed.<br />
• Explore reasons behind any<br />
variation in resistance seen between<br />
populations.<br />
• Test field strains <strong>of</strong> RHDV to compare<br />
virulence and effectiveness against<br />
the original release strain.<br />
• Explore interactions between RHDV<br />
and the new suspected benign rabbit<br />
calicivirus (RCV-A1) discovered in<br />
Australian rabbits.<br />
Rationale<br />
RHDV has been a successful tool in the<br />
control <strong>of</strong> rabbits (Oryctolagus cuniculus)<br />
throughout Australia. It caused a<br />
great reduction in rabbit numbers on<br />
initial release and continues to keep<br />
numbers low in many areas. However,<br />
concerns have been raised about RHDV’s<br />
continuing efficacy, as numbers <strong>of</strong><br />
rabbits are increasing in some areas.<br />
Rabbits started showing resistance to<br />
myxomatosis about 10 years after its<br />
initial release and it has now been over<br />
a decade since RHDV was released.<br />
Anecdotal and observational information<br />
indicate rabbit numbers are increasing<br />
to levels not seen since the release <strong>of</strong><br />
RHDV. Monitoring sites have also shown<br />
changes in rabbit populations during<br />
outbreaks <strong>of</strong> RHDV that may indicate the<br />
development <strong>of</strong> resistance. Rabbits are<br />
a major pest <strong>of</strong> agricultural and natural<br />
systems and if they were to return to the<br />
numbers present pre-RHDV, they would<br />
once again have a devastating effect.<br />
Initial challenge tests showed that<br />
different populations <strong>of</strong> rabbits<br />
around Australia had differing levels<br />
<strong>of</strong> resistance to RHDV. The level <strong>of</strong><br />
resistance was correlated to rainfall,<br />
with populations from regions <strong>of</strong><br />
intermediate rainfall having the highest<br />
resistance levels. As rabbits develop<br />
resistance, changes in the virus to<br />
overcome this resistance can also be<br />
expected. Further challenge tests with<br />
virus collected from South Australia<br />
over three years showed that field strains<br />
are maintaining virulence. The original<br />
release strain, however, is less effective<br />
in this population, causing a lower<br />
mortality and a longer survival time<br />
(Figure 32.1).<br />
We are now conducting a series <strong>of</strong><br />
challenge tests on wild and domestic<br />
rabbit populations to determine whether<br />
resistance does indeed have a genetic<br />
basis. If resistance is genetically based,<br />
each subsequent generation bred from<br />
survivors should have increasing<br />
resistance levels.<br />
Survival time (hours)<br />
140<br />
120<br />
100<br />
80<br />
60<br />
40<br />
20<br />
Czech V–351<br />
Methods<br />
We collect wild rabbits from Bulloo<br />
Downs in south-western Queensland,<br />
as well as domestic control rabbits, to<br />
form a parent generation (Generation 0).<br />
Prior to testing, <strong>of</strong>fspring were bred<br />
from a random subset <strong>of</strong> Generation 0 to<br />
provide the next generation for testing<br />
(Generation 1). In challenge tests, each<br />
group <strong>of</strong> rabbits is administered a low<br />
oral dose <strong>of</strong> RHDV (1:25 dilution <strong>of</strong> stock<br />
solution, as the full dose would kill most<br />
<strong>of</strong> the rabbits regardless <strong>of</strong> whether<br />
they have resistance or not). Survivors<br />
<strong>of</strong> those trials are allowed to breed and<br />
their <strong>of</strong>fspring is tested using the same<br />
procedures.<br />
0<br />
60 70 80 90 100<br />
Mortality (%)<br />
2006 virus<br />
2009 virus<br />
2007 virus<br />
Figure 32.1 Mortality and survival time for rabbits orally challenged with the original release<br />
strain <strong>of</strong> RHDV (Czech V-351) and field strains collected in 2006, 2007 and 2009<br />
Part 3 Pest animal management 73
Progress in 2010–11<br />
For the wild rabbits, mortality was 90%<br />
for the parent group (Generation 0) and<br />
80% for the <strong>of</strong>fspring (Generation 1). For<br />
the domestic control rabbits, mortality<br />
was 100% for Generation 0 and 95% for<br />
Generation 1.<br />
From the six surviving wild rabbits, a<br />
new generation <strong>of</strong> young rabbits has<br />
been bred to be tested later in 2011. It is<br />
expected that this group (Generation 2)<br />
will have a lower mortality than the two<br />
previous generations.<br />
Funding in 2010–11<br />
Queensland Government<br />
Collaborators<br />
• Brian Cooke (Invasive Animals<br />
Cooperative Research Centre;<br />
University <strong>of</strong> Canberra)<br />
• Greg Mutze, Ron Sinclair and John<br />
Kovalivski (Biosecurity SA)<br />
More information<br />
Key publications<br />
Cooke, BD, Elsworth, PG, Berman, DM,<br />
McPhee, SR, Kovalivski, J, Mutze, GJ,<br />
Sinclair, RG & Capucci, L 2007, Rabbit<br />
haemorrhagic disease: wild rabbits show<br />
resistance to infection with Czech strain<br />
351 RHDV initially released in Australia,<br />
Report submitted to Australian Wool<br />
Innovation and Meat and Livestock<br />
Australia, Invasive Animals Cooperative<br />
Research Centre, Canberra.<br />
Story, G, Berman, D, Palmer, R &<br />
Scanlan, J 2004, ‘The impact <strong>of</strong> rabbit<br />
haemorrhagic disease on wild rabbit<br />
(Oryctolagus cuniculus) populations in<br />
Queensland’, Wildlife Research 31(2):<br />
183–93.<br />
For further information on this research<br />
project and access to key publications,<br />
visit the invasive plant and animal science<br />
pages on the Biosecurity Queensland<br />
website at www.biosecurity.qld.gov.au<br />
74 <strong>Technical</strong> <strong>highlights</strong>: research projects 2010–11
Part 4 Research services<br />
33. Pest management chemistry<br />
Project dates<br />
Ongoing<br />
Project leader<br />
Lesley Ruddle<br />
Health and Food Sciences Precinct<br />
Tel: (07) 3276 6112<br />
Email: lesley.ruddle@deedi.qld.gov.au<br />
Other staff in 2010–11<br />
Alyson Weier and Emily Strong<br />
Objectives<br />
• Provide advice on the use, impact<br />
and environmental toxicology <strong>of</strong><br />
vertebrate pesticides and herbicides to<br />
support their effective and responsible<br />
use to manage pest animal and weed<br />
populations.<br />
• Manufacture and monitor the quality<br />
<strong>of</strong> chemical pest control products<br />
used to manage pest animal and weed<br />
populations.<br />
• Undertake chemical ecology research<br />
and analysis on pest populations.<br />
Rationale<br />
This project provides chemistry services<br />
as required to science, policy and<br />
operational activities within Biosecurity<br />
Queensland’s Invasive Plants and<br />
Animals program.<br />
Methods<br />
We provide chemical advice and support<br />
to pest management in Queensland<br />
and undertake toxicological and<br />
ecotoxicological investigations relating<br />
to the use <strong>of</strong> vertebrate pesticides using<br />
the laboratory and formulation facilities<br />
at the Health and Food Sciences Precinct<br />
at Coopers Plains.<br />
We carry out tests using appropriate<br />
methodology dictated by the client and<br />
the research direction. The laboratory<br />
operates within a quality assurance<br />
framework and maintains analytical<br />
methods for a range <strong>of</strong> vertebrate<br />
pesticide and herbicide formulations.<br />
Progress in 2010–11<br />
Ecotoxicology<br />
We completed determinations <strong>of</strong> 1080<br />
(sodium fluoroacetate) residues in 70<br />
fox baits for the Tasmanian Government<br />
<strong>Department</strong> <strong>of</strong> <strong>Primary</strong> <strong>Industries</strong>, Parks,<br />
Water and Environment for input into<br />
a model describing the degradation <strong>of</strong><br />
1080 baits in the environment. Further<br />
analyses will continue in 2011–12.<br />
Forensic toxicology<br />
Over the year, our laboratory performed<br />
80 investigations relating to possible<br />
fluoroacetate poisoning, 43 relating<br />
to possible strychnine poisoning,<br />
32 relating to possible anticoagulant<br />
poisoning and 5 relating to possible<br />
metaldehyde (molluscicide) poisoning.<br />
Most investigations related to domestic<br />
dogs and cats, but some involved<br />
wildlife (macropods). Our laboratory also<br />
conducted total iodine analysis on<br />
17 samples relating to animal health.<br />
Formulation chemistry<br />
During the year our formulation<br />
facility produced 840 L <strong>of</strong> 1080 pig bait<br />
(36 g L –1 ) solution in accordance with<br />
the upcoming APVMA registration.<br />
The department maintains a strong<br />
testing program to ensure that sodium<br />
fluoroacetate baiting in Queensland<br />
meets agreed standards. Testing <strong>of</strong><br />
post-preparation sodium fluoroacetate<br />
solutions and meat baits continued<br />
throughout the year. Additional testing<br />
<strong>of</strong> sodium fluoroacetate and rodenticide<br />
formulations was undertaken for<br />
industry.<br />
We provided further concentration data<br />
on a number <strong>of</strong> herbicide formulations<br />
used in the control <strong>of</strong> invasive weeds.<br />
Funding in 2010–11<br />
• Land Protection Fund ($165 000)<br />
• Queensland Government<br />
• Fee for service ($24 000)<br />
Part 4 Research services 75
34. Chemical registration: providing tools for invasive pest control<br />
Project dates<br />
Ongoing<br />
Project leader<br />
David Holdom<br />
Ecosciences Precinct<br />
Tel: (07) 3255 4475<br />
Email: david.holdom@deedi.qld.gov.au<br />
Other staff in 2010–11<br />
Joe Vitelli<br />
Objective<br />
Ensure that pesticides used for invasive<br />
plant and animal control are available<br />
and meet Australian regulatory<br />
requirements.<br />
Rationale<br />
Biosecurity Queensland currently holds a<br />
range <strong>of</strong> permits for the use <strong>of</strong> pesticides<br />
to control invasive plants and animals.<br />
The need for permits has increased as<br />
pesticide registrants focus primarily<br />
on crop protection (with consequent<br />
greater economic returns) rather than on<br />
environmental protection. This means<br />
that registered chemicals are less likely<br />
to be available for controlling invasive<br />
plant and animal species.<br />
Methods<br />
Applications to obtain registrations<br />
or permits for pesticide use follow<br />
guidelines laid down by APVMA. The<br />
volume <strong>of</strong> information required varies<br />
depending on whether the chemical is<br />
already registered or allowed for another<br />
use, or is a new pesticide. Information<br />
may be required relating to:<br />
• the chemistry and manufacture <strong>of</strong> the<br />
pesticide<br />
• its toxicology, including its<br />
metabolism and kinetics<br />
• likely crop and environmental<br />
residues<br />
• occupational health and safety,<br />
associated with both its manufacture<br />
and its use<br />
• its impact on the environment<br />
• its efficacy and safety in use<br />
• trade implications associated with the<br />
intended use.<br />
While Biosecurity Queensland has<br />
primary responsibility for some<br />
pesticides, such as sodium fluoroacetate<br />
(1080), the project focuses on obtaining<br />
<strong>of</strong>f-label permits for registered<br />
chemicals already in the marketplace.<br />
As a consequence, investigations are<br />
normally restricted to likely crop and<br />
environmental residues, impact on the<br />
environment, and efficacy and safety in<br />
the use <strong>of</strong> a pesticide in a new situation<br />
or for a new pest. Project staff work with<br />
other scientists to ensure that data is<br />
available to address these issues and that<br />
any studies conducted for regulatory<br />
purposes meet APVMA requirements<br />
and guidelines.<br />
Progress in 2010–11<br />
During the past year the following minor<br />
use permits were renewed or obtained:<br />
• PER12202, obtained for the use<br />
<strong>of</strong> registered products containing<br />
glyphosate (360 g L –1 or 450 g L –1 ),<br />
fluazifop (128 or 212 g L –1 ) or<br />
flupropanate (745 g L –1 ) as active<br />
ingredients to control tussock grasses<br />
(Nasella spp.) in non-crop situations<br />
• PER12139, renewed for the use <strong>of</strong><br />
registered products containing<br />
fluroxypyr (333 g L –1 ), glyphosate<br />
(360 g L –1 ), imazapyr (250 g L –1 ),<br />
triclopyr (240 g L –1 ) + picloram<br />
(120 g L –1 ) or triclopyr (200 g L –1 )<br />
+ picloram (100 g L –1 ) as active<br />
ingredients to control pond apple<br />
(Annona glabra)<br />
• PER12436, obtained for the use<br />
<strong>of</strong> registered products containing<br />
imazapyr (250 g L –1 ), metsulfuronmethyl<br />
(600 g L –1 ), picloram (43 g L –1<br />
in a gel formulation) or triclopyr<br />
(600 g L –1 ) as active ingredients to<br />
control gingers (Hedychium spp.) in<br />
non-crop situations<br />
• PER11540, obtained for the use<br />
<strong>of</strong> registered products containing<br />
haloxyfop (540 g L –1 ) as an active<br />
ingredient to control hymenachne<br />
(Hymenachne spp.) in nonagricultural<br />
areas, native vegetation,<br />
pasture and aquatic areas<br />
• PER12497, renewed for the use <strong>of</strong><br />
registered products containing<br />
imazapyr (250 g L –1 ), metsulfuronmethyl<br />
(600 g L –1 ) or triclopyr<br />
(240 g L –1 ) + picloram (120 g L –1 ) as<br />
active ingredients to control calotrope<br />
(Calotropis procera) in non-crop<br />
situations<br />
• PER12520, obtained for the use <strong>of</strong><br />
registered products containing 2,4-D<br />
(500 or 625 g L –1 ), 2,4-D (300 g L –1 )<br />
+ picloram (75 g L –1 ), metsulfuronmethyl<br />
(600 g L –1 ), triclopyr<br />
(300 g L –1 ) + picloram (100 g L –1 )<br />
or triclopyr (300 g L –1 ) + picloram<br />
(100 g L –1 ) + aminopyralid (8 g L –1 )<br />
as active ingredients to control bitter<br />
weed (Helenium amarum) in pastures,<br />
stock routes, roadside verges and noncrop<br />
situations<br />
• PER12729, renewed for the use <strong>of</strong><br />
1080 (sodium fluoroacetate) to control<br />
feral cats (Felis catus) in forests,<br />
pastures, and non-crop, pre-plant and<br />
fallow land<br />
• PER12745, obtained for the use <strong>of</strong><br />
alphachloralose to control any species<br />
<strong>of</strong> exotic bird not already established<br />
in Queensland that has the potential<br />
to become a pest.<br />
An emergency permit (PER12644) for<br />
use <strong>of</strong> alphachloralose by authorised<br />
persons to control house crows (Corvus<br />
splendens) was also obtained.<br />
Funding in 2010–11<br />
• Queensland Government<br />
• Land Protection Fund<br />
76 <strong>Technical</strong> <strong>highlights</strong>: research projects 2010–11
Appendixes<br />
1. Abbreviations<br />
ANOVA<br />
APVMA<br />
ARC‑PPRI<br />
CABI Europe–UK<br />
CSIRO<br />
CWTA<br />
DAFF<br />
DEEDI<br />
DERM<br />
DDMRB<br />
DNA<br />
GPS<br />
MLA<br />
NRETAS<br />
ppmv<br />
QMDC<br />
RCV‑A1<br />
RHDV<br />
TWRC<br />
WONS<br />
analysis <strong>of</strong> variance<br />
Australian Pesticides and Veterinary Medicines Authority<br />
Agricultural Research Council—Plant Protection Research Institute (South Africa)<br />
CABI Europe – United Kingdom<br />
Commonwealth Scientific and Industrial Research Organisation<br />
Centre for Wet Tropics Agriculture<br />
(Australian Government) <strong>Department</strong> <strong>of</strong> Agriculture, Fisheries and Forestry<br />
(Queensland Government) <strong>Department</strong> <strong>of</strong> Employment, Economic Development and Innovation<br />
(Queensland Government) <strong>Department</strong> <strong>of</strong> Environment and Resource Management<br />
Darling Downs – Moreton Rabbit Board<br />
deoxyribonucleic acid<br />
global positioning system<br />
Meat and Livestock Australia<br />
(Northern Territory Government <strong>Department</strong> <strong>of</strong>) Natural Resources, Environment, The Arts and Sport<br />
parts per million by volume<br />
Queensland Murray–Darling Committee<br />
rabbit calicivirus strain A1<br />
rabbit haemorrhagic disease virus<br />
Tropical Weeds Research Centre<br />
Weed(s) <strong>of</strong> National Significance<br />
Appendixes 77
2. Species<br />
Scientific name Common name<br />
Acacia nilotica prickly acacia<br />
Acacia auriculiformis, A. catechu, A. deanei,<br />
A. farnesiana, A. glauca, A. ferruginea, A. latronum,<br />
A. leucophloea, A. mellifera, A. planifrons, A. pringlei,<br />
A. sutherlandii and A. tortilis<br />
various acacia species<br />
Aceria lantanae lantana budmite<br />
Actinote anteas mikania butterfly<br />
Actinote thalia pyrrha mikania butterfly<br />
Agonosoma trilineatum bellyache bush jewel bug<br />
Alcidodes sedi mother-<strong>of</strong>-millions weevil<br />
Alternanthera philoxeroides alligator weed<br />
Anacardium occidentale cashew<br />
Andropogon gayanus gamba grass<br />
Annona glabra pond apple<br />
Anomalococcus indicus babul scale<br />
Anredera cordifolia Madeira vine<br />
Aquila audax wedge-tailed eagle<br />
Azadirachta indica neem<br />
Basella alba Ceylon spinach<br />
Bryophyllum spp. mother-<strong>of</strong>-millions<br />
Cabomba caroliniana cabomba<br />
Calotropis procera and C. gigantea calotrope (rubber bush)<br />
Calycomyza lantanae lantana leaf-mining fly<br />
Canis lupus familiaris and C. l. dingo wild dog<br />
Carmenta ithacae parthenium clear-wing moth<br />
Carvalhotingis visenda cat’s claw creeper leaf-sucking tingid<br />
Cascabela thevetia Captain Cook tree (yellow oleander)<br />
Cecropia peltata Mexican bean tree<br />
Cecropia palmata trumpet tree<br />
Cenchrus ciliaris buffel grass<br />
Chromolaena odorata chromolaena (Siam weed)<br />
Clidemia hirta clidemia (Koster’s curse)<br />
Conotrachelus albocinereus parthenium stem-galling weevil<br />
Corvus coronoides Australian raven<br />
Corvus splendens house crow<br />
Cylindropuntia fulgida coral cactus<br />
Cylindropuntia kleinae candle cholla<br />
Cylindropuntia rosea Hudson pear<br />
Cyperus aromaticus navua sedge<br />
78 <strong>Technical</strong> <strong>highlights</strong>: research projects 2010–11
Scientific name Common name<br />
Dactylopius tomentosus cochineal insect<br />
Delonix regia poinciana<br />
Dereodus denticollis leaf-feeding weevil<br />
Echeveria spp. echeveria<br />
Epiblema strenuana parthenium stem-galling moth<br />
Felis catus feral cat<br />
Gmelina elliptica badhara bush<br />
Gymnocoronis spilanthoides Senegal tea<br />
Gymnorhina tibicen Australian magpie<br />
Haliastur sphenurus whistling kite<br />
Hedychium spp. gingers<br />
Helenium amarum bitter weed<br />
Hylaeogena jureceki leaf-mining buprestid beetle<br />
Hymenachne spp. hymenachne<br />
Hypocosmia pyrochroma cat’s claw creeper leaf-tying moth<br />
Isturgia disputaria semi lopper<br />
Jatropha gossypiifolia bellyache bush<br />
Jatropha curcas physic nut<br />
Jatropha integerrima peregrina<br />
Jatropha multifida coral plant<br />
Jatropha podagrica buddha belly plant<br />
Kalanchoe blossfeldiana, K. crenata and K. spathulata kalanchoe<br />
Lantana camara lantana<br />
Leucaena leucocephala ssp. glabrata leucaena<br />
Limnocharis flava limnocharis (yellow burhead)<br />
Macfadyena unguis-cati cat’s claw creeper<br />
Mangifera indica mango<br />
Mayaca fluviatilis bog moss<br />
Miconia calvescens, M. nervosa and M. racemosa miconia<br />
Mikania micrantha mikania vine (mile-a-minute)<br />
Milvus migrans black kite<br />
Mimosa pigra mimosa<br />
Nassella spp. tussock grasses<br />
Nassella tenuissima Mexican feather grass<br />
Neptunia plena and N. oleracea water mimosa<br />
Ophiomyia camarae lantana herringbone leaf-mining fly<br />
Opuntia tomentosa velvety tree pear<br />
Orobanche ramosa branched broomrape<br />
Appendixes 79
Scientific name Common name<br />
Oryctolagus cuniculus rabbit<br />
Osphilia tenuipes mother-<strong>of</strong>-millions weevil<br />
Parsonsia straminea monkey rope vine (silk pod vine)<br />
Parthenium hysterophorus parthenium<br />
Passiflora suberosa corky passionflower<br />
Phakopsora jatrophicola jatropha rust fungus<br />
Phenrica sp. Madeira vine leaf beetle<br />
Phycita sp. leaf-webbing caterpillar<br />
Phyla canescens lippia<br />
Piper nigrum black pepper<br />
Plectonycha correntina Madeira vine leaf beetle<br />
Prosopis pallida mesquite<br />
Puccinia lantanae lantana rust<br />
Puccinia xanthii var. parthenii-hysterophorae parthenium summer rust<br />
Puccinia spegazzinii mikania rust<br />
Ravenelia acacia-arabicae prickly acacia gall-inducing rust<br />
Ravenelia evansii prickly acacia leaf rust<br />
Scirtothrips aurantii South African citrus thrips<br />
Smilax australis barbed wire vine<br />
Sus scr<strong>of</strong>a feral pig<br />
Tecoma stans yellow bells<br />
Themeda quadrivalvis grader grass<br />
Uroplata girardi lantana leaf-mining beetle<br />
Varanus gouldii Gould’s goanna<br />
Varanus varius lace monitor<br />
Verbena <strong>of</strong>ficinalis var. africana and var. gaudichaudii verbena<br />
Ziziphus mauritiana chinee apple<br />
80 <strong>Technical</strong> <strong>highlights</strong>: research projects 2010–11