MySQL OLTP (Transactional) - Hammerora - SourceForge
MySQL OLTP (Transactional) - Hammerora - SourceForge
MySQL OLTP (Transactional) - Hammerora - SourceForge

Create successful ePaper yourself
Turn your PDF publications into a flip-book with our unique Google optimized e-Paper software.
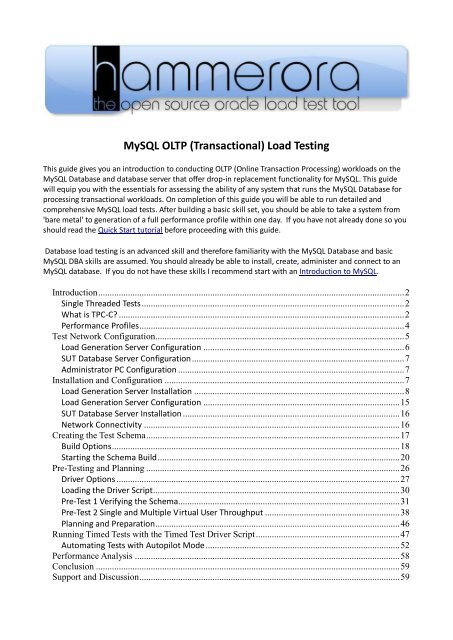
<strong>MySQL</strong> <strong>OLTP</strong> (<strong>Transactional</strong>) Load Testing<br />
This guide gives you an introduction to conducting <strong>OLTP</strong> (Online Transaction Processing) workloads on the<br />
<strong>MySQL</strong> Database and database server that offer drop-in replacement functionality for <strong>MySQL</strong>. This guide<br />
will equip you with the essentials for assessing the ability of any system that runs the <strong>MySQL</strong> Database for<br />
processing transactional workloads. On completion of this guide you will be able to run detailed and<br />
comprehensive <strong>MySQL</strong> load tests. After building a basic skill set, you should be able to take a system from<br />
'bare metal' to generation of a full performance profile within one day. If you have not already done so you<br />
should read the Quick Start tutorial before proceeding with this guide.<br />
Database load testing is an advanced skill and therefore familiarity with the <strong>MySQL</strong> Database and basic<br />
<strong>MySQL</strong> DBA skills are assumed. You should already be able to install, create, administer and connect to an<br />
<strong>MySQL</strong> database. If you do not have these skills I recommend start with an Introduction to <strong>MySQL</strong>.<br />
Introduction ...................................................................................................................................... 2<br />
Single Threaded Tests ................................................................................................................... 2<br />
What is TPC-C? ............................................................................................................................. 2<br />
Performance Profiles .................................................................................................................... 4<br />
Test Network Configuration ............................................................................................................. 5<br />
Load Generation Server Configuration ........................................................................................ 6<br />
SUT Database Server Configuration ............................................................................................. 7<br />
Administrator PC Configuration ................................................................................................... 7<br />
Installation and Configuration ......................................................................................................... 7<br />
Load Generation Server Installation ............................................................................................ 8<br />
Load Generation Server Configuration ...................................................................................... 15<br />
SUT Database Server Installation ............................................................................................... 16<br />
Network Connectivity ................................................................................................................ 16<br />
Creating the Test Schema ............................................................................................................... 17<br />
Build Options .............................................................................................................................. 18<br />
Starting the Schema Build .......................................................................................................... 20<br />
Pre-Testing and Planning ............................................................................................................... 26<br />
Driver Options ............................................................................................................................ 27<br />
Loading the Driver Script ............................................................................................................ 30<br />
Pre-Test 1 Verifying the Schema................................................................................................. 31<br />
Pre-Test 2 Single and Multiple Virtual User Throughput ........................................................... 38<br />
Planning and Preparation ........................................................................................................... 46<br />
Running Timed Tests with the Timed Test Driver Script ............................................................... 47<br />
Automating Tests with Autopilot Mode ..................................................................................... 52<br />
Performance Analysis .................................................................................................................... 58<br />
Conclusion ..................................................................................................................................... 59<br />
Support and Discussion .................................................................................................................. 59
Introduction<br />
In this introduction we give an an overview of the correct approach to take for <strong>MySQL</strong> load testing and<br />
discuss the tests that <strong>Hammerora</strong> implements.<br />
Single Threaded Tests<br />
Historically user database performance tests were often conducted with simple scripts and using the time<br />
to completion for a simple select statement, function or Cartesian join as a prediction of CPU performance ,<br />
for example:<br />
mysql> select count(*) from information_schema.columns;<br />
+----------+<br />
| count(*) |<br />
+----------+<br />
| 736 |<br />
+----------+<br />
1 row in set (0.11 sec)<br />
mysql> select count(*) from information_schema.columns a,<br />
information_schema.columns b, information_schema.columns c;<br />
+-----------+<br />
| count(*) |<br />
+-----------+<br />
| 398688256 |<br />
+-----------+<br />
1 row in set (10.65 sec)<br />
The challenge was that such a statement runs as single-threaded and therefore was valid in the era of<br />
single-core processors to test the performance of one processor but became obsolete in the era of multicore<br />
processors. In other words with an example eight core processor such a test would give indications on<br />
the performance of one core and leave the other cores idle testing only a fraction of the performance<br />
potential of the CPU as a whole. Additionally such tests focused on CPU performance only without testing<br />
any of the storage component. Such a simple approach is flawed and to test a multiple CPU or multicore<br />
database environment requires a multithreaded test framework. Fortunately <strong>Hammerora</strong> is multi-threaded<br />
and therefore ready to test your multi-core environments with multiple virtual users all interacting<br />
independently with the database simultaneously.<br />
What is TPC-C?<br />
Designing and implementing a benchmark is a significant challenge. Many performance tests and tools<br />
experience difficulties in comparing system performance especially in the area of scalability, the ability of a<br />
test conducted on a certain system and schema size to be comparable with a test on a larger scale system.<br />
When system vendors wish to publish benchmark information about database performance they have long<br />
had to access to such sophisticated test specifications to do so. In particular all major database vendors<br />
recognise the TPC-C as the standard for Online Transaction Processing, the type of workload we are looking<br />
to simulate. Fortunately the “TPC benchmarks are industry standards. The TPC, at no charge, distributes its<br />
benchmark specifications to the public.” For this reason <strong>Hammerora</strong> includes an implementation of the<br />
specification of the TPC-C benchmark that can be run in any <strong>MySQL</strong> environment. This implementation has<br />
the significant advantage that you know that the test is reliable, scalable and tested to produce consistent
esults. It is important to emphasise that the implementation is not a full specification TPC-C benchmark<br />
and the transaction results cannot be compared with the official published benchmarks in any way. Instead<br />
the implementations in <strong>Hammerora</strong> take the best designed specifications for a database transactional<br />
workload available in the world and enable you to run an accurate and repeatable workload against your<br />
own <strong>MySQL</strong> database. Audited TPC-C benchmarks are extremely costly and time consuming to establish and<br />
maintain, the <strong>Hammerora</strong> implementation of the TPC-C benchmarks is designed to capture the essence of<br />
TPC-C in a form that can be run at low cost bringing professional load testing to all <strong>MySQL</strong> environments.<br />
TPC-C implements a computer system to fulfil orders from customers to supply products from a company.<br />
The company sells 100,000 items and keeps its stock in warehouses. Each warehouse has 10 sales districts<br />
and each district serves 3000 customers. The customers call the company whose operators take the order,<br />
each order containing a number of items. Orders are usually satisfied from the local warehouse however a<br />
small number of items are not in stock at a particular point in time and are supplied by an alternative<br />
warehouse. Figure 1 shows this company structure.<br />
Figure 1 TPC-C Company Structure<br />
It is important to note that the size of the company is not fixed and can add Warehouses and sales districts<br />
as the company grows. For this reason your test schema can be as small or large as you wish with a larger<br />
schema requiring a more powerful computer system to process the increased level of transactions. Figure 2<br />
shows the TPC-C schema, in particular note how the number of rows in all of the tables apart from the ITEM<br />
table which is fixed is dependent upon the number of warehouses you choose to create your schema.
Figure 2 TPC-C Schema<br />
For additional clarity please note that the term Warehouse in the context of TPC-C bears no relation to a<br />
Data Warehousing workload, TPC-C defines a transactional based system and not a decision support (DSS)<br />
one.<br />
In addition to the computer system being used to place orders it also enables payment and delivery of<br />
orders and the ability to query the stock levels of warehouses. Consequently the workload is defined by a<br />
mix of 5 transactions as follows:<br />
New-order: receive a new order from a customer: 45%<br />
Payment: update the customers balance to record a payment: 43%<br />
Delivery: deliver orders asynchronously: 4%<br />
Order-status: retrieve the status of customer’s most recent order: 4%<br />
Stock-level: return the status of the warehouse’s inventory: 4%<br />
Performance Profiles<br />
For an official audited TPC-C benchmark the result of the tests is detailed as tpmC which represents the<br />
number of New Orders processed only. One particular advantage of <strong>Hammerora</strong> is is the ability to generate<br />
a performance profile as the load increases on your system. Whereas an official TPC-C benchmark gives you<br />
a single data-point and a typical single-threaded test (such as timing SQL Statements) also gives you a single<br />
data-point. Consider the graph shown in figure 3.
Figure 3 Performance Profile Example<br />
This graph shows the performance of a real tests on a <strong>MySQL</strong> configuration. If observed as a single data<br />
point the tenth data point from the right shows the highest performance. However the performance profile<br />
shows a point beyond this at which performance starts to reduce as utilisation increases. The best returns<br />
from System A will be to keep utilisation within or below the bounds of optimal performance. It should be<br />
clear that your testing goal should be to measure the performance profile of your system across all levels of<br />
utilisation.<br />
Test Network Configuration<br />
As shown in figure 4 the network architecture required for <strong>Hammerora</strong> is both simple and straightforward.<br />
You require the database server to be tested known as the system under test (SUT) installed and configured<br />
with the <strong>MySQL</strong> database. You also require a load generation server to run <strong>Hammerora</strong> installed with the<br />
<strong>Hammerora</strong> software and a <strong>MySQL</strong> client. Typically the administrator will monitor and manage the load<br />
testing from a separate notebook or PC. All systems will be connected across a network. Technically it is<br />
possible to run <strong>Hammerora</strong> on the SUT however this is not recommended. Firstly it makes it comparatively<br />
harder to distinguish between the load generation server workload and the database workload. Secondly<br />
running the <strong>Hammerora</strong> workload will skew the results. By eliminating the network component of the<br />
workload results for a smaller number of virtual users will be comparatively higher however as the workload<br />
increases performance will be comparatively lower. To eliminate this skew in results a dedicated load
generation server should be used.<br />
Figure 4 <strong>Hammerora</strong> Network Architecture<br />
Load Generation Server Configuration<br />
The most important component of the load generation server is the server processor. It is recommend to<br />
use an up to date multicore and multithreaded processor. <strong>Hammerora</strong> is a multithreaded application and<br />
implicitly benefits from a multicore server CPU such as the Intel Xeon 5XXX series range. To determine<br />
whether CPU capacity is sufficient for testing you can monitor the CPU utilisation with utilities such as top<br />
on Linux or Task Manager on Windows during testing. CPU utilisation reaching 100% is an indication that<br />
the CPU on the load generation server is limiting performance. It is important to note however that<br />
<strong>Hammerora</strong> is highly efficient and a high-performance multicore processor such as the Xeon 55XX and<br />
upwards will likely only see utilisation in the 10% range to drive a much larger database server to 100%<br />
utilisation. For the load generation memory requirement a rough guide is that <strong>Hammerora</strong> requires<br />
approximately 10MB for the application and 2MB per virtual user, for example 64 virtual users will need<br />
138MB of memory. Again this represents a highly efficient load testing environment in comparison to<br />
commercial database load testing applications. Consequently it is it is entirely feasible to load test with a 32bit<br />
x86 operating system on the load generation client with a 64-bit operating system only required when<br />
conducting tests in excess of 1000 virtual users. For the load testing operating system, <strong>Hammerora</strong> is<br />
available pre-compiled for 32-bit Windows, 32-bit Linux and 64-bit Linux however you may compile the<br />
packages used for <strong>Hammerora</strong> manually for another operating system if you wish. <strong>Hammerora</strong> is a graphical<br />
application and therefore on Linux the operating system installation must include the X-windows packages.<br />
Storage requirements on the load generation server are minimal and all modern servers are likely to meet
the storage required. <strong>Hammerora</strong> consumes approximately 15MB of disk space and you will also need an<br />
<strong>MySQL</strong> client. All <strong>MySQL</strong> database installations include a <strong>MySQL</strong> client and therefore the <strong>MySQL</strong> client will<br />
often be the same <strong>MySQL</strong> software that you have installed on the server as this also includes the client<br />
libraries that <strong>Hammerora</strong> requires. The load generation server does not need to be running the same<br />
version of <strong>MySQL</strong>, however <strong>Hammerora</strong> does require <strong>MySQL</strong> 5.1 upwards for the correct version of the<br />
client libraries. You should note that a load generation server built with Linux or Windows will be able to<br />
connect to and test a <strong>MySQL</strong> Database running on any operating system you choose.<br />
SUT Database Server Configuration<br />
The database server architecture to be tested must meet the standard requirements for a <strong>MySQL</strong> Database<br />
Server. <strong>MySQL</strong> can be installed on any supported operating system, there is no restriction on the version of<br />
<strong>MySQL</strong> that is required. To run a <strong>Hammerora</strong> transactional load test there are minimum requirements in<br />
memory and I/O (disk performance) to prevent these components being a bottleneck on performance. In<br />
turn the memory and I/O is determined by the capabilities of the CPUs installed. For a test database that<br />
requires the minimal level of memory and I/O and therefore keying and thinking time is set to FALSE (keying<br />
and thinking time is detailed later in this guide) you should aim to create a database with approximately a<br />
factor of 5 warehouses multiplied by the number of cores/threads (threads refers to Hyper Threads, so if a<br />
processor has 4 cores but supports 8 Hyper Threads then the value of 8 should be used) supported by<br />
system processor rounded up to the nearest 100. For example for a system with 64 threads, 64 * 5 = 320,<br />
rounded up to 400. A system with 24 threads would be configured with 200 warehouses. To calculate the<br />
disk storage required by your test database allow a minimum of 100MB per warehouse plus 50% for<br />
additional growth. For the example system that supports 64 threads that would be 60GB of storage space.<br />
You should have sufficient memory to cache as much of your test database in memory as possible without<br />
factoring in the additional storage for growth therefore for 64 threads a minimum memory requirement for<br />
the db_cache_size parameter would be 40GB. Reductions in memory will place more emphasis on the I/O<br />
performance. The database server should be connected to external storage typically in the form of a SAN or<br />
NAS. A database server without external storage will not sustain the level of I/O throughput necessary to<br />
conduct a load test. I recommend SSD disks to minimise the risk of I/O constraining performance and a RAID<br />
configuration of 8 SSD disks is a good minimum configuration. For hard disks a minimum configuration of 12<br />
disk drives is recommended. Where possible RAID 0 should be used to maximise the potential performance<br />
of the disk drives available. If your I/O configuration does not meet minimum requirements it is worthwhile<br />
taking a moment to question whether to proceed with a performance test that will result in a conclusion<br />
that the storage is inadequate. For transactional tests I/O should be configured in particular to maximize<br />
write performance to the log files, depending on the performance of your processors you should allow for<br />
the largest log files possible. You should consider that the log files of drop-in replacement databases for<br />
<strong>MySQL</strong> may have larger limits thereby offering improved performance. There is less emphasis on the<br />
storage performance of the data files provided that enough memory is available to cache the test database<br />
and database checkpoints are not frequent during the test. It is worth reiterating that these guidelines<br />
define the minimum requirements for testing and you should aim for your SUT to exceed these minimum<br />
standards where possible. In particular where you are using keying and thinking times the number of<br />
virtual users required and the memory and I/O requirements will increase considerably.<br />
Administrator PC Configuration<br />
The administrator PC has the minimal requirement to display the graphical output from the load generation<br />
server. for example for a Linux load generation server the ability to display X windows. The PC should also<br />
have the ability to connect to the SUT to monitor performance by the installation of a <strong>MySQL</strong> client.<br />
Installation and Configuration
This sections describes the procedure to install and configure the Load Generation Server and the SUT<br />
Database Server.<br />
Load Generation Server Installation<br />
On the Load Generation Server you must have already installed the <strong>MySQL</strong> client software and once<br />
<strong>Hammerora</strong> is installed it must know where to find the client libraries. The <strong>MySQL</strong> client software is also<br />
included in a <strong>MySQL</strong> database software installation. On Linux the important environment variables are<br />
PATH and LD_LIBRARY_PATH which should be set to the location of the <strong>MySQL</strong> client library. The <strong>MySQL</strong><br />
client library will be found in the <strong>MySQL</strong> lib directory such as the /usr/local/mysql/ lib directory. Once done<br />
so <strong>Hammerora</strong> will be able to find the client library such as shown example:<br />
/usr/local/mysql/lib/libmysqlclient.so.16<br />
After installation on starting <strong>Hammerora</strong> if the client library is not accessible <strong>Hammerora</strong> will report an<br />
error. This must be resolved before <strong>Hammerora</strong> will interact with a <strong>MySQL</strong> environment. Ensure however<br />
that the error reported relates to the <strong>MySQL</strong> libraries. <strong>Hammerora</strong> will report an error when it cannot find<br />
either the Oracle or <strong>MySQL</strong> libraries and therefore when testing <strong>MySQL</strong> the error related to finding Oracle<br />
libraries can be safely ignored.<br />
On Windows the PATH environment variable is important and can be set on your System Properties,<br />
Advanced Tab as shown in figure 5.
Figure 5 Windows Environment Variables<br />
Note that with a graphical <strong>MySQL</strong> install the installer gives you the option of setting the PATH environment<br />
variable automatically.<br />
Once you have installed your <strong>MySQL</strong> client download <strong>Hammerora</strong> from Sourceforge here:<br />
http://sourceforge.net/projects/hammerora/<br />
The page will show you the right version for your operating system. If you need a different version click<br />
“view all files”. For Linux make sure that you have the correct version for your 32-bit or 64-bit Linux<br />
operating system respectively. If you have a 32-bit operating system you will need the<br />
hammerora-2.5-Linux-x86 package<br />
If you have a 64-bit operating system you will need the<br />
hammerora-2.5-Linux-x86-64 package<br />
Make sure that you use the correct version the 32-bit install will not function on 64-bit and Vice Versa.<br />
On Linux <strong>Hammerora</strong> should be installed as the mysql user, the same user that owns the <strong>MySQL</strong> software.<br />
To start the installer on Linux make the installer file executable
mysql@test:~> chmod u+x hammerora-2.5-Linux-x86<br />
and run the executable<br />
mysql@test:~> ./hammerora-2.5-Linux-x86<br />
On Windows double-click on the installer file. For Windows 7 if you have the correct permissions to do so<br />
you should right click on the installer and choose the option “Run as Administrator”<br />
The installer will start giving you the option of selecting the installation language shown in figure 6.<br />
Figure 6 Select installation language<br />
You can then choose whether to continue with the installation as shown in figure 7.<br />
Figure 7 Continue?<br />
At the start of the install wizard, click next as shown in figure 8.
Figure 8 Welcome<br />
Choose the destination location as shown in figure 9 and Click Next. To change the default location Click<br />
Browse and select a new location
Figure 9 Choose Destination<br />
Click next as shown in figure 10 to start copying the installation files<br />
Figure 10 Start copying Files
<strong>Hammerora</strong> will be installed in your selected location as shown in figure 11. Note that the installation is<br />
entirely self contained. No software is installed external to the selected directory.<br />
Figure 11 Installing<br />
On the completion screen shown in figure 12 click finish and optionally launch <strong>Hammerora</strong> at this time.
Figure 12 Install Complete<br />
If you opt to launch <strong>Hammerora</strong> as shown in figure 13 a the main application window is displayed
Figure 13 <strong>Hammerora</strong><br />
<strong>Hammerora</strong> is now installed. If you close the application using Flie -> Exit you can restart it again under<br />
Linux by running<br />
./hammerora.tcl as the mysql user or windows by double clicking on hammerora.bat.<br />
Load Generation Server Configuration<br />
All of <strong>Hammerora</strong>’s working data can be set using menu options. However if you wish in the<br />
<strong>Hammerora</strong> home directory there is a configuration file called config.xml that is read on startup. In this<br />
file you can preset your database build and driver configurations by editing the xml file without having<br />
to change the data manually. You should always set the option to <strong>MySQL</strong> with further <strong>MySQL</strong><br />
related choices in the section of the file. If your xml file is well formed your variables will be<br />
applied to <strong>Hammerora</strong> when you selected the menu options.<br />
<br />
<br />
<strong>MySQL</strong><br />
TPC-C<br />
<br />
...
<br />
<br />
127.0.0.1<br />
3306<br />
<br />
<br />
<br />
1<br />
1<br />
root<br />
mysql<br />
tpcc<br />
innodb<br />
<br />
<br />
1000000<br />
false<br />
false<br />
standard<br />
2<br />
5<br />
<br />
<br />
<br />
…<br />
SUT Database Server Installation<br />
Installation and configuration of the <strong>MySQL</strong> Database on your chosen operating system is beyond the scope<br />
of this document. We recommend using one of the many tutorials available on the web for example:<br />
http://dev.mysql.com/doc/refman/5.5/en/installing.html . You should have the <strong>MySQL</strong> database software<br />
installed and running. Make sure you set a password for either the root user or a user with the correct<br />
privileges to create the TPC-C database, for example:<br />
[root@sut bin]# ./mysqladmin -u root password mysql<br />
Network Connectivity<br />
By default a <strong>MySQL</strong> installation will allow connection to the local server only, you must grant permission to<br />
connect to the <strong>MySQL</strong> database from your load generation server, the following example grants all<br />
permissions to the root user on the system called test.example.com.<br />
mysql> grant all on *.* to root@'test.example.com' identified by<br />
'mysql';<br />
Query OK, 0 rows affected (0.00 sec)<br />
mysql> flush privileges;<br />
Query OK, 0 rows affected (0.00 sec)<br />
Alternatively after the test database is created you can restrict the privileges to that databases only.<br />
mysql> grant all on tpcc.* to root@'test.example.com' identified by<br />
'mysql';
When choosing a <strong>MySQL</strong> Server to test note that <strong>Hammerora</strong> load testing can drive your system utilization<br />
to maximum levels and therefore testing an active production system is not recommended. When you have<br />
installed the load generation server and SUT database and have verified that you can communicate<br />
between them by logging in remotely you can proceed to building a test schema.<br />
Creating the Test Schema<br />
To create the <strong>OLTP</strong> test schema based on the TPC-C specification you will need to select which benchmark<br />
and database you wish to use by choosing select benchmark from under the TPC menu. The initial settings<br />
are determined by the values in your config.xml file. Select <strong>MySQL</strong> and TPC-C and press OK as shown in<br />
Figure 14.<br />
Figure 14 Select Benchmark<br />
To create the TPC-C schema select the TPC-C schema options menu tab from the top level TPC menu. This<br />
menu will change dynamically according to your chosen database.<br />
Figure 15 Select Schema Options<br />
The schema options window is divided into two sections. The “Build Options” section details the general<br />
login information and where the database will be built and the “Driver Options” for the Driver Script to run<br />
after the database is built. “Build Options” are of importance at this stage and “Driver Options” will be<br />
considered further in this guide however note that you don’t have to rebuild the database every time you<br />
change the “Driver Options” , once the database has been built only these “Driver Options” may need to be<br />
modified. For the “Build Options” fill in the values according to the database where the database will be<br />
built.
Figure 16 Database Options<br />
Build Options<br />
The Build Option values have the following meanings.<br />
<strong>MySQL</strong> Host<br />
The <strong>MySQL</strong> Host Name is the host name that your load generation server will use to connect to the<br />
database running on the SUT database server. You verified connectivity to this host name previously in this<br />
document.<br />
<strong>MySQL</strong> Port<br />
The <strong>MySQL</strong> Port is the network port that your load generation server will use to connect to the database<br />
running on the SUT database server. In most cases this will be the default port of 3306.<br />
<strong>MySQL</strong> User<br />
The <strong>MySQL</strong> User is the user which has permission to create a database and you previously granted access<br />
to from the load generation server. The root user already exists in all <strong>MySQL</strong> databases and has the<br />
necessary permissions to create the TPC-C database.<br />
<strong>MySQL</strong> User Password<br />
The <strong>MySQL</strong> user password is the password for the user defined as the <strong>MySQL</strong> User. You previously set this<br />
password with the mysqladmin command. You will need to remember the <strong>MySQL</strong> user name and password<br />
for running the TPC-C driver script after the database is built.
<strong>MySQL</strong> Database<br />
The <strong>MySQL</strong> Database is the database that will be created containing the TPC-C schema creation. There<br />
must have sufficient free space for the database to be created.<br />
<strong>Transactional</strong> Storage Engine<br />
The <strong>Transactional</strong> Storage Engine is the name of a Storage Engine that supports transactions. You can query<br />
your <strong>MySQL</strong> database to find the storage engines available as follows:<br />
mysql> show engines \G<br />
*************************** 1. row ***************************<br />
Engine: FEDERATED<br />
Support: NO<br />
Comment: Federated <strong>MySQL</strong> storage engine<br />
Transactions: NULL<br />
XA: NULL<br />
Savepoints: NULL<br />
*************************** 2. row ***************************<br />
Engine: MRG_MYISAM<br />
Support: YES<br />
Comment: Collection of identical MyISAM tables<br />
Transactions: NO<br />
XA: NO<br />
Savepoints: NO<br />
*************************** 3. row ***************************<br />
Engine: MyISAM<br />
Support: YES<br />
Comment: MyISAM storage engine<br />
Transactions: NO<br />
XA: NO<br />
Savepoints: NO<br />
*************************** 4. row ***************************<br />
Engine: BLACKHOLE<br />
Support: YES<br />
Comment: /dev/null storage engine (anything you write to it disappears<br />
Transactions: NO<br />
XA: NO<br />
Savepoints: NO<br />
*************************** 5. row ***************************<br />
Engine: CSV<br />
Support: YES<br />
Comment: CSV storage engine<br />
Transactions: NO<br />
XA: NO<br />
Savepoints: NO<br />
*************************** 6. row ***************************<br />
Engine: MEMORY<br />
Support: YES<br />
Comment: Hash based, stored in memory, useful for temporary tables<br />
Transactions: NO<br />
XA: NO<br />
Savepoints: NO<br />
*************************** 7. row ***************************<br />
Engine: ARCHIVE<br />
Support: YES<br />
Comment: Archive storage engine<br />
Transactions: NO<br />
XA: NO<br />
Savepoints: NO<br />
*************************** 8. row ***************************<br />
Engine: InnoDB<br />
Support: DEFAULT
Comment: Supports transactions, row-level locking, and foreign keys<br />
Transactions: YES<br />
XA: YES<br />
Savepoints: YES<br />
*************************** 9. row ***************************<br />
Engine: PERFORMANCE_SCHEMA<br />
Support: YES<br />
Comment: Performance Schema<br />
Transactions: NO<br />
XA: NO<br />
Savepoints: NO<br />
9 rows in set (0.00 sec)<br />
As shown here in this default installation only the InnoDB storage engine supports transactions and is<br />
therefore the only option available. However with a drop in replacement for <strong>MySQL</strong> you may have other<br />
options available that support transactions such as the Aria or XtraDB Storage Engines, <strong>Hammerora</strong> testing<br />
can help you find the right one for your requirements.<br />
Number of Warehouses<br />
The Number of Warehouses is selected by a slider. For fine-tuning you may click either side of the slider to<br />
move the value by 1. You should set this value to number of warehouses you have chosen for your test<br />
based on the guidance given previously in the section SUT Database Server Configuration.<br />
Virtual Users to Build Schema<br />
The Virtual Users to Build Schema is the number of Virtual Users to be created on the Load Generation<br />
Server that will complete your multi-threaded schema build. You should set this value to either the number<br />
of warehouses you are going to create (You cannot set the number of threads lower than the number of<br />
warehouses value) or the number of cores/Hyper-Threads on your Load Generation Server.<br />
Starting the Schema Build<br />
When you have completed your Build Options click OK to store the values you have entered. For a<br />
permanent record the values can be entered directly into the config.xml file. On starting <strong>Hammerora</strong> the<br />
schema options will already contain the values you have entered in the corresponding fields, for example:<br />
<br />
<br />
1<br />
1<br />
root<br />
mysql<br />
tpcc<br />
innodb<br />
<br />
To begin the schema creation at the buttons in the top level window click the "Create TPC Schema" button.<br />
This button is shown as three coloured boxes and "Create TPC Schema" appears in the information box<br />
when moused over as shown in Figure 17.
Figure 17 Create Schema<br />
On clicking this button a dialogue box such as the one shown in Figure 18 appears.<br />
Figure 18 Confirm Schema<br />
When you click Yes <strong>Hammerora</strong> will login to your chosen <strong>MySQL</strong> host with a monitor thread as your defined<br />
user with the password you have chosen . It will then create the database you have defined and then load<br />
the item table data before waiting and monitoring the other threads. The worker threads will wait for the<br />
monitor thread to complete its initial work. Subsequently the worker threads will create and insert the data<br />
for their assigned warehouses as shown in figure 19. There are no intermediate data files or manual builds<br />
required, <strong>Hammerora</strong> will both create and load your requested data dynamically. Data is inserted in a batch<br />
format for optimal network performance.
Figure 19 Schema Building<br />
When the workers are complete the monitor thread will create the indexes, stored procedures and gather<br />
the statistics. When complete Virtual User 1 will display the message TPCC SCHEMA COMPLETE and all<br />
virtual users will show that they completed their action successfully as shown in figure 20.
Figure 20 Schema Build Complete<br />
Press the button to destroy the virtual users as shown in figure 20 and clear the script editor as shown in<br />
figure 21.
Figure 21 Schema Creation End<br />
The schema build is now complete as an example a 200 warehouse build as follows with nearly 100 million<br />
rows should take approximately half an hour or less to create and insert on an up to date 2 socket Linux<br />
server.<br />
The TPC-C schema creation script is a standard <strong>Hammerora</strong> script like any other so you can save it, modify it<br />
and re-run it just like any other <strong>Hammerora</strong> script. For example if you wish to create more than the 1-5000<br />
warehouses available in the GUI you may notice that the last line in the script calls a procedure with all of<br />
the options that you gave in the schema options. Therefore change the second value to any number you like<br />
to create more warehouses, for example the following will create 10000 warehouses.<br />
do_tpcc sut.example.com 3306 10000 root mysql tpcc innodb 8<br />
Similarly change any other value to modify your script. If you have made a mistake simply close the<br />
application and run the following SQL to undo the database you have created.<br />
SQL>drop database tpcc;<br />
When you have created your schema you can verify the contents with SQL or your favourite admin tool as<br />
the newly created user.<br />
mysql> use tpcc;<br />
Database changed<br />
mysql> show tables;<br />
+----------------+
| Tables_in_tpcc |<br />
+----------------+<br />
| customer |<br />
| district |<br />
| history |<br />
| item |<br />
| new_order |<br />
| order_line |<br />
| orders |<br />
| stock |<br />
| warehouse |<br />
+----------------+<br />
9 rows in set (0.00 sec)<br />
mysql> select * from warehouse limit 1 \G<br />
*************************** 1. row ***************************<br />
w_id: 1<br />
w_ytd: 3000000.00<br />
w_tax: 0.1300<br />
w_name: mBr6dkgK<br />
w_street_1: FH0SO5CUEREo<br />
w_street_2: cBcStSxKcIIs4IAUUsJy<br />
w_city: FKaak9ZBgtJr3Tr6gESW<br />
w_state: Tt<br />
w_zip: 432611111<br />
1 row in set (0.00 sec)<br />
mysql> show indexes from warehouse \G<br />
*************************** 1. row ***************************<br />
Table: warehouse<br />
Non_unique: 0<br />
Key_name: PRIMARY<br />
Seq_in_index: 1<br />
Column_name: w_id<br />
Collation: A<br />
Cardinality: 10<br />
Sub_part: NULL<br />
Packed: NULL<br />
Null:<br />
Index_type: BTREE<br />
Comment:<br />
Index_comment:<br />
1 row in set (0.00 sec)<br />
mysql> select routine_name from information_schema.routines where routine_schema<br />
= 'TPCC';<br />
+--------------+<br />
| routine_name |<br />
+--------------+<br />
| DELIVERY |<br />
| NEWORD |<br />
| OSTAT |<br />
| PAYMENT |<br />
| SLEV |<br />
+--------------+<br />
5 rows in set (0.03 sec)<br />
You can also browse the stored procedures you have created by looking in the creation script. At this point<br />
the data creation is complete and you are ready to start running a performance test. Before doing so it is<br />
worth noting that the schema has been designed in order that you can run multiple tests and it will return
the same results. You therefore do not need to recreate your schema after every run for consistent results.<br />
Conversely if you do wish to recreate your schema for such a reason as you have exhausted your available<br />
tablespace space the results of tests against different sizes are comparable.<br />
Pre-Testing and Planning<br />
After database creation but before you start running measured tests an important phase is pre-testing and<br />
planning. Pre-testing is a phase also known as ‘testing the tests’, in this phase you verify that you have the<br />
optimal system, operating system and <strong>MySQL</strong> configuration which you then document and hold consistent<br />
for a series of tests. Pre-testing enables you to ensure that your configuration is suitable for testing and the<br />
time invested will generate valid results. Pre-testing also enables you to gain familiarity with the<br />
<strong>Hammerora</strong> driver script settings and finally to ‘warm the cache’ by having your schema data cached in the<br />
buffer cache before beginning an extended sequence of tests. Once you are satisfied with your testing<br />
configuration you should then thoroughly plan your measured tests to ensure that all of your tests and<br />
results are fully documented.<br />
To begin pre-testing select the TPC-C schema options menu tab from the top level Benchmark menu and<br />
select the same Schema Options you selected before the schema build as shown in Figure 22.<br />
Figure 22 Select Schema Options<br />
At this stage your focus is now on the options given under the section Driver Options as shown in Figure 23.<br />
Figure 23 Driver Options
Driver Options<br />
Under the Driver Options section you have the following choices:<br />
TPC-C Driver Script<br />
Under TPC-C Driver script you have the option of choosing either the Standard Driver Script or the Timed<br />
Test Driver Script. This choice will dynamically change the Driver Script that is loaded when the TPC-C Driver<br />
Script menu option is chosen. The Standard Driver Script as shown in figure 24 is a script run by all virtual<br />
users. This script should be chosen where you wish to create a load against the database and view the<br />
transaction rate but do not wish to run a timed test or wish to time the tests manually yourself. The<br />
Standard Driver Script may be run with Virtual User Output turned on, which will display all of the<br />
information each virtual users processes or with Virtual User Output turned off to be able to observe the<br />
transaction rate only. Your additional Driver Options choices are populated in the EDITABLE OPTIONS<br />
section.<br />
Figure 24 Standard Driver Script<br />
Instead of the Standard Driver Script you can select the Timed Test Driver Script. As shown in Figure 25 this<br />
produces a number of additional options. You should select the Timed Test Driver Script when you wish to<br />
run timed tests and have <strong>Hammerora</strong> time these tests, measure the results and report on an average<br />
transaction rate for a period of time. With the Timed Test Driver Script the first virtual user will do the<br />
timing and generate the results with the additional virtual users running the workload, therefore you should<br />
always select the number of desired virtual users + 1 when running the Timed Test Driver Script. For<br />
example if you wish to measure a load generated by two virtual users you should select three virtual users<br />
before running the script. Additionally the Timed Test Driver Script is designed to be run with Virtual User<br />
Output enabled, this ensures that the information gathered by the first virtual user on the transaction rates<br />
are correctly reported. Whilst running the Timed Test Driver Script virtual user output for the virtual users<br />
generating the load is suppressed.
Figure 25 AWR Snapshot Driver Script<br />
For both the Standard Driver Script and Timed Test Driver Script the further options selected within the<br />
Schema Options window are entered automatically into the EDITABLE OPTIONS section of the driver script<br />
as follows:<br />
Total Transactions per User<br />
Total transactions per user is reported as total_iterations within the EDITABLE OPTIONS section of the driver<br />
script. This value will set the number of transactions each virtual user will process before logging off. You<br />
can use this value to determine how long the virtual user will remain active for. The length of time for<br />
activity will depend upon the performance of the Database Server under test. A higher performing server<br />
will process the defined number of transactions more quickly than a lower performing one.<br />
It is important to draw the distinction between the total_iterations value and the Iterations value set in the<br />
Virtual User Options window. The Iterations value in the Virtual User Options window determines the<br />
number of times that a script will be run in its entireity. The total_iterations value is internal to the TPC-C<br />
driver script and determines the number of times the internal loop is iterated ie<br />
for {set it 0} {$it < $total_iterations} {incr it} { ... }<br />
In other words if total_iterations is set to 1000 then the executing user will log on once execute 1000<br />
transactions and then log off. If on the other hand Iterations in the Virtual User Options window is set to<br />
1000 and total_iterations in the script set to 1 then the executing user will log on execute one transaction<br />
and then log off 1000 times. For the TPC-C driver script I recommend only modifying the total_iterations<br />
value.<br />
When running the Timed Test Driver Script as the test is timed you should ensure that the number of<br />
transactions is set to a suitably high vale to ensure that the virtual users do not complete their tests before<br />
the timed test is complete, doing so will mean the you will be timing idle virtual users and the results will be<br />
invalid. Consequently it is acceptable when running timed tests to set the Total Transactions per User to a<br />
high value such as 1000000 (now the default value from <strong>Hammerora</strong> 2.5) or more to ensure that the virtual<br />
users continue running for a long period of time, When the test is complete you can stop the test running by<br />
stopping the virtual users.<br />
Exit on <strong>MySQL</strong> Error<br />
Exit on <strong>MySQL</strong> Error is shown as the parameter RAISEERROR in the Driver Script. RAISEERROR impacts the<br />
behaviour of an individual virtual user on detecting a <strong>MySQL</strong> error. If set to TRUE on detecting a <strong>MySQL</strong><br />
error the user will report the error into the <strong>Hammerora</strong> console and then terminate execution. If set to<br />
FALSE the virtual user will ignore the error and proceed with executing the next transaction. It is therefore<br />
important to be aware that if set to FALSE firstly if there has been a configuration error resulting in repeated<br />
errors then the workload might not be reported accurately and secondly you may not be aware of any
occasional errors being reported as they are silently ignored. I recommend running pre-tests with<br />
RAISEERROR set to TRUE to ensure a configuration is valid before setting it to FALSE for a measured test run.<br />
Keying and Thinking Time<br />
Keying and Thinking Time is shown as KEYANDTHINK in the Driver Script. A good introduction to the<br />
importance of keying and thinking time is to read the TPC-C specification. This parameter will have the<br />
biggest impact on the type of workload that your test will take.<br />
TIP: The most common configuration error is to run a test with Keying and Thinking Time set to False with<br />
too many virtual users for the schema created. One virtual user without keying and thinking time will<br />
generate a workload equivalent to many thousands of users with keying and thinking time enabled.<br />
Without keying and thinking time you are likely to see peak performance at or around the number of<br />
cores/Hyper Threads on your Database Server.<br />
Keying and thinking time is an integral part of an offical TPC-C test in order to simulate the effect of the<br />
workload being run by a real user who takes time to key in an actual order and think about the output. If<br />
KEYANDTHINK is set to TRUE each user will simulate this real user type workload. An offical TPC-C<br />
benchmark implements 10 users per warehouse all simulating this real user experience and it should<br />
therefore be clear that the main impact of KEYANDTHINK being set to TRUE is that you will need a<br />
significant number of warehouses and users in order to generate a meaningful workload. and hence an<br />
extensive testing infrastructure. The positive side is that when testing hundreds or thousands of virtual<br />
users you will be testing a workload scenario that will be closer to a real production environment. Whereas<br />
with KEYANDTHINK set to TRUE each user will execute maybe 2 or 3 transactions a minute you should not<br />
underestimate the radical difference that setting KEYANDTHINK to FALSE will have on your workload.<br />
Instead of 2 or 3 transactions each user will now execute tens of thousands of transactions a minute. Clearly<br />
KEYANDTHINK will have a big impact on the number of virtual users and warehouses you will need to<br />
configure to run an accurate workload, if this parameter is set to TRUE you will need at least hundreds of<br />
vritual users and warehouses, if FALSE then you will need to begin testing with 1 or 2 threads, building from<br />
here up to a maximum workload with the number of warehouses set to a level where the users are not<br />
contending for the same data. A common error is to set KEYANDTHINK to FALSE and then create hundreds<br />
of users for an initial test, this form of testing will only exhbit a massive contention for data between users<br />
and nothing about the potential of the system. If you do not have an extensive testing infrastructure and a<br />
large number of warehouses configured then I recommend setting KEYANDTHINK to FALSE (whilst<br />
remembering that you are not simulating a real TPC-C type test) and beginning your testing with 1 virtual<br />
user building up the number of virtual users for each subsequent test in order to plot a transaction profile.<br />
Minutes of Rampup Time<br />
The Minutes of Ramup Time is shown as rampup in the Driver Script. The rampup time defines the time in<br />
minutes for the monitoring virtual user to wait for the virtual users running the workload to connect to the<br />
database and build up the transaction rate by caching data in the database buffer cache before taking the<br />
first snapshot and timing the test. The rampup time should be sufficiently long enough for a workload to<br />
reach a steady transaction rate before the first snapshot is taken.<br />
Minutes for Test Duration
The Minutes for Test Duration is shown as duration in the Driver Script. The test duration defines the time of<br />
the test measured as the time the monitor thread waits after the first snapshot before taking the second<br />
one to signal the test is complete and the active virtual users to complete their workload.<br />
Mode Options<br />
The mode value is taken from the operational mode setting set under the Mode Options menu tab under<br />
the Mode menu. If set to Local or Master then the monitor thread takes snapshots, if set to Slave no<br />
snapshots are taken. This is useful if multiple instances of <strong>Hammerora</strong> are running in Master and Slave<br />
mode to ensure that only one instance takes the snapshots.<br />
The values of the <strong>MySQL</strong> Host, <strong>MySQL</strong> Port, <strong>MySQL</strong> User and <strong>MySQL</strong> Password detailed under the<br />
Build Options of the Schema Options page is shown as the host, port, user and password values in the<br />
Driver Script. This value defines the connectivity details for the user who owns the TPC-C schema. As long<br />
as you can connect to <strong>MySQL</strong> using exactly the same connection details then <strong>Hammerora</strong> will also be able<br />
to connect. If having difficulty connecting with <strong>Hammerora</strong> then troubleshoot with <strong>MySQL</strong> tools to resolve<br />
the connectivity issues.<br />
<strong>MySQL</strong> Database<br />
The Database detailed under the Build Options of the Schema Options page is shown as the db value in the<br />
Driver Script. The Database defines the database where the schema was created.<br />
When you have completed defining the Schema Options click OK to save your values. As noted previously<br />
under the section Load Generation Server Configuration you can also enter these values into the config.xml<br />
file to save a a permanent record of your values for pre-populating the values after restarting <strong>Hammerora</strong>.<br />
Loading the Driver Script<br />
Once you have selected and saved your driver options under the Benchmark Menu select TPC-C and TPC-C<br />
Driver Script as shown in Figure 25.<br />
Figure 26 Select Driver Script<br />
This will populate the Script Editor window with the driver script shown in Figure 24 or 25 according to<br />
whether the standard or AWR driver script is chosen. These scripts provide the interaction from the Load<br />
Generation Server to the schema on the SUT Database Server. If you have correctly configured the<br />
parameters in the Driver Options section you do not have to edit in the script. If you so choose however you<br />
may also manually edit the the values given in the EDITABLE OPTIONS section. Additionally the driver scripts<br />
are regular <strong>Hammerora</strong> scripts and a copy may be saved externally and modified as you desire for a<br />
genuinely Open Source approach to load testing.
Pre-Test 1 Verifying the Schema<br />
Figure 27 shows a successfully loaded Standard Driver Script which provides a useful first test against a<br />
newly created TPC-C Schema.<br />
Figure 27 TPC-C Driver Script<br />
In this example we will create two virtual users and choose to display their output to verify the schema and<br />
database configuration. To do this Under the Virtual Users menu as shown in Figure 28 select Vuser Options<br />
and enter the number 2. Also check the Show Output button to see what your users are doing whilst the<br />
test is running. Note that displaying the output will reduce the overall level of performance (although<br />
<strong>Hammerora</strong> is multi-threaded many Window display systems are not and a display can only be updated by a<br />
single thread thereby limited performance) and click OK. Showing output is OK here as it is running a pretest<br />
and not a performance test.
Figure 28 Select Virtual Users<br />
There are three other related options under the Virtual User Options dialogue, namely User Delay(ms),<br />
Repeat Delay(ms) and Iterations. Iterations defines the number of times that <strong>Hammerora</strong> should execute a<br />
script in its entirety. With regards to running the TPC-C driver script this can be thought of as the number of<br />
times a Virtual User logs on to the database, runs the number of transactions you defined in Total<br />
Transactions per User and logs off again. For example if Total Transactions per User was set to 1000 and the<br />
Virtual Users Iterations was set to 10, the Virtual User would complete 10000 transactions in total logging<br />
off and on between each run. Setting Total Transactions per User to 10000 and Virtual User Iterations to 1<br />
would also complete 10,000 transactions per virtual user but all in one session. User Delay(ms) defines the<br />
time to wait between each Virtual User starting its test and the Repeat Delay(ms) is the time that each<br />
Virtual User will wait before running its next Iteration. For the TPC-C driver script the recommended<br />
approach is to leave the Iterations and User and Repeat Delays at the default settings and only modify the<br />
Total Transactions per User or total_iterations value inside the Driver Script. When you have completed the<br />
selection press OK. Click the Create Virtual Users button as shown in Figure 29 to create the virtual users,<br />
they will be created but not start running yet.
Figure 29 Create Virtual Users<br />
You can observe as shown in Figure 30 that the virtual users have been created but are showing a status of<br />
idle. You can destroy the Virtual Users by pressing the Red Traffic light icon that has appeared in place of the<br />
Create Virtual Users button.
Figure 30 Virtual Users Created<br />
To begin the test press the button Run <strong>Hammerora</strong> Load Test as shown in Figure 31, the name of the button<br />
will appear in the information pane.
Figure 31 Run <strong>Hammerora</strong> Load Test<br />
You can observe the Virtual User icon change to signify activity. The Virtual Users have logged on to the<br />
database, you will be able to see their presence in the process list for example<br />
mysql> show processlist \G<br />
*************************** 1. row ***************************<br />
Id: 3<br />
User: root<br />
Host: localhost:55069<br />
db: tpcc<br />
Command: Query<br />
Time: 0<br />
State: NULL<br />
Info: show processlist<br />
*************************** 2. row ***************************<br />
Id: 22<br />
User: root<br />
Host: test.example.com:53573<br />
db: tpcc<br />
Command: Query<br />
Time: 0<br />
State: Updating
Info: UPDATE warehouse SET w_ytd = w_ytd + NAME_CONST('p_h_amount',287.00)<br />
WHERE w_id = NAME_CONST('p_w_<br />
*************************** 3. row ***************************<br />
Id: 23<br />
User: root<br />
Host: test.example.com:53574<br />
db: tpcc<br />
Command: Query<br />
Time: 0<br />
State: statistics<br />
Info: SELECT s_quantity, s_data, s_dist_01, s_dist_02, s_dist_03, s_dist_04,<br />
s_dist_05, s_dist_06, s_dist_<br />
3 rows in set (0.00 sec)<br />
and are running transactions as can be observed in the Virtual User Output as shown in Figure 32.<br />
Figure 32 Load Testing Running<br />
When the Virtual Users have completed all of their designated transactions they will exit showing a positive<br />
status as shown in Figure 33. Once the Virtual User is displaying this positive status it has logged off the<br />
database and will not be seen in V$SESSION. The Virtual User is once again idle and not running<br />
transactions. The Virtual User does not need to be destroyed and recreated to re-run the test from this<br />
status. The Virtual Users can be destroyed to stop a running test.
Figure 33 Virtual Users Complete<br />
If there is an error when running the Driver Script it will be reported in the Virtual User icon with the detail<br />
of the error shown in the Console window. Figure 34 shows an example of an error, in this case it is an<br />
<strong>MySQL</strong> error illustrating an unknown database has been selected. The Virtual User is once again idle and<br />
not running transactions. The Virtual User does not need to be destroyed and recreated to re-run the test<br />
from this status.
Figure 34 Virtual User Error<br />
At this stage in pre-testing the test configuration has been verified and it has been demonstrated that the<br />
load generation server can log on to the SUT Database Server and run a test.<br />
Pre-Test 2 Single and Multiple Virtual User Throughput<br />
Once the configuration has been verified the next stage is to focus upon performance. The best place to<br />
start with verifying performance is to monitor the workload of a single Virtual User. To do this follow all of<br />
the steps for Pre-Test 1 ensuring that you select the Standard Driver Script. Note that the Timed Test Driver<br />
Script is designed for multiple users with one Virtual User providing the monitoring capabilities for the<br />
other Virtual Users. Consequently if one Virtual User is configured to run the Timed Test Driver Script it will<br />
result in one Virtual monitoring an idle workload which is almost certainly not the desired outcome. Once<br />
the Standard Driver Script has been loaded configure a single Virtual User as shown in Figure 35. Configure<br />
One Virtual user without selecting the Show Output check box (The reason for suppressing output is<br />
described under Pre-Test 1).
Figure 35 One Virtual User<br />
Note that a single Virtual User without output is the default configuration if you have not modified the<br />
config.xml file and therefore creating the Virtual Users as shown in Figure 29 will give you this single Virtual<br />
Configuration without specifically configuring the Virtual Users as shown in Figure 35. Figure 36 shows the<br />
single Virtual User created and the Standard Driver script loaded.<br />
Figure 36 Single Virtual User<br />
Press the Run <strong>Hammerora</strong> Load Test button as shown previously in Figure 31 to begin generating the Single<br />
User Throughput test. As shown in figure 37 the Virtual User icon has been updated to signify that the<br />
workload is running.
Figure 37 Single User Throughput Test<br />
To observe performance during the test you can use the Transaction Counter. The Transaction Counter<br />
options can be selected from the TX Counter Menu as shown in Figure 38.<br />
Figure 38 TX Counter Options<br />
This displays the Transaction Counter Options as shown in Figure 39.<br />
Figure 39 Transaction Counter Options
Transaction Counter Options<br />
Under the Transaction Counter Options section you have the following choices:<br />
<strong>MySQL</strong> Host/<strong>MySQL</strong> Port/<strong>MySQL</strong> User/<strong>MySQL</strong> User Password<br />
The Connection details must be for a User with permission to run the “show global status command”, you<br />
can validate by logging on with this user and running the following command.<br />
mysql> show global status where Variable_name = 'Handler_commit' or<br />
Variable_name = 'Handler_rollback';<br />
+------------------+-------+<br />
| Variable_name | Value |<br />
+------------------+-------+<br />
| Handler_commit | 28689 |<br />
| Handler_rollback | 4 |<br />
+------------------+-------+<br />
2 rows in set (0.00 sec)<br />
Note that if the values shown are both 0 and continue to remain so whilst running a test then the<br />
transaction counter will not display the transaction rate during a test. This is most likely to occur if using a<br />
non-standard or experimental storage engine that fails to update its statistics correctly. In this eventuality<br />
please report the issue to the storage engine developers.<br />
Refresh Rate<br />
The refresh rate defines the time in seconds between when the transaction counter will refresh its values.<br />
Setting this value too low may impact the accuracy of the data reported by the <strong>MySQL</strong> database and the<br />
default value of 10 seconds is a good choice for an accurate representation.<br />
Autorange Data Points<br />
By default the Data Points in the transaction counter will be anchored to the data point Zero. By selecting<br />
Autorange data points you enable the transaction counter to zoom in to show a finer detail of peaks and<br />
troughs in your transaction Data.<br />
When you have completed the transaction counter options press OK to save your values and press the<br />
Transaction Counter button as shown in Figure 40 to begin observing the transaction rate.
Figure 40 Start Transaction Counter<br />
The transaction Counter will become active and start collecting throughput data as shown in figure 41.
Figure 41Waiting for Data<br />
After the first refresh time interval you will be able to observe the transaction counter updating according<br />
to the throughput of your system. The actual throughput you observe for a single Virtual User will vary<br />
according to the capabilities of your system, however typically you should be looking for values in the<br />
hundreds of thousands. Additionally once the transaction rate reaches a steady state you should observe<br />
the transaction counter maintaining a reasonably flat profile. Low transaction rates or excessive peaks and<br />
troughs in the transaction counter should be investigated for system bottlenecks on throughput.
Figure 42 Virtual user Throughput<br />
Once you are satisfied with the single Virtual User throughput close both the Transaction Counter and<br />
destroy the Virtual Users also stopping the test by pressing both Red Traffic Light icons. You should also<br />
proceed to pre-testing the throughput multiple Virtual Users. To do so repeat the testing you have done for<br />
a single Virtual User however instead increase the value for the number of Virtual Users to run the test in<br />
the Virtual User Options as shown in Figure 43.<br />
Figure 43 Configuring Multiple Virtual Users<br />
Similarly monitor the throughput for a higher number of Virtual Users as shown in Figure 44.
Figure 44 Running Multiple Virtual Users<br />
Recommended Multiple Virtual Users for throughput testing are on an exponential scale from the single<br />
Virtual User test ie. 2,4,8,16,32 Virtual Users should be tested up to double the number of Cores or Hyper-<br />
Threads on the SUT Database Server. You should also not just test on an increasing scale. It is useful for<br />
example to run a single or two Virtual User test after running a test with Multiple Virtual Users to observe<br />
the importance of the caching of the data in the database Buffer Cache. This will be particularly noticeable<br />
with larger schemas. Figure 45 shows a typical performance profile of data being cached with a rising<br />
transaction rate through to a steady state.
Figure 45 Memory Performance Plateau<br />
Pre-testing is your opportunity to modify you configuration, tune your database and operating system and<br />
maximise the database throughput. Your aim should be ensure a consistent performance profile over a<br />
period of time such as that shown in Figure 46.<br />
Figure 46 Steady Transaction State<br />
If the observed transaction rate has numerous peaks and troughs or the consistent throughput is lower than<br />
expected you should examine the system configuration to diagnose the reasons why performance is limited.<br />
To do this you can use <strong>MySQL</strong> provided or third party tools. You should also not neglect the relevant log<br />
files such as the Linux operating system logs and the <strong>MySQL</strong> error log. Once you have completed your pretesting<br />
and are satisfied with your configuration you should move to planning and preparing to run a series<br />
of measured tests. You do not have to restart the database or rebuild the schema to conduct your<br />
performance tests. In fact having run a series of pre-tests and to have data resident in the buffer cache is<br />
the ideal starting point for conducting measured tests.<br />
Planning and Preparation<br />
Planning and Preparation is one of the most crucial stages of successful testing but is often overlooked.<br />
Firstly you should fully document the configuration of your entire load testing environment including details<br />
such as hardware, operating system versions and settings and <strong>MySQL</strong> version and my.cnf parameters. Once<br />
you have fully documented your configuration you should ensure that the configuration is not changed for<br />
an entire series of measured tests. This takes discipline but is an essential component of conducting<br />
accurate and measured tests. If you wish to change the configuration between tests to improve<br />
performance you should do so as part of the pre-test phase and not for the measured tests. If you change<br />
any aspect of the configuration you should conduct another full series of measured tests.<br />
To plan your measured tests you should have a defined aim for what you wish to achieve and plan the tests<br />
accordingly. Often a test project can fail for having an unclear definition for the aim of what is desired to be<br />
achieved. Typically this aim will take the form of determining the performance characteristics of a server (or<br />
server) however this can have many forms, for example generating a performance profile, determining the
maximum throughput, measuring transaction response times or determining the maximum number of<br />
supported virtual users. The tests will vary according to the aim, for example it is relatively meaningless to<br />
use a test without keying and thinking to determine the maximum number of supported virtual users<br />
(because each virtual user can use the maximum performance of one core or thread), similarly enabling<br />
keying and thinking time is not applicable to determining a performance profile. Alternative testing aims<br />
can be to compare multiple configurations on the same platform, for example looking at the impact on<br />
throughput of different storage engines or comparing drop in replacement databases with the <strong>MySQL</strong><br />
upstream release.<br />
In this guide we will focus upon one of the most common testing scenarios, to generate a performance<br />
profile for server. This aim is used to identify for a given configuration of CPU, memory and I/O on a defined<br />
OS and <strong>MySQL</strong> configuration the maximum number of transactions that the system can support. This is<br />
tested for a given number of virtual users, starting with one virtual user scaling up to the maximum number<br />
that the system can support. This approach ensures that the full capabilities of a multithreaded server are<br />
tested. With this approach we will define our Virtual Users without keying and thinking time. The number<br />
of cores/threads in this example on the SUT Database Server is 16, therefore we will prepare a simple<br />
tracking spreadsheet to record the results of our tests as shown in figure 47.<br />
Figure 47 Planning Spreadsheet<br />
With the configuration documented, the aim defined and a method to track the results of the tests<br />
prepared for our performance profile test project it is now possible to proceed to running timed tests with<br />
the Timed Test Driver Script.<br />
Running Timed Tests with the Timed Test Driver Script<br />
To run a timed and measured test there is an additional script to the Standard Driver Script called the Timed<br />
Test Driver Script that automates this functionality for you. To select the Timed Test driver script, open the<br />
TPC-C Schema Options Window as described previously in this guide. Your focus is upon the Driver Options<br />
in this Window, and it is important to reiterate that you do not need to recreate the schema to modify the<br />
driver options or to change from using the Standard Driver Script to the Timed Test Driver Script or Vice<br />
Versa. Within the Driver Options shown in Figure 48, select the Timed Test Driver Script radio button.
Figure 48 Timed Test Driver Options<br />
Once the Timed Test Driver Script is selected this activates the options to select the Minutes of Rampup<br />
Time and Minutes for Test Duration as described previously in this guide. For a performance profile test you<br />
should plan to keep the Minutes of Rampup Time and the Minutes for Test Duration consistent for a<br />
number of tests with an increasing number of Virtual Users. For this reason you should plan to allocate<br />
sufficient rampup time for the higher number of Virtual Users at the end of your test sequence as well as<br />
the smaller number at the start. When you have selected your options click OK.<br />
From under the Benchmark and TPC-C Menu select TPC-C Driver Script, this populates the Script Editor<br />
Window as shown in Figure 49 with the Timed Test Driver Script configured with your chosen options.
Figure 49 AWR Snapshot Driver Script<br />
To change these options you can either change them in the Schema Options window and reload the driver<br />
script or more advanced users can also change them directly in the Driver Script itself. To run the Timed Test<br />
Driver Script you must configure the Virtual Users as you did with the Standard Driver Script however there<br />
are two notable differences to observe. Firstly when running the Timed Test Driver Script one Virtual user<br />
will not run the Driver Script workload, instead this one Virtual User will monitor the timing of the test,<br />
measure the average transaction values and return the results. For this reason you should configure your<br />
Virtual Users with a Virtual User + 1 approach. ie to measure the workload for 1 Virtual User you should<br />
configure 2 Virtual Users, to measure the workload for 2 virtual Users you should configure 3 and so on.<br />
Additionally the Timed Test Driver Script is designed to be run with the Virtual User output enabled in order<br />
that you can view the Output from the Virtual User doing the monitoring, consequently the output for the<br />
Virtual Users running the workload is suppressed. The Virtual User configuration for the first test will look as<br />
Figure 50.
Figure 50 AWR Snapshot Virtual Users<br />
Click OK to save the configuration. Click the Create Virtual Users button as shown previously in this guide in<br />
Figure 29 to create the virtual users as shown in Figure 30 and Start the Virtual Users running as shown in<br />
Figure 32. Note that the Virtual User output is now different as shown in Figure 51.<br />
Figure 51 AWR Driver Script Running<br />
The output shows that rather than reporting the outcome of every transaction the worker Virtual User in<br />
this example Vuser-2-tid000001B38 reports that it is processing transactions, however the output is<br />
suppressed. The Virtual User will print its message AFTER it has logged on and immediately BEFORE it runs<br />
its first transaction. If this message has not been printed the session is still in the process of logging into the
database. You can check how this is proceeding by checking the process list as described previously to<br />
display the number of connections created. Increasing the User Delay(ms) value in the virtual user options<br />
can on some systems prevent a "login storm" and have all users logged on and processing tranasctions more<br />
quickly. Your rampup time should allow enough time for all of the users to be fully connected.<br />
You will also be able to observe that in this example this single virtual User has logged on to the database<br />
and is running the workload. You can also observe that the monitor Virtual User, in this example Vuser-1tid000001C4<br />
is not running a workload but instead has logged on to measure the rampup time followed by<br />
taking the first transaction value, measuring the timed test, taking the second transaction value and<br />
reporting the outcome before logging off and ending the monitor script. It is worthwhile reiterating<br />
therefore that for the Timed Test Driver Script you need to configure and run n+1 Virtual Users with the<br />
additional Virtual User doing the monitoring and measuring. The sample output of this monitoring Virtual<br />
User is shown in figure 52.<br />
Figure 52AWR Snapshot Result<br />
The monitoring user reports the TEST RESULT of TPM and NOPM. TPM measures the number of <strong>MySQL</strong><br />
Transactions per minute and is not to be confused with the tpmC value from an official TPC-C benchmark.<br />
NOPM reports the number of New Orders per minute and is used as a database independent statistic.<br />
Consequently for example TPM cannot be used to compare the performance results of <strong>MySQL</strong> with an<br />
Oracle Database but NOPM can. When you have stopped the test enter your data into your reporting<br />
spreadsheet as shown in Figure 53.
Figure 53 Updated Reporting Spreadsheet<br />
Note that the Run column enables you to record multiple tests for the same number of Virtual Users. You<br />
should run two or three tests at the same number of Virtual Users and take the average value of all of the<br />
tests as your final value for the workload. Once you are satisfied with the test results, repeat the test with<br />
the next value in the number of Virtual Users in your sequence remembering to add one for the monitor<br />
thread. Once this test is complete either repeat the process with the next value in the sequence or<br />
automate your testing with autopilot mode as detailed in the following section. With either method do this<br />
until you have completed your spreadsheet with all of the desired values for database performance.<br />
Automating Tests with Autopilot Mode<br />
If you prefer to run all of your tests manually you do not need to use the Autopilot Mode. However if you<br />
wish to run your entire sequence of tests unattended then Autopilot Mode enables you to use your time<br />
most productively. It can help to understand Autopilot Mode as a feature that simulates the presence of a<br />
DBA instructed to run your desired sequence of tests at specified time intervals and report the entire results<br />
of all tests in one batch. To begin configuring Autopilot mode follow the steps described in the previous<br />
section for Running Timed Tests with the AWR Snapshot Driver Script up to the steps illustrated in Figures<br />
49 and 50. You only need to configure the correct driver script but not configure the Virtual Users, they will<br />
be configured automatically. To do this select Autopilot Options from the Mode menu as shown in Figure<br />
54.<br />
Figure 54 Autopilot menu<br />
This shows the Autopilot Options menu as shown in Figure 55.
Figure 55 Autopilot Options<br />
shown in Figure 55. Configure the Autopilot options precisely in the same manner as you would use to<br />
instruct your Virtual DBA as follows:<br />
Autopilot Disabled/Autopilot Enabled<br />
This Autopilot Disabled/Autopilot Enabled Radio buttons give you the option to select whether the<br />
Autopilot button is enabled on the main window.<br />
Minutes per Test in Virtual User Sequence<br />
The minutes for test duration defines the time interval between which your virtual DBA will create the<br />
Virtual Users, stop the test and create the next Virtual Users in the sequence. You should configure this<br />
value in relation to the Minutes for Ramup Time and Minutes for Test Duration given in the AWR Snapshot<br />
options shown in Figure 48. For example if the values in the test script are 2 and 5 minutes respectively then<br />
10 minutes for the Autopilot Options is a good value to allow the test to complete before the next test in<br />
the sequence is run. If however the test overruns the time interval and the Virtual Users are still running the<br />
sequence will wait for the Virtual Users to complete before proceeding.<br />
Virtual User Sequence (Space Separated Values)<br />
The Virtual User Sequence defines the number of Virtual Users to be configured in order for a sequence of<br />
tests separated by the Minutes for Test Duration. For example as shown in Figure 55, firstly a test with 2<br />
Virtual Users will be run, then after 10 minutes a test with 3 Virtual Users will be run, then 5 Virtual Users<br />
and so on to the end of the sequence. Note that the default Values are given as odd numbers to account for<br />
the Monitoring Virtual User when running the AWR Snapshot Driver Script. Therefore in this example the<br />
actual Users running the workload will be 1, 2, 4, 8, 12, 16, 20 and 24.<br />
Show Virtual User Output/Log Virtual User Output to Temp<br />
These values are exactly the same as set when defining the Virtual Users, the Autopilot Options gives you<br />
the opportunity to set them when configuring Autopilot Mode to ensure that you have a record of the<br />
output of the tests that you run.<br />
TIP: When running tests unattended with Autopilot Mode on <strong>MySQL</strong> you should always select the option<br />
Log Virtual User Output to Temp to ensure that you have a permanent record of the transaction results<br />
recorded by each test.
Once your Autopilot Options are defined, press OK to save the values. Close down all running virtual Users<br />
and the transaction counter and press the Autopilot button as shown in Figure 56.<br />
Figure 56 Start Autopilot<br />
You can now leave the autopilot mode to run your chosen sequence of tests without any further<br />
intervention. The Autopilot screen as shown in Figure 57 becomes active and reports your progress. In<br />
particular note the timer in the top right hand corner tracking the interval times at which your tests should<br />
be run.
Figure 57 Autopilot Screen<br />
The Autopilot will continue to run through your chosen sequence, creating virtual users and running the<br />
test in the test script as shown in Figure 58.
Figure 58 Autopilot Continuing<br />
When your tests has completed as shown in Figure 59 you may retrieve your results from the logfile.
Figure 59 Autopilot Complete<br />
The <strong>Hammerora</strong> log file you will have a record of all the data of your sequence of tests. For example the<br />
following truncated and consolidated listing shows the lines from the report highlighting the number of<br />
Virtual Users configured for a test (remember that this value includes the monitoring user) and the test<br />
results.<br />
…<br />
tid0x434a6940:2 Virtual Users configured<br />
tid0x434a6940:TEST RESULT : System achieved 617073 <strong>MySQL</strong> TPM at 9436 NOPM<br />
tid0x42aa5940:3 Virtual Users configured<br />
tid0x42aa5940:TEST RESULT : System achieved 1336528 <strong>MySQL</strong> TPM at 20459 NOPM<br />
tid0x434a6940:5 Virtual Users configured<br />
tid0x434a6940:TEST RESULT : System achieved 2766546 <strong>MySQL</strong> TPM at 42312 NOPM<br />
tid0x43ea7940:9 Virtual Users configured<br />
tid0x43ea7940:TEST RESULT : System achieved 5676422 <strong>MySQL</strong> TPM at 86747 NOPM<br />
tid0x466ab940:13 Virtual Users configured<br />
tid0x466ab940:TEST RESULT : System achieved 7790467 <strong>MySQL</strong> TPM at 119145 NOPM<br />
…<br />
When you have finished your test sequence press the traffic light icon to end Autopilot Mode.
Performance Analysis<br />
When you have finished your sequence of tests you will be equipped with a spreadsheet containing a<br />
number of data points corresponding to an increasing data load.<br />
Performance Comparisons<br />
Use your spreadsheet to generate a graph of a performance profile with the TPM value for the y axis and<br />
the number of Virtual Users for the x axis.<br />
The performance profile should resemble the figure as shown in Figure 60 with an increasing level of<br />
transactions as the number of Virtual Users increases up to a maximum point of system utilisation.<br />
Figure 60 System A performance profile<br />
TIP: The data produced for an official TPC-C benchmark is the logical equivalent of discarding all of the data<br />
points and keeping the top value only. Here you have produced significantly more data regarding the<br />
performance of the system across all levels of utilisation.
When you have data for multiple systems you can now add the performance data to the same spreadsheet<br />
and use the resultant graph to show a comparison. If you wish to compare the performance of both Oracle<br />
and <strong>MySQL</strong> on the same server then you should use the NOPM value as opposed to the TPM value for the y<br />
axis of the graph. This comparison provides a fair representation of the performance of both databases.<br />
Performance Analysis<br />
Performance Analysis on <strong>MySQL</strong> during <strong>Hammerora</strong> testing can be performed with a number of <strong>MySQL</strong> or<br />
Third-Party tools. With <strong>MySQL</strong> 5.5 the performance schema can used<br />
http://dev.mysql.com/doc/refman/5.5/en/performance-schema.html . Additionally viewing the storage<br />
engine status can provide further diagnosis information, for example:<br />
MariaDB [(none)]> show engine innodb status \G;<br />
*************************** 1. row ***************************<br />
Type: InnoDB<br />
Name:<br />
Status:<br />
=====================================<br />
101214 4:29:11 INNODB MONITOR OUTPUT<br />
=====================================<br />
Per second averages calculated from the last 6 seconds<br />
-----------------<br />
BACKGROUND THREAD<br />
-----------------<br />
srv_master_thread loops: 1011 1_second, 1010 sleeps, 100 10_second, 427<br />
background, 427 flush<br />
srv_master_thread log flush and writes: 1072<br />
----------<br />
SEMAPHORES<br />
----------<br />
OS WAIT ARRAY INFO: reservation count 2970238, signal count 9148839<br />
Mutex spin waits 35802598, rounds 187922292, OS waits 357177<br />
RW-shared spins 3669916, OS waits 1058724; RW-excl spins 9468071, OS<br />
waits 1226383<br />
Spin rounds per wait: 5.25 mutex, 13.35 RW-shared, 8.57 RW-excl<br />
…<br />
Conclusion<br />
You should now be equipped to perform fully scalable transactional workloads against a <strong>MySQL</strong> Database<br />
environment. An experienced <strong>MySQL</strong> Database tester will be able to go from bare metal to test in one<br />
working day to install a system, create the schema and start the automated test collecting the results the<br />
following working day making a 2 day project time possible to determine a full system performance profile.<br />
Do not forget that <strong>Hammerora</strong> is Open Source and you have the ability to modify the test scripts to fit<br />
whatever purpose meets your needs for testing <strong>MySQL</strong> transactional performance and comparing and<br />
contrasting <strong>MySQL</strong> with Oracle.<br />
Support and Discussion
Need help? Try the <strong>Hammerora</strong> Sourceforge forum here :<br />
http://sourceforge.net/projects/hammerora/forums/forum/292313<br />
Want to discuss your results or have tips on tuning and configuration? open a Discussion topic here:<br />
http://sourceforge.net/projects/hammerora/forums/forum/292312/topic/3848751