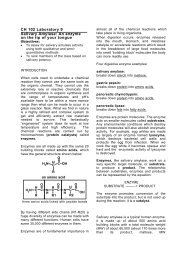
Experiment: Simple Harmonic Motion - PCC
Experiment: Simple Harmonic Motion - PCC
Experiment: Simple Harmonic Motion - PCC

Create successful ePaper yourself
Turn your PDF publications into a flip-book with our unique Google optimized e-Paper software.
Phy 202: General Physics Lab page 2 of 4<br />
Instructor: Tony Zable<br />
Preliminary Questions<br />
1. Attach the 200-g mass to the spring and hold the free end of the spring in your hand,<br />
so the mass and spring hang down with the mass at rest. Lift the mass about 10 cm<br />
and release. Observe the motion. Sketch a graph of position vs. time for the mass.<br />
2. Just below the graph of position vs. time, and using the same length time scale, sketch<br />
a graph of velocity vs. time for the mass.<br />
Procedure<br />
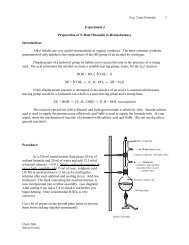
1. Attach the spring to a horizontal rod connected to the ring stand and hang the mass<br />
from the spring as shown in Figure 1. Securely fasten the 200g mass to the spring and<br />
the spring to the rod, using twist ties so the mass cannot fall.<br />
2. Connect the <strong>Motion</strong> Detector to Ch1 of the LabPro interface then start the LoggerPro<br />
software.<br />
3. Open the Vernier experiment file “15 <strong>Simple</strong> <strong>Harmonic</strong> <strong>Motion</strong>”.<br />
4. Place the <strong>Motion</strong> Detector at least 75 cm below the mass. Make sure there are no<br />
objects near the path between the detector and mass, such as a table edge. Place the<br />
wire basket over the <strong>Motion</strong> Detector to protect it.<br />
5. Make a preliminary run to make sure things are set up correctly. Lift the mass upward<br />
a few centimeters and release. The mass should oscillate along a vertical line only.<br />
Begin data collection.<br />
6. After about 10s, data collection will stop. The position graph should show a clean<br />
sinusoidal curve. If it has flat regions or spikes, reposition the <strong>Motion</strong> Detector and try<br />
again.<br />
7. Compare the position and velocity graphs to your sketched predictions in the<br />
Preliminary Questions. How are the graphs similar? How are they different?<br />
8. With the 200g mass hanging at rest, begin data collection. After collection stops, use<br />
the statistics button, , to determine the average distance from the detector. Record<br />
this position (yo) in the data table.<br />
9. Now lift the mass upward about 5 cm, release it and begin data collection. The mass<br />
should oscillate along a vertical line only. Examine the graphs. The pattern you are<br />
observing is characteristic of simple harmonic motion.<br />
File Name: Ph202_lab-SHO.doc<br />
Modified from original file by Vernier Technology