Newfoundland balsam fir and black spruce forests described by the ...
Newfoundland balsam fir and black spruce forests described by the ...
Newfoundland balsam fir and black spruce forests described by the ...

Create successful ePaper yourself
Turn your PDF publications into a flip-book with our unique Google optimized e-Paper software.
Moroni <strong>and</strong> Harris (2010) M-X-224E <strong>Newfoundl<strong>and</strong></strong> <strong>balsam</strong> <strong>fir</strong> <strong>and</strong> <strong>black</strong> <strong>spruce</strong> <strong>forests</strong>....<br />
10<br />
Results<br />
By far <strong>the</strong> most abundant plot type measured <strong>by</strong> <strong>the</strong> NFS that met our subset requirements was <strong>the</strong><br />
fixed area pre-2001 TSPs, with 263–2030 plots per species <strong>and</strong> region combination (Table 1). These<br />
TSPs were relatively evenly distributed in <strong>fir</strong>-dominated st<strong>and</strong>s between <strong>the</strong> central <strong>and</strong> western<br />
regions but, in <strong>spruce</strong>-dominated st<strong>and</strong>s, were far more common in <strong>the</strong> central region, where <strong>spruce</strong> is <strong>the</strong><br />
dominant forest type. The TPS plots were limited to ≤30 plots per species <strong>and</strong> region combination in all but<br />
<strong>the</strong> <strong>fir</strong>-dominated st<strong>and</strong>s in <strong>the</strong> central region, which contained 144 plots (Table 1). The PSPs were dominated<br />
<strong>by</strong> <strong>fir</strong>-dominated st<strong>and</strong>s in <strong>the</strong> western regions (n = 71 vs. 24 in <strong>the</strong> central region) <strong>and</strong> <strong>spruce</strong>-dominated<br />
st<strong>and</strong>s in <strong>the</strong> central region (n = 116 vs. 16 in <strong>the</strong> western region; Table 1). Due to <strong>the</strong> low numbers of TPS plots,<br />
emphasis will be placed on TSP data for fur<strong>the</strong>r discussion <strong>and</strong> comparison with <strong>the</strong> PSP data set.<br />
Tree densities <strong>and</strong> diameter distributions (>9cm dbh only)<br />
Densities of >9 cm dbh stems ranked PSP > TSP > TPS for all species <strong>and</strong> region combinations except for<br />
<strong>fir</strong>-dominated st<strong>and</strong>s in <strong>the</strong> western region where <strong>the</strong> ranking was PSP > TPS > TSP (Table 1).<br />
Although both TSPs <strong>and</strong> PSPs rank >9 cm dbh tree density as <strong>spruce</strong> > <strong>fir</strong> in both central <strong>and</strong> western<br />
regions, both TSPs <strong>and</strong> PSPs indicated <strong>the</strong> abundance of 19–25 cm dbh <strong>and</strong> >25cm dbh trees to be higher<br />
in <strong>fir</strong>-dominated <strong>forests</strong> than in <strong>spruce</strong>-dominated <strong>forests</strong> in both regions (Table 1). In contrast, densities of<br />
>9–19 cm dbh trees were higher in <strong>spruce</strong>-dominated <strong>forests</strong> than in <strong>fir</strong>-dominated <strong>forests</strong> for both regions.<br />
The density of all trees with >9 cm dbh ranked higher (8%–12%) in <strong>the</strong> central region for <strong>fir</strong>-dominated<br />
<strong>forests</strong> in both TSPs <strong>and</strong> PSPs (Table 1). In addition, both TSPs <strong>and</strong> PSPs indicate <strong>the</strong> density of 19–25 cm dbh<br />
trees <strong>and</strong> >25 cm dbh trees in <strong>fir</strong>-dominated <strong>forests</strong> in <strong>the</strong> western region to be larger than in <strong>the</strong> central region.<br />
The density of 19–25 cm dbh trees in <strong>fir</strong>-dominated <strong>forests</strong> in <strong>the</strong> western region was 1.4 times densities in <strong>the</strong><br />
central region, <strong>and</strong> <strong>the</strong> density of >25 cm dbh trees in <strong>fir</strong>-dominated <strong>forests</strong> in <strong>the</strong> western region was 1.8–3.6<br />
times <strong>the</strong> densities in <strong>the</strong> central region. However, <strong>the</strong> density of 9–19 cm dbh trees in <strong>fir</strong>-dominated <strong>forests</strong><br />
in <strong>the</strong> western region was 0.7–0.8 times <strong>the</strong> densities in <strong>the</strong> central region.<br />
Although TSPs ranked >9 cm dbh tree density in <strong>spruce</strong>-dominated <strong>forests</strong> in <strong>the</strong> central region above<br />
densities in <strong>the</strong> western region, PSPs indicated <strong>the</strong> opposite ranking (Table 1). In addition, TSPs ranked <strong>the</strong><br />
density of 19–25 cm dbh <strong>and</strong> >25cm dbh trees in <strong>spruce</strong>-dominated <strong>forests</strong> from <strong>the</strong> western region above<br />
densities in <strong>the</strong> central region, but ranked densities of 9–19 cm dbh trees in <strong>spruce</strong>-dominated <strong>forests</strong> of <strong>the</strong><br />
western region below densities in <strong>the</strong> central region; with PSPs indicating <strong>the</strong> opposite for all dbh classes.<br />
However, <strong>the</strong> density of >25 cm dbh trees in <strong>spruce</strong>-dominated <strong>forests</strong> was low, <strong>and</strong> st<strong>and</strong>ard deviations of<br />
<strong>the</strong>se means were large.<br />
St<strong>and</strong>ard deviations for <strong>the</strong> density of larger diameter stems (19–25 cm dbh) were large compared<br />
with <strong>the</strong> mean (Table 1). This is partially attributed to <strong>the</strong> inclusion of data from all plots, including those that<br />
did not have any larger diameter stems.<br />
Tree species assemblages<br />
Not surprisingly, <strong>the</strong> dominant species in all plots was <strong>the</strong> species defining <strong>the</strong> St<strong>and</strong> Type (ei<strong>the</strong>r <strong>fir</strong> or<br />
<strong>spruce</strong>) sampled (Table 2). However, <strong>the</strong>re was a trend for PSPs to be populated with a larger proportion<br />
of stems of <strong>the</strong> dominant species. For both <strong>fir</strong>- <strong>and</strong> <strong>spruce</strong>-dominated <strong>forests</strong>, <strong>the</strong> second most<br />
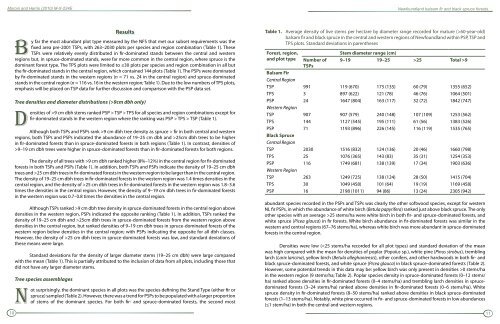
Table 1. Average density of live stems per hectare <strong>by</strong> diameter range recorded for mature (>60-year-old)<br />
<strong>balsam</strong> <strong>fir</strong> <strong>and</strong> <strong>black</strong> <strong>spruce</strong> in <strong>the</strong> central <strong>and</strong> western regions of <strong>Newfoundl<strong>and</strong></strong> within PSP, TSP <strong>and</strong><br />
TPS plots. St<strong>and</strong>ard deviations in paren<strong>the</strong>ses<br />
Forest, region,<br />
<strong>and</strong> plot type<br />
Number of<br />
TSPs<br />
Stem diameter range (cm)<br />
9–19 19–25 >25 Total >9<br />
Balsam Fir<br />
Central Region<br />
TSP 991 119 (670) 175 (135) 60 (79) 1355 (652)<br />
TPS 3 897 (622) 121 (78) 46 (76) 1064 (501)<br />
PSP 24 1647 (804) 163 (117) 32 (72) 1842 (747)<br />
Western Region<br />
TSP 907 907 (579) 240 (148) 107 (109) 1253 (562)<br />
TPS 144 1127 (545) 195 (111) 61 (56) 1383 (526)<br />
PSP 71 1193 (896) 226 (145) 116 (119) 1535 (765)<br />
Black Spruce<br />
Central Region<br />
TSP 2030 1516 (832) 124 (136) 20 (46) 1660 (798)<br />
TPS 25 1076 (365) 143 (83) 35 (31) 1254 (353)<br />
PSP 116 1749 (681) 138 (139) 17 (34) 1903 (636)<br />
Western Region<br />
TSP 263 1249 (725) 138 (124) 28 (50) 1415 (704)<br />
TPS 30 1049 (458) 101 (64) 19 (19) 1169 (458)<br />
PSP 16 2198 (1011) 94 (86) 13 (24) 2305 (942)<br />
abundant species recorded in <strong>the</strong> PSPs <strong>and</strong> TSPs was clearly <strong>the</strong> o<strong>the</strong>r softwood species, except for western<br />
NL <strong>fir</strong> PSPs, in which <strong>the</strong> abundance of white birch (Betula papyrifera) ranked just above <strong>black</strong> <strong>spruce</strong>. The only<br />
o<strong>the</strong>r species with an average >25 stems/ha were white birch in both <strong>fir</strong>- <strong>and</strong> <strong>spruce</strong>-dominated <strong>forests</strong>, <strong>and</strong><br />
white <strong>spruce</strong> (Picea glauca) in <strong>fir</strong> <strong>forests</strong>. White birch abundance in <strong>fir</strong>-dominated <strong>forests</strong> was similar in <strong>the</strong><br />
western <strong>and</strong> central regions (67–76 stems/ha), whereas white birch was more abundant in <strong>spruce</strong>-dominated<br />
<strong>forests</strong> in <strong>the</strong> central region.<br />
Densities were low (0 stems/ha<br />
in <strong>the</strong> western region (9 stems/ha; Table 2). Poplar species density in <strong>spruce</strong>-dominated <strong>forests</strong> (0–12 stems/<br />
ha) ranked above densities in <strong>fir</strong>-dominated <strong>forests</strong> (0–4 stems/ha) <strong>and</strong> trembling larch densities in <strong>spruce</strong>dominated<br />
<strong>forests</strong> (3–24 stems/ha) ranked above densities in <strong>fir</strong>-dominated <strong>forests</strong> (0–6 stems/ha). White<br />
<strong>spruce</strong> density in <strong>fir</strong>-dominated <strong>forests</strong> (8–50 stems/ha) ranked above densities in <strong>black</strong> <strong>spruce</strong>-dominated<br />
<strong>forests</strong> (1–13 stems/ha). Notably, white pine occurred in <strong>fir</strong>- <strong>and</strong> <strong>spruce</strong>-dominated <strong>forests</strong> in low abundances<br />
(≤1 stem/ha) in both <strong>the</strong> central <strong>and</strong> western regions.<br />
11