The Integrated Gas Major - BG Group
The Integrated Gas Major - BG Group
The Integrated Gas Major - BG Group

You also want an ePaper? Increase the reach of your titles
YUMPU automatically turns print PDFs into web optimized ePapers that Google loves.
<strong>BG</strong> <strong>Group</strong><br />
<strong>The</strong> <strong>Integrated</strong> <strong>Gas</strong> <strong>Major</strong><br />
London • 7 th February 2008
<strong>BG</strong> <strong>Group</strong><br />
Welcome<br />
Sir Robert Wilson • Chairman
<strong>BG</strong> <strong>Group</strong><br />
Introduction<br />
Frank Chapman • Chief Executive
Legal Notice<br />
Certain statements included in this presentation contain forward-looking information concerning <strong>BG</strong><br />
<strong>Group</strong>’s strategy, operations, financial performance or condition, outlook, growth opportunities or<br />
circumstances in the countries, sectors or markets in which <strong>BG</strong> <strong>Group</strong> operates. By their nature,<br />
forward-looking statements involve uncertainty because they depend on future circumstances, and<br />
relate to events, not all of which are within <strong>BG</strong> <strong>Group</strong>'s control or can be predicted by <strong>BG</strong> <strong>Group</strong>.<br />
Although <strong>BG</strong> <strong>Group</strong> believes that the expectations reflected in such forward-looking statements are<br />
reasonable, no assurance can be given that such expectations will prove to have been correct.<br />
Actual results could differ materially from those set out in the forward-looking statements. For a<br />
detailed analysis of the factors that may affect our business, financial performance or results of<br />
operations, we urge you to look at the “Risk Factors” included in <strong>BG</strong> <strong>Group</strong> plc’s Annual Report and<br />
Accounts 2006. Nothing in these results should be construed as a profit forecast and no part of<br />
these results constitutes, or shall be taken to constitute, an invitation or inducement to invest in <strong>BG</strong><br />
<strong>Group</strong> plc or any other entity, and must not be relied upon in any way in connection with any<br />
investment decision. <strong>BG</strong> <strong>Group</strong> undertakes no obligation to update any forward-looking statements.<br />
4
<strong>The</strong> <strong>Integrated</strong> <strong>Gas</strong> <strong>Major</strong><br />
Key messages<br />
• Good 2007 results<br />
• LNG flexibility delivering value<br />
• Earnings outlook to 2009 confirmed<br />
• Total E&P resources now 10 bn boe, up 2 bn boe<br />
• E&P production potential 6-8% CAGR 2005 to 2020<br />
Delivering value to shareholders<br />
5
<strong>The</strong> <strong>Integrated</strong> <strong>Gas</strong> <strong>Major</strong><br />
Total operating profit<br />
£m<br />
3500<br />
3000<br />
2500<br />
2000<br />
1500<br />
1000<br />
500<br />
0<br />
160<br />
229<br />
330<br />
1997 2000 2003 2006<br />
E&P<br />
Continuing operations excluding disposals, certain re-measurements and impairments<br />
Results prior to 2003 stated under UK GAAP; post 2003 stated under IFRS. 2003, 2004 & 2005 restated for IFRIC 4.<br />
Total operating profit includes <strong>BG</strong>’s share of pre-tax operating results from joint ventures and associates.<br />
Strong record of growth<br />
CAGR 35% 1997-2007<br />
688<br />
833<br />
888<br />
1,287<br />
1,520<br />
T&D, LNG, Power & Other<br />
2,389<br />
3,103<br />
3,248<br />
2007<br />
6
<strong>The</strong> <strong>Integrated</strong> <strong>Gas</strong> <strong>Major</strong><br />
Key messages<br />
• Good 2007 results<br />
• LNG flexibility delivering value<br />
• Earnings outlook to 2009 confirmed<br />
• Total E&P resources now 10 bn boe, up 2 bn boe<br />
• E&P production potential 6-8% CAGR 2005 to 2020<br />
Delivering value to shareholders<br />
7
<strong>The</strong> <strong>Integrated</strong> <strong>Gas</strong> <strong>Major</strong><br />
Overview<br />
• Strategy<br />
• 2007 results<br />
• Portfolio for growth<br />
• Conclusions<br />
8
<strong>BG</strong> <strong>Group</strong><br />
Strategy<br />
Frank Chapman • Chief Executive
Strategy<br />
<strong>Integrated</strong> <strong>Gas</strong> <strong>Major</strong><br />
Connect gas to<br />
high value markets<br />
• Build & access markets<br />
• Serve customers<br />
Secure competitively<br />
priced resources<br />
• Equity reserves<br />
• Contracted resources<br />
Skills to succeed across the gas chain<br />
Strategy delivering value<br />
<strong>Integrated</strong> <strong>Gas</strong> <strong>Major</strong><br />
10
Strategy<br />
Business environment<br />
• High commodity prices<br />
• Cost inflation<br />
• Increased demand for LNG<br />
• Government’s priorities . . .<br />
domestic vs export<br />
• Replacing reserves<br />
<strong>BG</strong> well positioned<br />
Trend <strong>BG</strong> response<br />
• Strong cash conversion<br />
• Long-life, low cost base<br />
• Flexible LNG supply portfolio<br />
• <strong>Integrated</strong> approach & alignment<br />
• Monetise resource base<br />
11
<strong>BG</strong> <strong>Group</strong><br />
2007 results<br />
Ashley Almanza • Chief Financial Officer
2007 results<br />
<strong>Group</strong> highlights<br />
• Good operating performance<br />
• EPS +11% (+17% underlying*)<br />
• Cash flow from operations +10%<br />
• Strong financial position<br />
• Robust outlook<br />
• Dividend +30%<br />
* At constant upstream prices and US$/UK£ exchange rate<br />
Good results, positive outlook<br />
13
2007 results<br />
E&P volumes (mmboe)<br />
219.2 (3.5)<br />
2006 Disposals CATS Underlying<br />
growth<br />
Underlying growth of 5%<br />
(5.5)<br />
10.1 220.3<br />
2007<br />
14
2007 results<br />
E&P benchmarking<br />
$12<br />
$10<br />
$8<br />
$6<br />
$4<br />
$2<br />
$0<br />
Top quartile unit opex performance<br />
Annual unit opex cost trend ($/boe)<br />
2002 2003 2004 2005 2006 2007<br />
<strong>BG</strong> Top quartile Combined Companies Bottom quartile<br />
Source: Evaluate Energy 2007, <strong>BG</strong> <strong>Group</strong><br />
Peer <strong>Group</strong> includes Super <strong>Major</strong>s, US and European <strong>Integrated</strong> <strong>Major</strong>s<br />
15
2007 results<br />
E&P 2007 total operating profit (£m)<br />
2457<br />
241<br />
2006 Pre E&A &<br />
CATS<br />
(64)<br />
E&A<br />
expense<br />
Continuing operations excluding disposals, certain re-measurements and impairments<br />
Total operating profit includes <strong>BG</strong> <strong>Group</strong>’s share of pre-tax operating results from joint ventures and associates<br />
Good operating performance<br />
2634<br />
(127)<br />
(120)<br />
2387<br />
Underlying CATS As reported<br />
Price/<br />
FX<br />
16
2007 results<br />
2007 proved reserve additions (mmboe)<br />
Underlying performance<br />
Organic reserves<br />
replacement = 107%<br />
172<br />
63<br />
Revisions Developments<br />
& sales<br />
(117)<br />
Underlying organic reserves replacement 107%<br />
(8)<br />
Acquisitions<br />
& disposals<br />
2007<br />
Production<br />
110<br />
Price Net<br />
17
2007 results<br />
E&P benchmarking<br />
$25<br />
$20<br />
$15<br />
$10<br />
$5<br />
$0<br />
Top quartile unit F&D performance<br />
3 year F&D cost trend ($/boe)<br />
2001-03 2002-04 2003-05 2004-06 2005-07<br />
<strong>BG</strong> Top quartile Combined Companies Bottom quartile<br />
Source: Evaluate Energy 2007, <strong>BG</strong> <strong>Group</strong><br />
Peer <strong>Group</strong> includes Super <strong>Major</strong>s, US and European <strong>Integrated</strong> <strong>Major</strong>s<br />
18
2007 results<br />
LNG total operating profit<br />
Step change in performance<br />
Q4<br />
2007<br />
Full Year<br />
2007<br />
Full Year<br />
ΔYOY<br />
Shipping & Marketing £145m £463m +39%<br />
Liquefaction £38m £127m +22%<br />
Business Development (£20m) (£69m) -18%<br />
Total £163m £521m +48%<br />
Continuing operations excluding disposals, certain re-measurements and impairments<br />
Total operating profit includes <strong>BG</strong> <strong>Group</strong>’s share of pre-tax operating results from joint ventures and associates<br />
19
2007 results<br />
T&D total operating profit (£m)<br />
231<br />
2006<br />
25<br />
Comgas<br />
Continuing operations excluding disposals, certain re-measurements and impairments<br />
Total operating profit includes <strong>BG</strong> <strong>Group</strong>’s share of pre-tax operating results from joint ventures and associates<br />
Comgas and India driving performance<br />
12<br />
2<br />
270<br />
(23)<br />
247<br />
India Other<br />
Underlying Interconnector As<br />
disposal reported<br />
20
2007 results<br />
Power total operating profit (£m)<br />
106<br />
2006<br />
Continuing operations excluding disposals, certain re-measurements and impairments<br />
Total operating profit includes <strong>BG</strong> <strong>Group</strong>’s share of pre-tax operating results from joint ventures and associates<br />
Contribution from acquisitions<br />
22 2 130<br />
Acquisitions<br />
(part year)<br />
Other 2007<br />
21
2007 results<br />
E&P: Production<br />
1000<br />
800<br />
600<br />
400<br />
200<br />
0<br />
2005A 2006A 2007A<br />
2009 2012<br />
Growth applies to the end of the period, within the period growth is non-linear<br />
At 2008 reference conditions (see appendix)<br />
Production outlook<br />
<strong>BG</strong> net production (000’s boepd)<br />
Medium term 2007-09 Long term 2010-12<br />
Key projects:<br />
• Buzzard<br />
• Karachaganak<br />
• Trinidad E&P<br />
• Panna/Mukta/Tapti<br />
• Hasdrubal<br />
2005-12<br />
CAGR 6-8%<br />
2009<br />
680-710,000<br />
boepd<br />
Key opportunities:<br />
• Karachaganak<br />
• Tupi<br />
• Bongkot South<br />
• Dolphin<br />
• Bongkot North<br />
• Bream<br />
• Jasmine<br />
• Abu Butabul<br />
• Panna/Mukta/Expansion<br />
• Rosetta<br />
• Hassi Ba Hamou<br />
• Risked exploration<br />
22
2007 results<br />
Production and price effects<br />
Canada<br />
T&T offshore<br />
T&T onshore<br />
Bolivia<br />
Brazil<br />
Norway<br />
Tax royalties PSC /Tax royalties with minor price impact PSC with price impact<br />
PSC price impact less than 15,000 boepd in 2012<br />
UK<br />
Algeria Tunisia<br />
Egypt<br />
Kazakhstan<br />
Oman<br />
India<br />
Thailand<br />
23
2007 results<br />
LNG: Outlook<br />
Liquefaction<br />
Shipping<br />
and<br />
Marketing<br />
* Pre-tax nominal return on capital invested<br />
Capital invested<br />
2009 – £0.8bn<br />
2008 – 13.5 mtpa<br />
2009 – 13.5 mtpa<br />
** EBITDA margin:<br />
• 1 mtpa = 51.7 tbtu<br />
• Portfolio average expressed as a percentage of sales at $7.25/mmbtu Henry Hub<br />
• Exchange rate assumption $2:£1<br />
• Excludes business development expenditure<br />
EBITDA margin raised from 18% to 30%<br />
Return *<br />
2008 – 15%<br />
2009 – 16% (was 13%)<br />
Volumes EBITDA margin **<br />
2008 – 30%<br />
2009 – 30% (was 18%)<br />
24
2007 results<br />
Framework for growth<br />
EPS<br />
2006 2009<br />
Schematic representation only<br />
Growth applies to the end of the period, within the period growth is non-linear<br />
* World total energy consumption 2003-2030. Source: EIA 2006<br />
** At $55 Brent conditions, $7.25 Henry Hub<br />
Outlook confirmed<br />
Key growth projects<br />
• Karachaganak<br />
• Buzzard<br />
• US LNG<br />
• Trinidad E&P/ LNG<br />
• Hasdrubal<br />
Based on firm<br />
projects<br />
In <strong>BG</strong> plans**<br />
Energy growth*<br />
Zero growth<br />
25
2007 results<br />
Capital investment 2007-2009 (£ billion)<br />
7.5<br />
0.3<br />
Prior year Exploration Acquisitions Inflation FX<br />
Current<br />
Maintaining capital discipline<br />
0.9<br />
0.7<br />
(0.6)<br />
8.8<br />
26
2007 results<br />
Capital structure and dividend<br />
• Capital investment for 2008 – 2009 £6.3 bn<br />
• Substantial growth in investment opportunities<br />
• Dividend re-based: +30%<br />
Long-term growth, good returns<br />
27
2007 results<br />
Summary<br />
• EPS +11% (+17% underlying*)<br />
• E&P production growth 2005 to 2012: CAGR 6-8%<br />
• LNG margin raised from 18% to 30%<br />
• Growing opportunity set<br />
• Positive outlook for EPS<br />
• Strong financial position, dividend re-based +30%<br />
* At constant upstream prices and US$/UK£ exchange rate<br />
Delivering value to shareholders<br />
28
<strong>BG</strong> <strong>Group</strong><br />
Portfolio for growth
Portfolio for growth<br />
Key country portfolio<br />
USA<br />
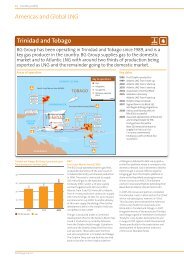
Trinidad &<br />
Tobago<br />
Brazil<br />
UK<br />
Norway<br />
Tunisia<br />
Nigeria<br />
Egypt<br />
Core countries Potential core countries<br />
Focusing on developing material countries<br />
Kazakhstan<br />
Oman<br />
India<br />
30
Portfolio for growth<br />
E&P asset base<br />
700<br />
600<br />
500<br />
400<br />
300<br />
200<br />
100<br />
<strong>BG</strong> net production (000’s boepd) of assets on stream at end 2006 only<br />
Assets in production in 2006 only<br />
0<br />
2006A 2009 2012 2015<br />
At 2008 reference conditions (see appendix)<br />
Excludes Buzzard as not on stream at end 2006<br />
Existing E&P assets provide a strong base<br />
31
Portfolio for growth<br />
LNG contracted volumes<br />
15<br />
10<br />
5<br />
<strong>BG</strong> contracted volumes mtpa<br />
Contracted volumes only<br />
0<br />
2006A 2009 2012 2015 2018 2021 2024<br />
LNG business underpinned by contracted volumes<br />
32
Portfolio for growth<br />
Global LNG & US: Industry context<br />
• Demand continuing to grow<br />
• Supply projects delayed<br />
– Cost escalation<br />
– Construction industry capacity<br />
– Government priorities<br />
<strong>BG</strong> portfolio : Longevity, cost leadership and global flexibility<br />
33
Portfolio for growth<br />
Global LNG & US: Costs<br />
1000<br />
World-wide liquefaction capex ($/tpa)<br />
800<br />
600<br />
400<br />
200<br />
0<br />
1998 2002 2006 2010<br />
Start up year<br />
Source: Poten & Partners, <strong>BG</strong><br />
Greenfield projects<br />
Expansion projects<br />
<strong>BG</strong> liquefaction projects*<br />
* <strong>BG</strong> investment<br />
Long-term, low cost advantage<br />
1000<br />
800<br />
600<br />
400<br />
200<br />
US regasification capex ($/mscfd)<br />
1998 2002 2006 2010<br />
Start up year<br />
Source: Public data, <strong>BG</strong><br />
Greenfield projects<br />
Expansion projects<br />
<strong>BG</strong> regasification projects*<br />
* <strong>BG</strong> investment<br />
34
Portfolio for growth<br />
Global LNG & US: Supply<br />
mtpa<br />
25<br />
20<br />
15<br />
10<br />
5<br />
0<br />
NLNG<br />
Train 7<br />
Contracted<br />
to 2023<br />
Australia<br />
Existing Future<br />
Building on material long-term base supply<br />
OKLNG<br />
& Brass<br />
Egypt<br />
& T&T<br />
Other term supply<br />
Nigerian LNG T4/5<br />
Equatorial Guinea<br />
Egyptian LNG T2<br />
Atlantic LNG T4<br />
Atlantic LNG T2/3<br />
35
Portfolio for growth<br />
Global LNG & US: Markets<br />
USA<br />
Mexico<br />
Chile<br />
Existing import capacity<br />
Existing liquefaction<br />
Trinidad<br />
UK<br />
Spain<br />
Current and future equity positions<br />
Nigeria<br />
Belgium<br />
Italy<br />
Egypt<br />
Flexible portfolio delivering volumes to premium markets<br />
EG<br />
Future import capacity<br />
Future liquefaction<br />
India<br />
S. Korea<br />
Taiwan<br />
In 2007, <strong>BG</strong> supplied 3.5 mtpa, or<br />
approximately 50%* of all Atlantic<br />
Basin volumes into Asia<br />
* Source: <strong>BG</strong>/CERA<br />
Japan<br />
Markets supplied in 2007<br />
Australia<br />
Long-term purchases (contracted)<br />
36
Portfolio for growth<br />
Global LNG & US: US portfolio<br />
Lake Charles<br />
Houston<br />
LNG<br />
Atlanta<br />
Cypress<br />
Masspower<br />
Elba Island<br />
Miami<br />
Lake Road<br />
New York<br />
Boston<br />
LNG<br />
Dighton<br />
Regasification<br />
Storage<br />
Strong US integrated position creates additional value<br />
Power<br />
Transport Markets<br />
37
Portfolio for growth<br />
Global LNG & US: Conclusions<br />
• Strong competitive position<br />
– Large, long-life supply base<br />
– Low cost structure<br />
– Flexible portfolio, serving global markets<br />
– <strong>Integrated</strong> US portfolio<br />
• Market-led strategy<br />
• Capturing value globally<br />
Sustainable competitive advantage<br />
38
Portfolio for growth<br />
UK: Jasmine<br />
30/6-7<br />
Discovery<br />
well<br />
30/6-7<br />
2008<br />
sidetracks<br />
30/6-6<br />
Jasmine<br />
discovery<br />
well<br />
30/6-6z<br />
sidetrack<br />
30/6-7 well<br />
Jasmine<br />
West<br />
Jasmine<br />
Northern Terrace<br />
Undrilled Potential<br />
Jasmine<br />
Northern<br />
Terrace<br />
Jasmine<br />
West<br />
Julia<br />
Horst<br />
<strong>Major</strong> discovery, with significant upside<br />
• <strong>BG</strong> 30.5%<br />
• Jasmine area appraisal ongoing<br />
• Jasmine West<br />
– Gross reserves 100-176-275 mmboe<br />
– Sidetrack well planned in 2008<br />
– Concept selection underway<br />
– Planned on stream 2011<br />
• Northern Terrace well success<br />
– Discovery well 30/6-7<br />
– Gross reserves 20-100+ mmboe<br />
– Sidetrack well planned in 2008<br />
39
Portfolio for growth<br />
UK: Jackdaw<br />
30/2a Lower<br />
Courageous<br />
30/2c Jade<br />
Jade<br />
Northern<br />
appraisal well<br />
30/2a-6<br />
Jackdaw<br />
30/2c<br />
UK<br />
30/3a<br />
Lower<br />
30/3b<br />
Norway<br />
Important HPHT discovery, appraisal underway<br />
• <strong>BG</strong> operator 30/2c and 30/2a<br />
• <strong>BG</strong> increased equity in Jackdaw<br />
– 30/2a <strong>BG</strong> 43.1% (from 34.4%)<br />
– 30/2c <strong>BG</strong> 36.0%<br />
• Gross reserves 20-140-250 mmboe<br />
• First appraisal well drilling<br />
• Second appraisal well in 2009<br />
• Well head platform development<br />
• Planned on stream 2013<br />
40
Portfolio for growth<br />
UK: Buzzard<br />
45<br />
30<br />
15<br />
Producers<br />
Injectors<br />
Field limit<br />
Dec 2007<br />
Field limit in 2003<br />
Southern terrace<br />
Northern panel<br />
Central panel<br />
Southern panel<br />
<strong>BG</strong> net production (000’s boepd)<br />
Enhancing reserves and production<br />
2km<br />
Further potential<br />
0<br />
2007A 2009 2011 2012 2013 2015<br />
At 2008 reference conditions (see appendix)<br />
• <strong>BG</strong> 21.73%<br />
• <strong>Major</strong> oil field, on stream 2007<br />
• Peak production 220,000 boepd<br />
• Field area extended<br />
• Gross reserves 600+ mmboe<br />
• Sweetening platform in 2010<br />
• Potential to extend plateau<br />
41
Portfolio for growth<br />
UK: Production<br />
200<br />
150<br />
100<br />
50<br />
0<br />
<strong>BG</strong> net production (000’s boepd)<br />
50 mmboe<br />
Producing Assets<br />
2006A 2009 2012 2015<br />
At 2008 reference conditions (see appendix)<br />
Further<br />
potential<br />
Delivering<br />
projects<br />
Potential to continue extending “plateau”<br />
• Delivering projects<br />
– Jasmine on stream 2011<br />
– Jackdaw on stream 2013<br />
– Other incrementals 2009+<br />
• “Plateau” of 50 mmboe to 2012<br />
• Further potential<br />
– Field upsides<br />
– Exploration<br />
42
Portfolio for growth<br />
Kazakhstan: Karachaganak<br />
Karachaganak performing strongly<br />
• Tenth anniversary of FPSA<br />
• Record production performance<br />
• Operations improvement projects<br />
• Fourth stabilisation train<br />
– Tie in during 2008 shutdown<br />
– On schedule for 2009<br />
• Western export capacity<br />
– Actual 2007: 9 mtpa<br />
– Post fourth train: 10.3 mtpa<br />
– Planned with Phase III: 16.1 mtpa<br />
• Long term Orenburg GSA in-place<br />
43
Portfolio for growth<br />
Kazakhstan: Karachaganak Phase III & beyond<br />
250<br />
200<br />
150<br />
100<br />
50<br />
0<br />
<strong>BG</strong> net production (000’s 000’s boepd) boepd<br />
2006A 2009 2012 2015 2018<br />
Phase II<br />
Phase IIM & de-bottlenecking<br />
4th Train & expanded Phase III with LPG<br />
Full Potential<br />
At 2008 reference conditions (see appendix)<br />
Overall profile inline but splits will change<br />
• Phase III being progressed<br />
– Development concept agreed<br />
– <strong>Gas</strong> sales 16 bcma confirmed<br />
– Expanded to include LPG<br />
– FEED over 50% complete<br />
Phase III expanded and being optimised during FEED<br />
– Gross reserves 2.4 bn boe<br />
– Sanction 2008; on stream 2012<br />
• Further potential in Karachaganak<br />
44
Portfolio for growth<br />
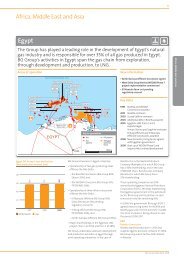
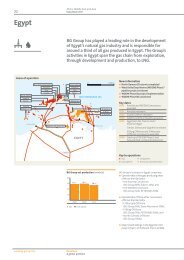
Egypt: E&P and LNG<br />
Seismic image<br />
El Burg<br />
<strong>BG</strong> 70%<br />
50km<br />
Damietta<br />
El Manzala<br />
<strong>BG</strong> 100%<br />
Port Said<br />
Excellent track record and enhanced outlook<br />
• Egypt gas production in 2007<br />
– <strong>BG</strong> fields produce over 40% of total<br />
– Split ca 50/50 domestic/LNG<br />
• WDDM Phase IV on stream<br />
• Rosetta Phase III on stream, Q1 ’08<br />
• Prospect inventory enhanced<br />
• Exploration drilling 2008<br />
– El Burg & El Manzala<br />
– Potential for early development<br />
45
Portfolio for growth<br />
Trinidad & Tobago<br />
Long-term production base with growth potential<br />
• Operational improvements<br />
• ECMA Dolphin<br />
– New domestic sales, 1.2 tcf<br />
– Start July 2009, 220 mmscfd<br />
– De-bottlenecking<br />
– Also, ca 1 tcf of uncontracted gas<br />
• NCMA – 3c/d Poinsettia project<br />
– Plateau maintenance<br />
• Farm-in to Block 5c (<strong>BG</strong> 30%)<br />
– Three wells<br />
– Successful tests on first well<br />
46
Portfolio for growth<br />
India<br />
Panna<br />
Mukta<br />
Tapti<br />
Gujarat <strong>Gas</strong><br />
Existing E&P assets<br />
<strong>BG</strong> in 0India<br />
Existing Distribution assets<br />
Mahanagar <strong>Gas</strong><br />
KG-OSN-2004/1<br />
New E&P acreage<br />
Expanding the portfolio across the gas chain<br />
• E&P volumes 2006-7 grew 33%<br />
• Secured KG–OSN–2004/1<br />
– 3D seismic in 2008<br />
• Delivered 5 LNG cargoes<br />
• Set up gas marketing business<br />
• T&D volumes 2006-7 grew 9%<br />
47
Portfolio for growth<br />
India<br />
60<br />
50<br />
40<br />
30<br />
20<br />
10<br />
0<br />
<strong>BG</strong> net production 000’s boepd<br />
<strong>BG</strong> net production (000’s boepd)<br />
Mukta Existing<br />
Panna Plan<br />
Panna Existing<br />
Tapti Existing<br />
Panna/Mukta Potential<br />
Mukta Plan<br />
Tapti Plan<br />
2006A 2009 2012 2015 2018<br />
At 2008 reference conditions (see appendix)<br />
• Panna (<strong>BG</strong> 30%)<br />
Significant potential in existing producing assets<br />
– Gross HIIP 1.7 bn boe<br />
– Added 2 WHP’s and 15 wells<br />
– Started 2 WHP’s, 9 wells, 21 infills<br />
• Mukta (<strong>BG</strong> 30%)<br />
– Gross HIIP 900 mmboe<br />
– New 3D seismic underway<br />
– Re-drilling 3 wells in process<br />
– Evaluating further development<br />
• Tapti (<strong>BG</strong> 30%)<br />
– Completion of mid-Tapti project<br />
– Further compression & satellites<br />
– Extends plateau<br />
48
Portfolio for growth<br />
Tunisia<br />
60<br />
50<br />
40<br />
30<br />
20<br />
10<br />
0<br />
<strong>BG</strong> net production (000’s boepd)<br />
Hasdrubal<br />
Miskar Infill/<br />
Debottlenecking<br />
Miskar<br />
2006A 2009 2012 2015 2018<br />
At 2008 reference conditions (see appendix)<br />
Miskar North<br />
Exploration<br />
Optimising Miskar, developing Hasdrubal<br />
• Miskar (<strong>BG</strong> 100%)<br />
– 3 infill wells drilled in 2007<br />
– 3 infill wells in 2008/09<br />
– 5% de-bottlenecking by 2009<br />
– Miskar North drilling<br />
• Hasdrubal (<strong>BG</strong> 50%)<br />
– Offshore platform / 6 wells<br />
– Project ca 45% complete<br />
– On stream 2009<br />
49
Portfolio for growth<br />
Thailand: Bongkot<br />
30<br />
20<br />
10<br />
0<br />
<strong>BG</strong> net production (000’s boepd)<br />
BN Phase 3E, 3F, 3G, 3H<br />
Bongkot North (BN) Existing<br />
Full potential<br />
Bongkot South<br />
2006A 2009 2012 2015<br />
At 2008 reference conditions (see appendix)<br />
Growing production into the next decade<br />
• Bongkot North (<strong>BG</strong> 22.22%)<br />
– Record production in 2007<br />
– Continuing to extend plateau<br />
– Licence extended to 2023<br />
– Three E&A wells in 2008<br />
• Bongkot South (<strong>BG</strong> 22.22%)<br />
– Five successful E&A wells in 2007<br />
– Licence extended to 2023<br />
– Gross reserves 1.2 tcf, 22 mmbbls<br />
– CPP, 13 WHPs, ca 100 wells<br />
– Sanction 2008, first gas 2011/12<br />
50
Portfolio for growth<br />
Nigeria<br />
OKLNG<br />
OPL 332<br />
Upstream<br />
focus area<br />
OPL 286-DO<br />
50km<br />
Two further<br />
farm-ins*<br />
Opportunities in LNG and E&P<br />
• OKLNG (<strong>BG</strong> 14.25%)<br />
– Four trains, ca 5.5 mtpa each<br />
– Shareholders Agreement signed<br />
– Technical and cost reviews<br />
• OPL 332 (<strong>BG</strong> 45% & operator)<br />
– Frontier block, E&A drilling 2009<br />
• OPL 286-DO (<strong>BG</strong> 66% & operator)<br />
– Boi discovery ca 100 mmboe gross<br />
– Gross unrisked potential > 1bn boe<br />
– E&A drilling in 2008 and 2009<br />
• Two further farm-ins*<br />
* Subject to Government approval<br />
51
Portfolio for growth<br />
Oman: Abu Butabul<br />
Multi tcf discovery under appraisal<br />
• <strong>BG</strong> 100%, 30 year EPSA<br />
• Gross GIIP 2-11-17 tcf<br />
• Field 3D seismic acquired<br />
• Two rigs secured for appraisal<br />
• Appraisal drilling commenced<br />
– 6-8 wells in 2007/8<br />
– Vertical wells, proppant fracs<br />
• Targeting production end 2010/11<br />
– FEED in 2008<br />
– Initial offtake of 150-250 mmscfd<br />
• Exploration area seismic acquired<br />
52
Portfolio for growth<br />
Norway<br />
Exploration drilling<br />
Appraisal drilling<br />
Jordbaer<br />
North<br />
Sea<br />
PI North<br />
Bergen<br />
Nucula<br />
discovery<br />
Norwegian<br />
Sea<br />
Mandarin<br />
Ververis<br />
Barents<br />
Sea<br />
Trondheim<br />
Bream discovery<br />
Oslo<br />
Tromso<br />
Significant year for <strong>BG</strong> in Norway<br />
• <strong>BG</strong> 22 licences, 14 operated<br />
• Drilling 4 prospects in 2008<br />
– 3 <strong>BG</strong> operated<br />
– Mandarin & Jordbaer high impact<br />
• Rigs secured<br />
• Further drilling in 2009<br />
• Bream (<strong>BG</strong> 40% & operator)<br />
– Key appraisal well 2008<br />
• Assessing Nucula discovery<br />
53
Portfolio for growth<br />
Australia: Queensland <strong>Gas</strong> Co (QGC) alliance<br />
Australia<br />
QGC assets in<br />
Walloon Fairway<br />
Surat Basin<br />
Adelaide<br />
Melbourne<br />
Canberra<br />
Entry into Australia<br />
Proposed<br />
LNG plant<br />
Sydney<br />
Brisbane<br />
200 km<br />
• <strong>BG</strong>/QGC alliance<br />
– 20% of assets / 9.9% shares<br />
– Consideration £299m<br />
– Option for further 10% of assets<br />
• High quality, low cost CSG* play<br />
• Early stage of exploitation<br />
• Over 7 tcf resource potential<br />
• Domestic market growth<br />
• Proposed 3-4 mtpa LNG plant<br />
* CSG = Coal Seam <strong>Gas</strong><br />
54
Portfolio for growth<br />
Brazil: Comgas<br />
Gás Natural da Bolivia<br />
GASBOL<br />
Piracicaba<br />
Sumaré<br />
São Paulo state<br />
Indaiatuba<br />
Gása para a Região Sul<br />
GASBOL – Fase 2<br />
100km<br />
Rio Claro<br />
Limeira<br />
Minas Gerais<br />
Valinhos<br />
Americana<br />
Braganca<br />
Campinas<br />
Jundiai<br />
Castelo<br />
Itatiba<br />
São Paulo<br />
Campinas II<br />
RMSP<br />
São Paulo<br />
Santos<br />
Bacia de Santos<br />
GASAN<br />
Legend<br />
Expansion Projects in place<br />
Future Expansion Projects<br />
Taubaté<br />
São José dos Campos<br />
Bacia de<br />
Santos<br />
GASPAL<br />
Rio de Janeiro<br />
Atlantic Ocean<br />
Good potential for continued growth<br />
• Brazil’s largest gas distributor<br />
– 2007 gas sales 13.8 mmcmd<br />
– Over 570,000 customers connected<br />
• Customer growth 8.7% pa 2002-07<br />
• Good economic outlook<br />
• Potential to grow market<br />
– Geographic expansion<br />
– Focus on residential & commercial<br />
• Regulatory tariff review 2009<br />
55
Portfolio for growth<br />
Brazil: Santos Basin overview<br />
BM-S- 13<br />
BM-S- 47<br />
50 km<br />
BM-S- 52<br />
Rio de Janeiro<br />
BM-S- 50<br />
Parati<br />
BM-S- 9<br />
Carioca<br />
BM-S- 10<br />
Tupi<br />
BM-S- 11<br />
<strong>Major</strong> new hydrocarbon province<br />
• Santos Basin Pre-Salt<br />
– 300 km offshore<br />
– Water depth 2,000m+<br />
– Salt layers up to 2,000m thick<br />
– Carbonate reservoirs<br />
• <strong>BG</strong> well results to date<br />
– Four out of four successful wells<br />
– Exhibit excellent reservoir quality*<br />
* Test rates limited by equipment<br />
56
Portfolio for growth<br />
Brazil: Tupi<br />
Iracema<br />
Tupi-1<br />
Tupi Sul<br />
World class oil discovery<br />
20 km<br />
• <strong>BG</strong> equity 25%; area 1,200 sq kms<br />
• Gross HIIP now 12-30+ billion boe<br />
• Tupi & Iracema likely one structure<br />
• Multiple stacked reservoirs<br />
• Well rates 10-20,000+ boepd<br />
• Oil 28 o API<br />
• GOR 1100-1200 scf/stb<br />
• Re-entry & EWT Tupi Sul 2008/9<br />
• Further appraisal wells 2009<br />
57
Portfolio for growth<br />
Brazil: Tupi schematic section<br />
NW<br />
Sag<br />
Upper Rift<br />
Upper Rift<br />
Lower Rift<br />
Basement<br />
Tupi Sul established three reservoirs<br />
Tupi-1 Tupi Sul<br />
3 km<br />
SE<br />
58
Portfolio for growth<br />
Brazil: Tupi notional development sequence<br />
FPSO<br />
spread<br />
Flexible, phased approach to development<br />
EWT to assess long term deliverability & producibility<br />
e.g. 1 or 2 wells initially, then further use for appraisal<br />
Gross production up to 20,000 bopd; Date 2009+<br />
Production pilot to assess water & gas injection performance<br />
e.g. 3 Producers, 1 gas injector & 1 water injector<br />
Gross production 50-100,000 bopd and gas utilisation; Date 2011+<br />
Initial development module utilising large scale FPSO<br />
e.g. 10+ wells & gas export infrastructure<br />
Gross production 100-200,000 bopd and 100-200 mmscfd of gas; Date 2013+<br />
Full field development using multiple FPSO’s 5-10 modules<br />
e.g. 10+ wells per FPSO & gas export infrastructure<br />
Gross production 500-1,000,000 bopd and 500-1,000 mmscfd of gas; Date 2015+<br />
59
Portfolio for growth<br />
Brazil: 2008 drilling and key prospects<br />
BM-S- 13<br />
<strong>BG</strong> 60%<br />
BM-S- 52<br />
<strong>BG</strong> 40%<br />
Corcovado (1), (2)<br />
BM-S- 47<br />
<strong>BG</strong> 50%<br />
Saleta (1)<br />
(1) Planned 2008 drilling<br />
(2) Key prospects<br />
BM-S- 50<br />
<strong>BG</strong> 20%<br />
BM-S- 10<br />
<strong>BG</strong> 25%<br />
Parati<br />
Carioca<br />
Good prospect inventory with two very significant prospects<br />
Tupi<br />
Tupi<br />
BM-S- 11<br />
<strong>BG</strong> 25%<br />
Iara (1)<br />
BM-S- 9<br />
<strong>BG</strong> 30%<br />
“Iguaçu Complex” (2)<br />
Guará (1)<br />
60<br />
60
Portfolio for growth<br />
E&P: E&A progress<br />
• Completed 20 wells, 12 successes<br />
• Key successes<br />
Building future growth<br />
Drilling 2007 Seismic 2007<br />
– Tupi Sul and Carioca (Brazil)<br />
– Jasmine Northern Terrace (UK)<br />
– Bongkot South (Thailand)<br />
– Margarita/Huacaya (Bolivia)<br />
New Licences 2007<br />
• Over 4,600 sq km gross acreage<br />
acquired<br />
– UK, T&T, India, Norway & Canada<br />
Canada<br />
T&T<br />
Brazil<br />
Algeria<br />
• 3D: 10,500 sq kms<br />
• 2D: 14,500 line kms<br />
UK<br />
Norway<br />
Libya<br />
Nigeria<br />
New seismic<br />
Oman<br />
China<br />
61
Portfolio for growth<br />
E&P: 2008 E&A preview<br />
Alaska<br />
1 well<br />
1 well<br />
T&T<br />
4 wells<br />
1 well<br />
Canada<br />
3 wells<br />
Brazil<br />
3-4 wells<br />
Tunisia<br />
1 well<br />
1 well<br />
Tunisia Algeria<br />
Tunisia 2-3 wells<br />
3 wells<br />
UK<br />
4 wells<br />
1 well<br />
Nigeria<br />
1 well<br />
Norway<br />
3 wells<br />
1 well<br />
Libya<br />
1-2 wells<br />
Oman<br />
6-8 wells<br />
Egypt<br />
1-2 wells<br />
Over 40 E&A wells planned to complete in 2008<br />
India<br />
0-1 well<br />
Summary of wells<br />
New plays<br />
Play extenders<br />
Appraisal/Near term<br />
production<br />
Thailand<br />
3 wells<br />
4-6<br />
17-19<br />
20-23<br />
62
Portfolio for growth<br />
E&P: Prospect inventory<br />
Other<br />
Egypt<br />
Nigeria<br />
Total risked exploration resources: 3,356 mmboe<br />
UK<br />
Norway<br />
China<br />
Brazil<br />
Deepwater<br />
Offshore Conventional<br />
Onshore<br />
Well balanced inventory, around 75% of resources are operated<br />
63
Portfolio for growth<br />
E&P: Reserves and resources<br />
10000<br />
mmboe<br />
8000<br />
6000<br />
4000<br />
2000<br />
0<br />
7,071<br />
2,440<br />
1,211<br />
1,236<br />
2,184<br />
2005 2006 2007<br />
SEC Proved Reserves Probable Reserves Un-booked Resources Risked Exploration<br />
Reserves/Resources as at year end<br />
*Based on 2007 production of 220.3 mmboe and cumulative reserves/resources<br />
Added over 2 bn boe in 2007<br />
CAGR 19%<br />
8,017<br />
2,713<br />
1,772<br />
1,383<br />
2,149<br />
10,046<br />
3,356<br />
3,122<br />
1,529<br />
2,039<br />
Reserves/<br />
Production*<br />
46 Years<br />
30 Years<br />
16 Years<br />
9.3 Years<br />
64
Portfolio Portfolio for growth growth<br />
E&P: Reserves Sustainable and production resourcesgrowth<br />
2000<br />
1500<br />
1000<br />
500<br />
0<br />
2005 2005A 2020<br />
Within the period growth is non-linear<br />
At 2008 reference conditions (see appendix)<br />
Total Strong resource sustainable base production supports 8% outlook growth<br />
1.6 million boepd<br />
CAGR 8%<br />
10,046<br />
mmboe<br />
3,356<br />
1.2 million boepd<br />
CAGR 6% 3,122<br />
1,529<br />
2,039<br />
SEC Proved Reserves<br />
Probable Reserves<br />
Un-booked Resources<br />
Risked Exploration<br />
65
<strong>BG</strong> <strong>Group</strong><br />
Conclusions
<strong>The</strong> <strong>Integrated</strong> <strong>Gas</strong> <strong>Major</strong><br />
Key messages<br />
• Good 2007 results<br />
• LNG flexibility delivering value<br />
• Earnings outlook to 2009 confirmed<br />
• Total E&P resources now 10 bn boe, up 2 bn boe<br />
• E&P production potential 6-8% CAGR 2005 to 2020<br />
Delivering value to shareholders<br />
67
<strong>BG</strong> <strong>Group</strong><br />
Appendix
Appendix<br />
Key assumptions<br />
REFERENCE CONDITIONS<br />
• Brent Oil price US $55/bbl<br />
• US Henry Hub $7.25/mmBtu<br />
• US/UK exchange rates of $2:£1<br />
• Prepared under International Financial Reporting Standards<br />
• All production includes fuel gas<br />
PRINCIPAL RISKS<br />
• <strong>Major</strong> recession or significant political upheaval in the major markets in which we operate<br />
• Failure to ensure the safe operation of our assets world-wide<br />
• Implementation risk, being the challenges associated with delivering capital intensive projects on time and on<br />
budget, including the need to retain and motivate staff<br />
• Commodity risk, being the risk of significant fluctuation in oil and/or gas prices from those assumed<br />
• Foreign exchange risk, in particular the US$:UK£ exchange rate being significantly different to that assumed<br />
• Technical, commercial, economic, regulatory and country risk<br />
For a detailed discussion of these and other risk factors, please refer to the Risk Factors included in <strong>BG</strong> <strong>Group</strong>’s Annual<br />
Report and Accounts 2006.<br />
Actual performance could differ materially from that shown. Accordingly, no assurances can be given that such<br />
performance will be achieved.<br />
69
Appendix<br />
Glossary<br />
∆ Increase or (decrease)<br />
$ United States dollar<br />
£ UK pounds sterling<br />
£m Million UK pounds sterling<br />
‘000 Thousand<br />
2D Two dimensional seismic<br />
3D Three dimensional seismic<br />
API American Petroleum Institute<br />
bcma Billion cubic metres per annum<br />
billion or bn One thousand million<br />
boe Barrels of oil equivalent<br />
boepd Barrels of oil equivalent per day<br />
bopd Barrels of oil per day<br />
ca circa<br />
CAGR Compound Annual Growth Rate<br />
Capex Capital expenditure<br />
CATS Central Area Transmission System<br />
CPP Central Processing Platform<br />
E&A Exploration and Appraisal<br />
E&P Exploration and Production<br />
EBITDA Earnings Before Interest, Tax, Depreciation, Amortisation<br />
ECMA East Coast Marine Area<br />
EPS Earnings per share<br />
EPSA Exploration & Production Sharing Agreement<br />
EWT Extended Well Test<br />
F&D Finding and Development costs<br />
FEED Front End Engineering and Design<br />
FPSA Final Production Sharing Agreement<br />
FPSO Floating Production Storage and Offloading<br />
FX Foreign Exchange<br />
GAAP Generally Accepted Accounting Principles<br />
GIIP <strong>Gas</strong> Initially In Place<br />
GOR <strong>Gas</strong> Oil Ratio<br />
GSA <strong>Gas</strong> Sales Agreement<br />
HIIP Hydrocarbons initially in place<br />
HPHT High pressure high temperature<br />
IFRIC International Financial Reporting Interpretation<br />
Committee<br />
IFRS International Financial Reporting Standards<br />
km Kilometres<br />
LNG Liquefied Natural <strong>Gas</strong><br />
LPG Liquid Petroleum <strong>Gas</strong><br />
m Metres<br />
mmboe Million barrels of oil equivalent<br />
mmbtu Million British thermal units<br />
mmcmd Million cubic metres per day<br />
mscfd Thousand standard cubic feet per day<br />
mmscfd Million standard cubic feet per day<br />
mtpa Million tonnes per annum<br />
NCMA North Coast Marine Area<br />
Opex Operating costs<br />
pa Per annum<br />
PSC Production Sharing Contract<br />
scf/stb Standard cubic feet per stock tank barrel<br />
SEC US Securities and Exchange Commission<br />
sq km Square kilometres<br />
T&D Transmission and Distribution<br />
T&T Trinidad & Tobago<br />
tbtu Trillion British thermal units<br />
tcf Trillion cubic feet<br />
tpa Tonnes per annum<br />
WDDM West Delta Deep Marine<br />
WHP Well Head Platform<br />
YOY Year on Year<br />
70