DATA HIGHLIGHTS - Census of India Website
DATA HIGHLIGHTS - Census of India Website
DATA HIGHLIGHTS - Census of India Website

You also want an ePaper? Increase the reach of your titles
YUMPU automatically turns print PDFs into web optimized ePapers that Google loves.
Page 1 <strong>of</strong> 4<br />
Source: Office <strong>of</strong> the Registrar General, <strong>India</strong><br />
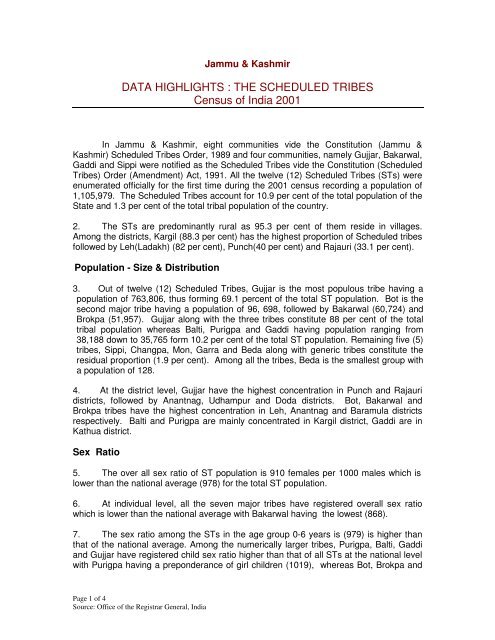
Jammu & Kashmir<br />
<strong>DATA</strong> <strong>HIGHLIGHTS</strong> : THE SCHEDULED TRIBES<br />
<strong>Census</strong> <strong>of</strong> <strong>India</strong> 2001<br />
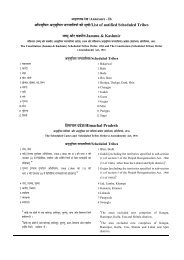
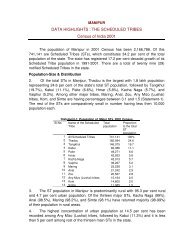
In Jammu & Kashmir, eight communities vide the Constitution (Jammu &<br />
Kashmir) Scheduled Tribes Order, 1989 and four communities, namely Gujjar, Bakarwal,<br />
Gaddi and Sippi were notified as the Scheduled Tribes vide the Constitution (Scheduled<br />
Tribes) Order (Amendment) Act, 1991. All the twelve (12) Scheduled Tribes (STs) were<br />
enumerated <strong>of</strong>ficially for the first time during the 2001 census recording a population <strong>of</strong><br />
1,105,979. The Scheduled Tribes account for 10.9 per cent <strong>of</strong> the total population <strong>of</strong> the<br />
State and 1.3 per cent <strong>of</strong> the total tribal population <strong>of</strong> the country.<br />
2. The STs are predominantly rural as 95.3 per cent <strong>of</strong> them reside in villages.<br />
Among the districts, Kargil (88.3 per cent) has the highest proportion <strong>of</strong> Scheduled tribes<br />
followed by Leh(Ladakh) (82 per cent), Punch(40 per cent) and Rajauri (33.1 per cent).<br />
Population - Size & Distribution<br />
3. Out <strong>of</strong> twelve (12) Scheduled Tribes, Gujjar is the most populous tribe having a<br />
population <strong>of</strong> 763,806, thus forming 69.1 percent <strong>of</strong> the total ST population. Bot is the<br />
second major tribe having a population <strong>of</strong> 96, 698, followed by Bakarwal (60,724) and<br />
Brokpa (51,957). Gujjar along with the three tribes constitute 88 per cent <strong>of</strong> the total<br />
tribal population whereas Balti, Purigpa and Gaddi having population ranging from<br />
38,188 down to 35,765 form 10.2 per cent <strong>of</strong> the total ST population. Remaining five (5)<br />
tribes, Sippi, Changpa, Mon, Garra and Beda along with generic tribes constitute the<br />
residual proportion (1.9 per cent). Among all the tribes, Beda is the smallest group with<br />
a population <strong>of</strong> 128.<br />
4. At the district level, Gujjar have the highest concentration in Punch and Rajauri<br />
districts, followed by Anantnag, Udhampur and Doda districts. Bot, Bakarwal and<br />
Brokpa tribes have the highest concentration in Leh, Anantnag and Baramula districts<br />
respectively. Balti and Purigpa are mainly concentrated in Kargil district, Gaddi are in<br />
Kathua district.<br />
Sex Ratio<br />
5. The over all sex ratio <strong>of</strong> ST population is 910 females per 1000 males which is<br />
lower than the national average (978) for the total ST population.<br />
6. At individual level, all the seven major tribes have registered overall sex ratio<br />
which is lower than the national average with Bakarwal having the lowest (868).<br />
7. The sex ratio among the STs in the age group 0-6 years is (979) is higher than<br />
that <strong>of</strong> the national average. Among the numerically larger tribes, Purigpa, Balti, Gaddi<br />
and Gujjar have registered child sex ratio higher than that <strong>of</strong> all STs at the national level<br />
with Purigpa having a preponderance <strong>of</strong> girl children (1019), whereas Bot, Brokpa and
Bakarwal have registered the child sex ratio lower than that recorded by all STs at the<br />
national level.<br />
Age group<br />
All STs<br />
(<strong>India</strong> )<br />
All STs<br />
(J & K )<br />
Page 2 <strong>of</strong> 4<br />
Source: Office <strong>of</strong> the Registrar General, <strong>India</strong><br />
Statement - 1 : Sex Ratio<br />
Gaddi Bot Balti Brokpa Gujjar Purigpa Bakarwal<br />
All ages 978 910 948 941 936 916 908 903 868<br />
0 – 6 yrs. 973 979 989 965 994 938 985 1019 928<br />
Literacy & Educational Level<br />
8. The over all literacy rate <strong>of</strong> the STs is 37.5 per cent at 2001 census. This is much<br />
lower than the national average <strong>of</strong> 47.1 per cent) aggregated for all STs. Male and<br />
female literacy rates (48.2 per cent and 25.5 per cent) are much below if compared to<br />
those recorded by all STs at the national level (59.2 per cent & 34.8 per cent).<br />
9. Among the larger tribes, Balti, Bot, Purigpa and Brokpa have registered higher<br />
literacy rate whereas Gujjar, Gaddi and Bakarwal have a lower literacy rate than that <strong>of</strong><br />
the the national average. Similar trends are discerned in these tribes in respect <strong>of</strong><br />
female literacy also.<br />
Statement - 2 : Literacy Rate<br />
Literacy<br />
rate<br />
All STs Balti Bot Purigpa Brokpa Gaddi Gujjar Bakarwal<br />
Persons 37.5 62.1 61.3 60.9 55.5 37.3 31.7 22.5<br />
Females 25.5 45.4 50.3 44.2 38.6 19.6 20.4 12.8<br />
10. Among the ST literates, 34.9 per cent <strong>of</strong> tribal literates are either without any<br />
educational level or have attained education below primary level. The primary level<br />
literates constitute 26.2 per cent followed by literates up to middle level (22.1 per cent).<br />
The persons educated up to matric/secondary/higher secondary constitute 14.7 per cent<br />
whereas 2 per cent only are graduates & above. Non-technical & technical diploma<br />
holders form negligible percentage (0.1).<br />
11. At the level <strong>of</strong> individual tribe, Bot, Balti, Purigpa have more than 22 per cent<br />
literates are matriculates, implying that every 4 th literate <strong>of</strong> these tribes are matriculates.<br />
Bakarwal have the lowest proportion <strong>of</strong> secondary level literates(7.8 per cent).<br />
12. The data show that the proportion <strong>of</strong> literates after middle school drops down to<br />
approximately half in the secondary level <strong>of</strong> education and declines sharply onwards.
Names <strong>of</strong><br />
STs<br />
Statement- 3 : Levels <strong>of</strong> Education among the major Scheduled Tribes<br />
Literate<br />
without<br />
educational<br />
level<br />
Page 3 <strong>of</strong> 4<br />
Source: Office <strong>of</strong> the Registrar General, <strong>India</strong><br />
Below<br />
primary Primary Middle<br />
Educational levels attained<br />
Matric/Secondary<br />
Higher Secondary/<br />
Intermediate etc.<br />
Technical &<br />
Nontechnical<br />
diploma etc.<br />
Graduate<br />
and above<br />
All STs 8.4 26.5 26.2 22.1 14.7 0.1 2<br />
Gujjar 9.9 28.6 27.6 22.1 10.3 nil 1.5<br />
Bot. 6.6 19.7 25 20.6 23.9 0.1 3.9<br />
Bakarwal 18.3 30 26 16.8 7.8 nil 1<br />
Brokpa 3.8 24.6 22.5 26 20.2 0.1 2.8<br />
Balti 3.1 23.2 22.8 24.7 23.9 0.1 2.2<br />
Purigpa 3.2 25.2 22.7 24 22.6 0.1 2<br />
Gaddi 6.6 31.4 28.4 19 12.5 nil 2.1<br />
13. The census 2001 figures depict that less than half (44 per cent) <strong>of</strong> total 3.2 lakh<br />
tribal children in the age group <strong>of</strong> 5 -14 years attend school. Around 1.4 lakh (56 per<br />
cent) children do not attend school. At the individual level, Purigpa, Balti and Bot have<br />
74 - 78 per cent children in the corresponding age group go to school whereas Brokpa<br />
have 60.2 per cent school going children. Bakarwal have the lowest proportion <strong>of</strong> school<br />
going children.<br />
Statement - 4 : Percentage <strong>of</strong> School going Children in the age group 5-14 yrs.<br />
Age group All STs Bot Balti Purigpa Brokpa Gaddi Gujjar Bakarwal<br />
5 -14 yrs. 44 78.2 74.7 74.2 60.2 44.9 38.5 25.8<br />
Work Participation Rate (WPR)<br />
14. The Work Participation Rate (WPR) <strong>of</strong> the ST population is 43.9 per cent which is<br />
lower than that <strong>of</strong> the total STs at the national level (49.1 per cent). Both male (50.9 per<br />
cent) and female work participation rate (36.1 per cent) among the tribes are lower than<br />
the corresponding figures (53.2 per cent male WPR and 44.8 per cent female WPR)<br />
recorded by total STs at the country level. Among the total workers, 57.4 per cent are<br />
main workers and this proportion is considerably lower than the national average(68.9<br />
per cent).<br />
15. Among the major tribal groups, Bakarwal, Bot, Gaddi and Purigpa have higher<br />
WPR than the State average. Similar trend has been shown by these tribes in respect <strong>of</strong><br />
female WPR also.<br />
Category <strong>of</strong> Workers<br />
16. Agriculture is the main economic activity <strong>of</strong> the tribes <strong>of</strong> Jammu & Kashmir as<br />
58.5 per cent <strong>of</strong> total workers are ‘Cultivators’ which is significantly higher than the<br />
national average <strong>of</strong> 44.7 per cent. ‘Other Workers’ constitute 32.7 per cent and this
proportion is also twice that <strong>of</strong> the national average (16.3 per cent). ‘Agricultural<br />
Labourers’ constitute only 6.4 per cent which is significantly lower than that <strong>of</strong> all STs at<br />
the national level (36.9 per cent) and workers in ‘Household Industry’ account for 2.4 per<br />
cent which is at par with the national average <strong>of</strong> 2.1 per cent.<br />
Statement- 5 : Percentage Distribution <strong>of</strong> Workers in four Economic Categories<br />
Ecnomic<br />
category All STs Gujjar Bot Bakarwal Brokpa Balti Purigpa Gaddi<br />
Cultivators 58.5 61.5 49.1 37.6 59.8 48.9 55.9 78<br />
Agricultural<br />
Labourers<br />
Page 4 <strong>of</strong> 4<br />
Source: Office <strong>of</strong> the Registrar General, <strong>India</strong><br />
6.4 7.7 4.3 3.5 3.5 2.4 1.2 1.8<br />
HHI Workers 2.4 2.7 1.6 2.3 1.6 2.1 1 1<br />
Other<br />
Workers<br />
32.7 28 45 56.7 35 46.5 41.9 19.2<br />
17. Among the major tribes, Gaddi have the highest share <strong>of</strong> ‘Cultivators’ among<br />
their total workers followed by Gujjar, Brokpa and Purigpa. Bakarwal have the highest<br />
proportion <strong>of</strong> ‘Other Workers’, followed by Balti and Bot .<br />
Marital Status<br />
18. The data on marital status <strong>of</strong> the STs show that the proportion <strong>of</strong> ‘never married’<br />
persons (57.2 per cent) exceeds the ‘married’ persons (39.7 per cent). ‘Widowed’<br />
persons form 2.8 per cent while a negligible 0.3 per cent are ‘divorced and separated’.<br />
19. Marriages <strong>of</strong> girls and boys below the legal age for each are not commonly<br />
practised by the tribal communities <strong>of</strong> Jammu & Kashmir. The proportions <strong>of</strong> the married<br />
girls below 18 year (2 per cent) and married boys below 21 years (2.7 per cent) are<br />
nearly equal to those registered by the total STs at the national level (2.1 per cent & 2.8<br />
per cent respectively). Among the larger tribes, Bot, Brokpa, Balti and Purigpa have<br />
registered the proportions <strong>of</strong> married girls and boys below the legal age for each lower<br />
than those <strong>of</strong> the State average.<br />
20. The mean number <strong>of</strong> children ever born per ever married ST woman (age-group<br />
45 - 49yrs.) is 5 which is higher than that <strong>of</strong> all STs at the national level(4).<br />
Religion<br />
21. Islam is the predominant religion <strong>of</strong> the STs <strong>of</strong> the State (86.3 per cent).<br />
Buddhist and Hindu tribes constitute 9.3 per cent and 4.3 per cent respectively. Among<br />
the major tribes, 99.3 per cent population <strong>of</strong> Gujjar and Bakarwal are Muslims followed<br />
by Brokpa (95.2 per cent). While Gaddi are primarily Hindus (98.7 per cent) and Bot are<br />
Buddhists (95.9 per cent ).<br />
.<br />
_________