Notes about Complex and Discrete Fourier Series - Whitman People
Notes about Complex and Discrete Fourier Series - Whitman People
Notes about Complex and Discrete Fourier Series - Whitman People

Create successful ePaper yourself
Turn your PDF publications into a flip-book with our unique Google optimized e-Paper software.
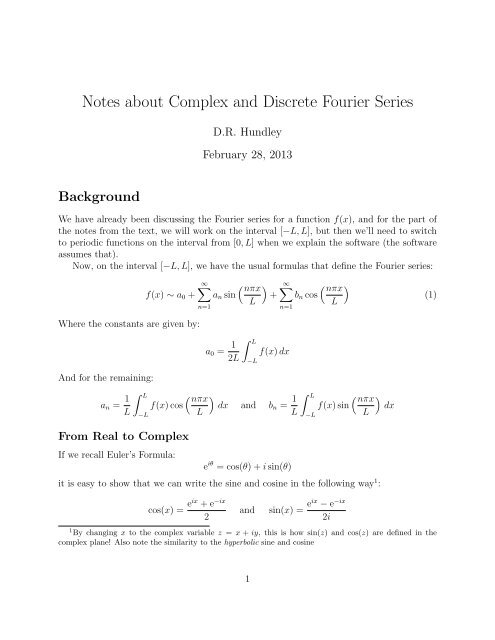
<strong>Notes</strong> <strong>about</strong> <strong>Complex</strong> <strong>and</strong> <strong>Discrete</strong> <strong>Fourier</strong> <strong>Series</strong><br />
Background<br />
D.R. Hundley<br />
February 28, 2013<br />
We have already been discussing the <strong>Fourier</strong> series for a function f(x), <strong>and</strong> for the part of<br />
the notes from the text, we will work on the interval [−L, L], but then we’ll need to switch<br />
to periodic functions on the interval from [0, L] when we explain the software (the software<br />
assumes that).<br />
Now, on the interval [−L, L], we have the usual formulas that define the <strong>Fourier</strong> series:<br />
f(x) ∼ a0 +<br />
Where the constants are given by:<br />
And for the remaining:<br />
an = 1<br />
L<br />
f(x) cos<br />
L −L<br />
From Real to <strong>Complex</strong><br />
If we recall Euler’s Formula:<br />
∞ <br />
nπx<br />
<br />
an sin +<br />
L<br />
n=1<br />
∞ <br />
nπx<br />
<br />
bn cos<br />
L<br />
n=1<br />
a0 = 1<br />
L<br />
f(x) dx<br />
2L −L<br />
<br />
nπx<br />
<br />
dx <strong>and</strong> bn =<br />
L<br />
1<br />
L<br />
f(x) sin<br />
L −L<br />
e iθ = cos(θ) + i sin(θ)<br />
<br />
nπx<br />
<br />
dx<br />
L<br />
it is easy to show that we can write the sine <strong>and</strong> cosine in the following way 1 :<br />
cos(x) = eix + e −ix<br />
2<br />
<strong>and</strong> sin(x) = eix − e −ix<br />
1 By changing x to the complex variable z = x + iy, this is how sin(z) <strong>and</strong> cos(z) are defined in the<br />
complex plane! Also note the similarity to the hyperbolic sine <strong>and</strong> cosine<br />
1<br />
2i<br />
(1)
Geometrically, the magnitude of e iθ is 1 (you should check that), so that e iθ is a point on the<br />
unit circle (plotted in the complex plane). We might also note that 1 = −i. Substitution of<br />
i<br />
these expressions into the <strong>Fourier</strong> series, we get:<br />
a0 +<br />
∞<br />
n=1<br />
an<br />
<br />
iθ −iθ e + e<br />
+<br />
2<br />
∞<br />
<br />
iθ −iθ e − e<br />
(−i)bn<br />
2<br />
where θ = nπx.<br />
We should be able to verify then that the expression can be re-arranged to<br />
L<br />
get:<br />
a0 + 1<br />
∞<br />
(an − ibn)e<br />
2<br />
iθ + 1<br />
∞<br />
(an + ibn)e<br />
2<br />
−iθ<br />
n=1<br />
Going back to our definitions, we can show that, as a function of n, a−n = an <strong>and</strong> b−n = −bn.<br />
Substituting a dummy index:<br />
a0 + 1<br />
2<br />
n=1<br />
n=1<br />
−∞<br />
(a−n − ib−n)e −iθ + 1<br />
n=−1<br />
We can re-write using symmetry:<br />
Finally, if we define<br />
a0 + 1<br />
2<br />
−∞<br />
n=−1<br />
(an + ibn)e −iθ + 1<br />
2<br />
2<br />
∞<br />
(an + ibn)e −iθ<br />
n=1<br />
∞<br />
(an + ibn)e −iθ<br />
n=1<br />
c0 = a0 cn = an + ibn<br />
2<br />
then the <strong>Fourier</strong> series for f(x) can be written compactly as:<br />
Now, the formula for cn is given by:<br />
f(x) ∼<br />
∞<br />
n=−∞<br />
cn = 1<br />
2 (an + ibn) = 1<br />
L<br />
1<br />
f(x) cos<br />
2 L −L<br />
Simplifying, we get:<br />
cn = 1<br />
L <br />
f(x) cos<br />
2L −L<br />
<br />
nπx<br />
<br />
+ i sin<br />
L<br />
cne −inπx/L<br />
<br />
nπx<br />
<br />
dx +<br />
L<br />
i<br />
L<br />
f(x) sin<br />
L −L<br />
<br />
nπx<br />
<br />
dx<br />
L<br />
<br />
nπx<br />
<br />
dx =<br />
L<br />
1<br />
L<br />
f(x)e<br />
2L −L<br />
inπx/L dx<br />
IMPORTANT NOTE: The <strong>Fourier</strong> series has a negative exponential in the formula, the<br />
coefficients are using a positive exponential.<br />
Note: c−n = cn (this is an exercise)<br />
2
Discretization<br />
To go from the continuous series to the discrete series, we will need to discretize our function.<br />
That is, we will (by necessity) go from an infinite dimensional vector space to a finite dimensional<br />
approximation (if you use n points in the discretization, you will be working in R n ).<br />
Before discussing the implications to the <strong>Fourier</strong> analysis, let us discuss the discretization<br />
process, first by means of some Matlab exercises:<br />
Exercises:<br />
1. Consider the functions y1 = cos π<br />
4 t , y2 = cos 7π<br />
4 t with 0 ≤ t ≤ 64. Will 64 samples<br />
be enough to differentiate between these functions? Try the following Matlab script,<br />
<strong>and</strong> write up your observations:<br />
k=0:63; t=0:0.1:63;<br />
y1=cos((pi/4)*k); y2=cos((7*pi/4)*k);<br />
Y1=cos((pi/4)*t); Y2=cos((7*pi/4)*t);<br />
plot(t,Y1,’b-’,t,Y2,’r-’);<br />
hold on<br />
plot(k,y1,’bo’,k,y2,’r*’);<br />
hold off<br />
%Take a closer look at the first 10 values:<br />
axis([0 10 -1 1]);<br />
2. Do the same exercise 2 , if y1 = sin 7π<br />
8<br />
<br />
, y2 = − sin <br />
9π . 8<br />
7π<br />
9π<br />
π<br />
7π<br />
i i i i 3. Geometrically, what is the relationship between e 8 <strong>and</strong> e 8 ? Between e 4 <strong>and</strong> e 4 ?<br />
4. Using the previous exercise, come up with other pairs of sines <strong>and</strong> cosines that will<br />
discretize to the same function (under the given discretization).<br />
5. Give a conjecture <strong>about</strong> what we should allow as the smallest admissable period if the<br />
distance between two points is ∆x. For example, is it adviseable to have a period that<br />
∆x? Why or why not? Draw a picture to justify your conclusions.<br />
is 1<br />
2<br />
The <strong>Discrete</strong> Form of the FFT<br />
In this section, we’re going to change the interval for f(x) slightly- That is, we’ll assume that<br />
we’re analyzing f on the interval [0, L]. This will keep the notation aligned with how Matlab<br />
computes the coefficients. We assume that the function f has been sampled uniformly, so<br />
the values of x would be (if we have M samples):<br />
x0 = 0, x1 = 1<br />
M , x2 = 2<br />
, · · ·<br />
M<br />
2 Try the Sampling Rate script file at the Appendix for more!<br />
3
<strong>and</strong> therefore, we define fk = f(xk).<br />
Then, the input to the FFT algorithm is the length M vector containing f, <strong>and</strong> the<br />
output is a length M vector whose kth element is given by:<br />
M<br />
Yk = fjω (j−1)(k−1) with ω = e −(2π/M)i<br />
j=1<br />
In matrix notation, if we define the <strong>Fourier</strong> matrix by F , where the (k, j) element (with<br />
k = 1 to M, <strong>and</strong> j going from 1 to M) is given by:<br />
Fk,j = ω (k−1)(j−1) <br />
= exp − 2πi<br />
<br />
· (k − 1)(j − 1)<br />
N<br />
then F is a square, invertible matrix, <strong>and</strong> the output to the FFT is:<br />
Matlab Code<br />
Y = F f<br />
To clarify, in Matlab, we could compute the FFT of the vector f directly as:<br />
Y=exp( (-2*pi*i/N)*(0:(N-1))’*(0:(N-1)) )*f;<br />
And the inverse transform (f=ifft(F)) is computed in a similar manner:<br />
fn = 1<br />
N<br />
Yke<br />
N<br />
2πi<br />
N ·(k−1)(n−1) , 1 ≤ n ≤ N<br />
or<br />
k=1<br />
f=(1/N)*exp( (2*pi*i/N)*(0:(N-1))’*(0:(N-1)) )*Y;<br />
Important Note from Cleve Moler, founder of Matlab: We should point out that<br />
this is not the only notation for the finite <strong>Fourier</strong> transform in common use. The minus<br />
sign in the definition of ω sometimes occurs instead in the definition of ω used in the inverse<br />
transform. The 1/N scaling factor in the inverse transform is sometimes replaced with 1/ √ N<br />
scaling factors in both transforms.<br />
Interpreting the Matlab Results<br />
As we stated earlier, let’s assume that f is defined on the interval [0, L]. If we cut the interval<br />
into N equal subintervals, then let’s use the usual definition for ∆x,<br />
∆x = L<br />
, or L = N · ∆x<br />
N<br />
Recall that our <strong>Fourier</strong> series is given as:<br />
∞<br />
<br />
2πk<br />
f (x) = a0 + ak cos<br />
L x<br />
∞<br />
<br />
2πk<br />
+ bk sin<br />
L x<br />
<br />
k=1<br />
Now, inserting L = N · ∆x, we get the final discretized form summarized below.<br />
4<br />
k=1
Summary<br />
If we have N points with spacing ∆x, <strong>and</strong> these points are labeled<br />
with x ∈ [0, L], then the Matlab coefficients:<br />
F=fft(f)<br />
correspond to:<br />
via the relations:<br />
<br />
N/2<br />
fn = a0 +<br />
k=1<br />
{f0, f1, . . . , fN−1}<br />
<br />
2πk<br />
ak cos<br />
N ∆x xn<br />
<br />
2πk<br />
+ bk sin<br />
N ∆x xn<br />
<br />
a0 = 1<br />
N F1<br />
ak = 2<br />
· Real (Fk+1)<br />
N<br />
bk = − 2<br />
· Imag (Fk+1)<br />
N<br />
Note the periods of the functions in Equation 2, as k = 1, 2, . . . , N<br />
per Cycle):<br />
2π<br />
2πk<br />
N ∆x<br />
= 2π<br />
1<br />
· N∆x<br />
2πk<br />
= N<br />
k ∆x<br />
Listed out, the periods of the functions we’re using are:<br />
N · ∆x, N<br />
2<br />
· ∆x, N<br />
3<br />
or as frequencies, we would take the reciprocals of those quantities.<br />
EXAMPLE: Counting the periods<br />
2<br />
(2)<br />
are (measured in Time<br />
N<br />
· ∆x, . . . , · ∆x = 2∆x (3)<br />
N/2<br />
Suppose we have N = 16 samples, each at ∆x = 1 time unit (so that the function f is defined<br />
on the interval [0, 16]). What are the possible periods that the discrete <strong>Fourier</strong> Transform<br />
will pick up?<br />
SOLUTION:<br />
There are 8 possible periods: 16, 8, 5 1<br />
3<br />
NOTES:<br />
, 4, 3.2, 2 2<br />
3<br />
3 , 2 , 2. 7<br />
• The shortest period is 2, twice the sampling distance ∆x. The longest period is 16<br />
time units long- as long as the entire interval.<br />
• While there are 8 periods, there are 16 sample points- The vector of FFT values (for<br />
real functions) that is output by Matlab is symmetric.<br />
5
The Frequency Content of a Function<br />
We define the frequency content by the following, where Y is the vector output from the<br />
FFT comm<strong>and</strong>:<br />
<br />
freq(k) = a2 k + b2 2<br />
k =<br />
N |Yk+1|, k = 1, 2, . . . , N<br />
2<br />
from which we get the Power Spectrum, which is a plot of the magnitudes of the complex<br />
<strong>Fourier</strong> coefficients. This plot reveals the frequency content of the signal, <strong>and</strong> we will explore<br />
this in the next section.<br />
Examples: Applying the FFT<br />
In this section, we will apply the FFT to various signals <strong>and</strong> look at ways of manipulating<br />
the output.<br />
Analyzing a Known Signal<br />
Let y = sin( π<br />
8 xk) + 2 cos( 7π<br />
8 xk), with xk coming from 64 evenly spaced points in [0, 64].<br />
Before going into Matlab, let’s check the periods involved in this function:<br />
First, the sine function will have period 2π/(π/8) = 16 <strong>and</strong> the cosine function will have<br />
period 2π/(7π/8) = 16/7.<br />
Using our previous formula, we said that the periods were N∆x/k, or:<br />
N∆x<br />
k<br />
= 16 ⇒ 64<br />
k<br />
= 16 ⇒ k = 4<br />
And<br />
N∆x 16 64 16<br />
= ⇒ = ⇒ k = 28<br />
k 7 k 7<br />
Therefore, in the spectrum, we expect spikes at frequencies 5 <strong>and</strong> 29 (add one because of<br />
the constant term a0).<br />
1. Set up the domain <strong>and</strong> range information:<br />
k=0:63;<br />
y=sin((pi/8)*k)+2*cos((7*pi/8)*k);<br />
2. Take the <strong>Fourier</strong> Transform:<br />
Y=fft(y);<br />
3. Look at the Spectrum:<br />
plot(abs(Y),’k-*’);<br />
4. We should see 4 spikes in the spectrum, <strong>and</strong> the spectrum is symmetric. The symmetry<br />
is due to the fact that the function is real. The spikes of interest are at positions 5 <strong>and</strong><br />
29, as we predicted!<br />
6
Sunspot Analysis<br />
This example has a built-in script. You can type: sunspots in the comm<strong>and</strong> window to see<br />
the slideshow. We’ll do the same example here:<br />
The problem: We’re given data corresponding to the number of sunspots counted on<br />
the sun every year between 1700 <strong>and</strong> 1987. We’d like to analyze it to see if there is some<br />
periodicity in the number of sunspots. We assume the domain to be 0 to 288 (years), <strong>and</strong><br />
the data below corresponds to one sample per year (therefore, L = N = 288, <strong>and</strong> ∆x = 1).<br />
load sunspot.dat<br />
year=sunspot(:,1); sun=sunspot(:,2);<br />
Y=fft(sun);<br />
Y(1)=[]; %Remove the mean<br />
plot(abs(Y(1:143))); %We’ll only plot the relevant half.<br />
[a,b]=max(abs(Y(1:143)));<br />
We see that the 26th position gave the max- how do we translate that into years? From<br />
the formulas for the “Time per Cycle”, (Equation 3) we get:<br />
N · ∆x<br />
k<br />
= 288 · 1<br />
26<br />
≈ 11.0769 years<br />
from which comes the adage that we get a maximum number of sunspots approximately<br />
every 11 years.<br />
7