Open Document File - Utah Government Publications Online
Open Document File - Utah Government Publications Online
Open Document File - Utah Government Publications Online

Create successful ePaper yourself
Turn your PDF publications into a flip-book with our unique Google optimized e-Paper software.
2007 UTAH’S HEALTH: AN ANNUAL REVIEW<br />
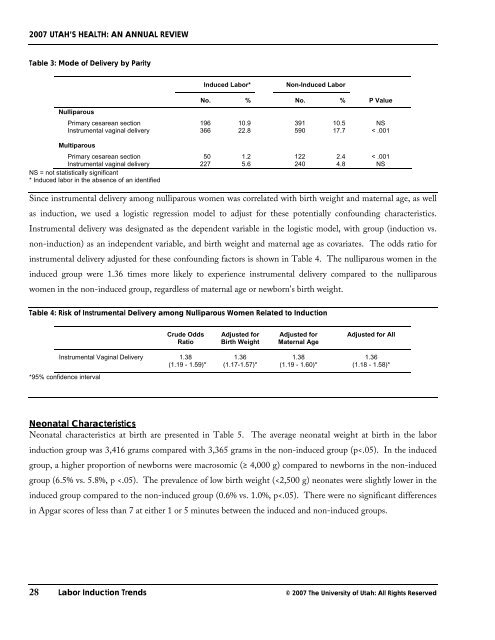
Table 3: Mode of Delivery by Parity<br />
Nulliparous<br />
Induced Labor* Non-Induced Labor<br />
No. % No. % P Value<br />
Primary cesarean section 196 10.9 391 10.5 NS<br />
Instrumental vaginal delivery 366 22.8 590 17.7 < .001<br />
Multiparous<br />
Primary cesarean section 50 1.2 122 2.4 < .001<br />
Instrumental vaginal delivery<br />
NS = not statistically significant<br />
* Induced labor in the absence of an identified<br />
227 5.6 240 4.8 NS<br />
Since instrumental delivery among nulliparous women was correlated with birth weight and maternal age, as well<br />
as induction, we used a logistic regression model to adjust for these potentially confounding characteristics.<br />
Instrumental delivery was designated as the dependent variable in the logistic model, with group (induction vs.<br />
non-induction) as an independent variable, and birth weight and maternal age as covariates. The odds ratio for<br />
instrumental delivery adjusted for these confounding factors is shown in Table 4. The nulliparous women in the<br />
induced group were 1.36 times more likely to experience instrumental delivery compared to the nulliparous<br />
women in the non-induced group, regardless of maternal age or newborn's birth weight.<br />
Table 4: Risk of Instrumental Delivery among Nulliparous Women Related to Induction<br />
Crude Odds<br />
Ratio<br />
Instrumental Vaginal Delivery 1.38<br />
(1.19 - 1.59)*<br />
*95% confidence interval<br />
Adjusted for<br />
Birth Weight<br />
1.36<br />
(1.17-1.57)*<br />
Adjusted for<br />
Maternal Age<br />
1.38<br />
(1.19 - 1.60)*<br />
Adjusted for All<br />
1.36<br />
(1.18 - 1.58)*<br />
Neonatal Characteristics<br />
Neonatal characteristics at birth are presented in Table 5. The average neonatal weight at birth in the labor<br />
induction group was 3,416 grams compared with 3,365 grams in the non-induced group (p