Open Document File - Utah Government Publications Online
Open Document File - Utah Government Publications Online
Open Document File - Utah Government Publications Online

Create successful ePaper yourself
Turn your PDF publications into a flip-book with our unique Google optimized e-Paper software.
2007 UTAH’S HEALTH: AN ANNUAL REVIEW<br />
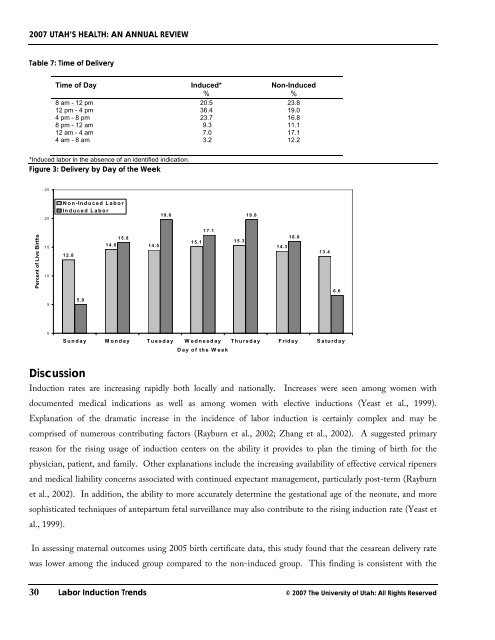
Table 7: Time of Delivery<br />
Time of Day Induced* Non-Induced<br />
% %<br />
8 am - 12 pm 20.5 23.8<br />
12 pm - 4 pm 36.4 19.0<br />
4 pm - 8 pm 23.7 16.8<br />
8 pm - 12 am 9.3 11.1<br />
12 am - 4 am 7.0 17.1<br />
4 am - 8 am 3.2 12.2<br />
*Induced labor in the absence of an identified indication.<br />
Figure 3: Delivery by Day of the Week<br />
Percent of Live Births<br />
25<br />
20<br />
15<br />
10<br />
5<br />
0<br />
12.8<br />
5.0<br />
Discussion<br />
Non-Induced Labor<br />
Induced Labor<br />
15.8<br />
14.6 14.5<br />
19.8<br />
15.1<br />
17.1<br />
Sunday Monday Tuesday Wednesday<br />
Day of the Week<br />
Thursday Friday Saturday<br />
Induction rates are increasing rapidly both locally and nationally. Increases were seen among women with<br />
documented medical indications as well as among women with elective inductions (Yeast et al., 1999).<br />
Explanation of the dramatic increase in the incidence of labor induction is certainly complex and may be<br />
comprised of numerous contributing factors (Rayburn et al., 2002; Zhang et al., 2002). A suggested primary<br />
reason for the rising usage of induction centers on the ability it provides to plan the timing of birth for the<br />
physician, patient, and family. Other explanations include the increasing availability of effective cervical ripeners<br />
and medical liability concerns associated with continued expectant management, particularly post-term (Rayburn<br />
et al., 2002). In addition, the ability to more accurately determine the gestational age of the neonate, and more<br />
sophisticated techniques of antepartum fetal surveillance may also contribute to the rising induction rate (Yeast et<br />
al., 1999).<br />
In assessing maternal outcomes using 2005 birth certificate data, this study found that the cesarean delivery rate<br />
was lower among the induced group compared to the non-induced group. This finding is consistent with the<br />
30 Labor Induction Trends © 2007 The University of <strong>Utah</strong>: All Rights Reserved<br />
15.3<br />
19.8<br />
14.3<br />
16.0<br />
13.4<br />
6.6