North Spit Wastewater Treatment Plant - Port of Coos Bay, Oregon
North Spit Wastewater Treatment Plant - Port of Coos Bay, Oregon
North Spit Wastewater Treatment Plant - Port of Coos Bay, Oregon

Create successful ePaper yourself
Turn your PDF publications into a flip-book with our unique Google optimized e-Paper software.
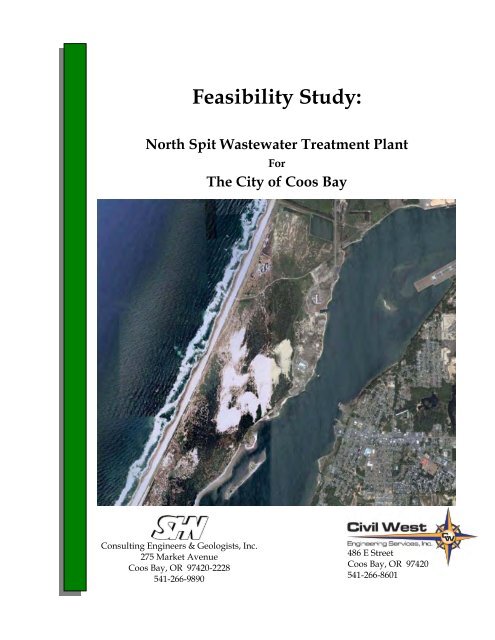
Feasibility Study:<br />
<strong>North</strong> <strong>Spit</strong> <strong>Wastewater</strong> <strong>Treatment</strong> <strong>Plant</strong><br />
Consulting Engineers & Geologists, Inc.<br />
275 Market Avenue<br />
<strong>Coos</strong> <strong>Bay</strong>, OR 97420-2228<br />
541-266-9890<br />
For<br />
The City <strong>of</strong> <strong>Coos</strong> <strong>Bay</strong><br />
486 E Street<br />
<strong>Coos</strong> <strong>Bay</strong>, OR 97420<br />
541-266-8601
Table <strong>of</strong> Contents<br />
1.0 Introduction .......................................................................................................................................... 1<br />
1.1 Project Description .................................................................................................................. 1<br />
1.1.1 Overview ..................................................................................................................... 1<br />
1.1.2 Purpose ........................................................................................................................ 1<br />
1.2 Project Study Area (<strong>North</strong> <strong>Spit</strong> Site) ..................................................................................... 2<br />
1.2.1 Site Topography ......................................................................................................... 2<br />
1.2.2 Geologic Setting ......................................................................................................... 6<br />
1.2.3 Historical Background .............................................................................................. 6<br />
1.3 Existing Characteristics .......................................................................................................... 8<br />
1.3.1 Sludge .......................................................................................................................... 8<br />
1.3.2 <strong>Wastewater</strong> Lagoon ................................................................................................... 8<br />
1.3.3 Stabilization Basin ...................................................................................................... 9<br />
1.3.4 Environmental Issues .............................................................................................. 10<br />
1.3.5 Wetland Considerations ......................................................................................... 15<br />
2.0 Design Criteria.................................................................................................................................... 16<br />
2.1 Regulatory Constraints ........................................................................................................ 16<br />
2.1.1 NPDES Permit .......................................................................................................... 16<br />
2.2 Flows and Loadings .............................................................................................................. 17<br />
3.0 Preliminary <strong>Treatment</strong> Alternatives ............................................................................................... 19<br />
3.1 Headworks ............................................................................................................................. 19<br />
3.1.1 Description ................................................................................................................ 19<br />
3.1.2 Site Evaluation .......................................................................................................... 19<br />
3.1.3 Preferred Location ................................................................................................... 19<br />
3.1.4 Cost ............................................................................................................................ 19<br />
3.2 Primary <strong>Treatment</strong> ................................................................................................................ 20<br />
3.2.1 Performance .............................................................................................................. 20<br />
3.2.2 Evaluation ................................................................................................................. 20<br />
4.0 Pumping Requirements .................................................................................................................... 20<br />
4.1 Force Main ................................................................................................................ 21<br />
4.2 Pump Station ............................................................................................................ 24<br />
5.0 <strong>Treatment</strong> Alternatives ..................................................................................................................... 27<br />
5.1 Facultative Lagoon System .................................................................................................. 27<br />
5.1.1 Alternate 1 - Facultative System ............................................................................ 27<br />
5.1.2 Alternative 2 - Facultative System with Primary <strong>Treatment</strong> ............................. 30<br />
5.1.3 Alternative 3 - Facultative System with Supplemental Aeration ...................... 32<br />
5.1.4 Alternative 4 - Aerated Partial Mix / Facultative System , Existing<br />
Basin ........................................................................................................................... 34<br />
5.1.5 Alternative 5 - Aerated Partial Mix / Facultative System , Primary<br />
Cells ............................................................................................................................ 36<br />
5.1.6 Preferred Alternative ............................................................................................... 38<br />
5.1.7 Biosolids Management ............................................................................................ 41<br />
5.1.8 Expected Performance (Nitrogen Removal) ........................................................ 42<br />
i<br />
Page
5.2 Enhanced <strong>Treatment</strong> Wetlands ........................................................................................... 43<br />
6.0 Disinfection Alternatives ......................................................................................................................... 44<br />
6.1 Method Alternatives ....................................................................................................... 44<br />
6.1.1 Ultraviolet ..................................................................................................................... 44<br />
6.1.2 Sodium Hypochlorite .................................................................................................. 44<br />
7.0 Evaluation <strong>of</strong> Existing Outfall .......................................................................................................... 45<br />
7.1.1 Description ................................................................................................................ 45<br />
7.1.1 Outfall Capacity Analysis ....................................................................................... 45<br />
7.1.2 Diffusers .................................................................................................................... 46<br />
7.1.3 Effluent Pump Station Upgrade ............................................................................ 46<br />
8.0 Project Summary ................................................................................................................................ 48<br />
8.1 Layout Summary................................................................................................................... 48<br />
8.2 Costs ........................................................................................................................................ 49<br />
9.0 References ........................................................................................................................................... 50<br />
Appendices<br />
A. Additional Mapping<br />
B. Solids Data<br />
C. Groundwater Data<br />
ii
List <strong>of</strong> Illustrations<br />
Figures Page<br />
Figure 1.1 Location Map ............................................................................................................................ 3<br />
Figure 1.2 Property <strong>of</strong> Interest ................................................................................................................... 4<br />
Figure 1.3 FEMA Map ................................................................................................................................ 5<br />
Figure 1.4 Groundwater Wells ................................................................................................................ 11<br />
Figure 1.5 Wetland Mapping ................................................................................................................... 13<br />
Figure 4.1.1 Force Main Alignment ........................................................................................................... 22<br />
Figure 5.1 Primary <strong>Treatment</strong> Alternative 1 ......................................................................................... 29<br />
Figure 5.2 Primary <strong>Treatment</strong> Alternative 2 ......................................................................................... 31<br />
Figure 5.3 Primary <strong>Treatment</strong> Alternative 3 ......................................................................................... 33<br />
Figure 5.4 Primary <strong>Treatment</strong> Alternative 4 ......................................................................................... 35<br />
Figure 5.5 Primary <strong>Treatment</strong> Alternative 5 ......................................................................................... 37<br />
Tables Page<br />
Table 1.1 Site History .................................................................................................................................. 7<br />
Table 1.2 Sludge Sampling <strong>of</strong> Stabilization Basin .................................................................................. 9<br />
Table 1.3 Groundwater Quality Concentrations .................................................................................. 12<br />
Table 1.4 Summary <strong>of</strong> Wetlands/Lagoon Field Surveys 1 ................................................................... 14<br />
Table 3.1.4, Headworks Cost Estimate ....................................................................................................... 20<br />
Table 4.1, Forcemain Cost Estimate (Single Force Main) ..................................................................... 23<br />
Table 4.2, Forcemain Cost Estimate (Double Force Main) ................................................................... 24<br />
Table 4.2.1, Pump Station Cost Estimate (Single Force Main) ................................................................ 26<br />
Table 4.2.2, Pump Station Cost Estimate (Double Force Main) .............................................................. 26<br />
Table 5.2 Alternative 2 .............................................................................................................................. 30<br />
Table 5.3 Alternative 3 .............................................................................................................................. 32<br />
Table 5.4 Alternative 4 .............................................................................................................................. 36<br />
Table 5.5 Alternative 5 .............................................................................................................................. 38<br />
Table 5.6, <strong>Treatment</strong> Alternative 1 Cost Estimate ................................................................................. 39<br />
Table 5.7, <strong>Treatment</strong> Alternative 4 Cost Estimate ................................................................................. 39<br />
Table 5.8, <strong>Treatment</strong> Alternative 5 Cost Estimate ................................................................................. 40<br />
Table 5.9 Evaluation Matrix for Selection <strong>of</strong> Preferred Alternative ................................................... 41<br />
Table 6.1.2, Disinfection Cost Estimate ...................................................................................................... 44<br />
Table 8.2, Cost Estimate Summary & Total ............................................................................................ 49<br />
iii
1.0 Introduction<br />
1.1 Project Description<br />
1.1.1 Overview<br />
The City <strong>of</strong> <strong>Coos</strong> <strong>Bay</strong> owns and operates two separate wastewater treatment facilities with each<br />
plant serving a portion <strong>of</strong> the community. Both treatment facilities are in need <strong>of</strong> upgrades and<br />
improvements to address age/condition-related deficiencies as well as water quality and capacity<br />
related deficiencies.<br />
Presently, <strong>Wastewater</strong> <strong>Treatment</strong> <strong>Plant</strong> #2, on Cape Arago Highway, provides service to<br />
approximately 1/3 <strong>of</strong> the residents <strong>of</strong> <strong>Coos</strong> <strong>Bay</strong> plus service to the community <strong>of</strong> Charleston. The<br />
current peak flows are in the range <strong>of</strong> 5 million gallons per day (MGD) and it is expected that<br />
within the 20 year planning cycle, the peak flows will be in excess <strong>of</strong> 8.5 MGD.<br />
The City has entered into a Mutual Agreement and Order (MAO) with the <strong>Oregon</strong> Department <strong>of</strong><br />
Environmental Quality (DEQ) that includes milestones and tasks that the City must complete in<br />
order to remain in compliance.<br />
The City is currently in the process <strong>of</strong> completing a pre-design report for improvements to the<br />
facilities located at <strong>Plant</strong> #2. Civil West Engineering Services, along with Century West<br />
Engineering and Esvelt Environmental Engineering, are currently progressing towards the<br />
completion <strong>of</strong> that report.<br />
1.1.2 Purpose<br />
During the pre-design process it was discovered that the treatment recommendations presented in<br />
the Facilities Plan were not adequate to comply with the ammonia limits <strong>of</strong> the discharge permit.<br />
As a result, additional real estate must be acquired or more expensive treatment methods must be<br />
used.<br />
The City has expressed an interest in an evaluation the feasibility <strong>of</strong> treating the sewage on the<br />
north spit, where an existing lagoon and an existing ocean outfall are located. The lagoon was<br />
originally constructed in 1960 and served the Weyerhauser paper mill and was reconfigured in<br />
1990. The site was recently reviewed as a possible dredge disposal location for the spoils for the<br />
marine terminal proposed Jordan Cove Energy (LNG) project.<br />
The advantages <strong>of</strong> using the site include available property for current and future flows (including<br />
the possibility <strong>of</strong> accepting sewage which currently is treated by <strong>Plant</strong> #1), the potential to utilize<br />
the processes that have low operational requirements and the ocean outfall which permits a lower<br />
level <strong>of</strong> treatment prior to discharge as compared with discharge limitations in bay or estuary<br />
waters.<br />
Challenges associated with the project include transmission <strong>of</strong> the sewage to the north spit site (2+<br />
miles from WWTP #2 and across the bay), modification <strong>of</strong> the existing lagoon to meet current<br />
requirements, verification that the existing ocean outfall will meet the requirements and land use<br />
1
hurdles associated with the City <strong>of</strong> <strong>Coos</strong> <strong>Bay</strong> operating a treatment plant which is outside <strong>of</strong> their<br />
Urban Growth Boundary.<br />
1.2 Project Study Area (<strong>North</strong> <strong>Spit</strong> Site)<br />
The project study area includes the City <strong>of</strong> <strong>Coos</strong> <strong>Bay</strong>’s wastewater treatment facility (<strong>Plant</strong> 2), a<br />
small section <strong>of</strong> the Empire Area <strong>of</strong> <strong>Coos</strong> <strong>Bay</strong> along Cape Arago Highway, the bay <strong>of</strong> <strong>Coos</strong> <strong>Bay</strong><br />
from the Hollering Place to the <strong>North</strong> <strong>Spit</strong> anadromous facility, and on the <strong>North</strong> <strong>Spit</strong>, along the<br />
Trans Pacific Parkway to the Weyerhaeuser industrial waste treatment facility.<br />
The location <strong>of</strong> the proposed wastewater treatment system is on Weyerhaeuser property on the<br />
<strong>North</strong> <strong>Spit</strong> <strong>of</strong> <strong>Coos</strong> <strong>Bay</strong> as shown in the Location Map, Figure 1.1. The area <strong>of</strong> interest is identified<br />
as “Industrial Waste Pond.” Weyerhaeuser’s use <strong>of</strong> the industrial waste pond shown in Figure 1.1<br />
ceased in 1972 when the treatment system was reconfigured to include a 31 acre aerated<br />
stabilization basin (ASB), shown in Figure 1.2. The area outside the 31 acre lagoon (approximately<br />
240 acres) is now a seasonally flooded wetland.<br />
1.2.1 Site Topography<br />
The topography <strong>of</strong> the study area is dominated by <strong>Coos</strong> <strong>Bay</strong> and the Pacific Ocean. The southern<br />
half <strong>of</strong> the project is located along the bay front in the Empire District. This area includes sand flats<br />
at the <strong>Plant</strong> 2 site and an upland terrace along Cape Arago Highway. On the north spit, the<br />
topography is more characteristic <strong>of</strong> an active dune with migrating and shifting sands forming<br />
temporary and semi-permanent sand dunes extending up as high as 100 feet. Along the Trans<br />
Pacific Parkway, the land is generally flat, where the roadway parallels the bay front. The area at<br />
the wastewater treatment plant site is more characteristic <strong>of</strong> a deflation plain subject to high ground<br />
water levels.<br />
Flood Plain<br />
The FEMA map indicating current 100 year flood elevations is presented in Figure 1.3. The<br />
proposed boundary <strong>of</strong> the V Zone: Coastal Flood Zone with Velocity Hazard (wave action), is also<br />
shown on the Figure. According to Jonathan Allen, Ph. D, Coastal Geomorphologist with the<br />
<strong>Oregon</strong> Department <strong>of</strong> Geology and Mineral Industries (DOGNAMI), the V-Zone shown in the<br />
figure is un<strong>of</strong>ficial (it has not gone through a quality assurance process) but it generally shows the<br />
boundary <strong>of</strong> the new V-Zone designation.<br />
An aerial map showing this boundary along with cross-section data provided by DOGNAMI is<br />
included in Appendix A “The data indicates that at the south end <strong>of</strong> the proposed treatment area,<br />
the beach has undergone significant erosion since 1998, with the shore having cut back ~25 m (80 ft)<br />
during the last decade. In contrast, the pr<strong>of</strong>iles to the north (mid-way along the pond area) have<br />
experienced much less erosion (~6 m (20 ft)), while the beach at the north end <strong>of</strong> the ponds have<br />
experienced no erosion.<br />
2
\\<strong>Coos</strong>bay\projects\2009\609031-CBGeoGenSvc\115-N-<strong>Spit</strong>-WW-Trtmtnt-Site\Figs , SAVED: 5/12/2010 4:56 PM SFRAZZINI , PLOTTED: 5/12/2010 4:59 PM , SHAWN FRAZZINI<br />
Consulting Engineers<br />
& Geologists, Inc.<br />
City <strong>of</strong> <strong>Coos</strong> <strong>Bay</strong><br />
<strong>North</strong> <strong>Spit</strong> WWTP<br />
WWTP<br />
SITE<br />
May 2010 609031-115-FIG-1-x-Location<br />
Location Map<br />
SHN 609031.115<br />
Figure 1.1
\\<strong>Coos</strong>bay\projects\2009\609031-CBGeoGenSvc\115-N-<strong>Spit</strong>-WW-Trtmtnt-Site\Figs , SAVED: 5/11/2010 10:27 AM SFRAZZINI , PLOTTED: 5/12/2010 4:47 PM , SHAWN FRAZZINI<br />
Consulting Engineers<br />
& Geologists, Inc.<br />
City <strong>of</strong> <strong>Coos</strong> <strong>Bay</strong><br />
<strong>North</strong> <strong>Spit</strong> WWTP<br />
May 2010 609031-115-FIG-1-x-Location<br />
Property <strong>of</strong> Interest<br />
SHN 609031.115<br />
Figure 1.2<br />
N
\\<strong>Coos</strong>bay\projects\2009\609031-CBGeoGenSvc\115-N-<strong>Spit</strong>-WW-Trtmtnt-Site\Figs , SAVED: 5/11/2010 11:48 AM SFRAZZINI , PLOTTED: 5/12/2010 5:06 PM , SHAWN FRAZZINI<br />
Consulting Engineers<br />
& Geologists, Inc.<br />
City <strong>of</strong> <strong>Coos</strong> <strong>Bay</strong><br />
Feasibility Study <strong>North</strong> <strong>Spit</strong><br />
<strong>Coos</strong> <strong>Bay</strong>, <strong>Oregon</strong><br />
May 2010 609031-115-FIG-1-3-FEMA<br />
FEMA Map<br />
SHN 609031<br />
Figure 1.3
1.2.2 Geologic Setting<br />
The <strong>North</strong> <strong>Spit</strong> is located on the western edge <strong>of</strong> the <strong>Coos</strong> <strong>Bay</strong> Basin, a structurally downfolded and<br />
faulted basin with numerous minor anticlines (upfolded strata) and synclines (downfolded strata)<br />
(Beaulieu and Hughes, 1975). This basin was the site <strong>of</strong> repeated geologic deposits throughout the<br />
Tertiary period. The spit lies on the north projection <strong>of</strong> a north-south trending syncline that passes<br />
beneath South Slough. Bedrock below the sand dune deposits on the <strong>North</strong> <strong>Spit</strong> is Eocene age<br />
Coaledo formation. The Coaledo formation is a marine, sandstone unit with minor beds <strong>of</strong> siltstone<br />
(USACOE, 1981).<br />
Geology within the project area is primarily Holocene –age fine to medium grained dune sands,<br />
averaging 100 feet or greater in depth. The chemical composition <strong>of</strong> the sands has been reported to<br />
have the presence <strong>of</strong> arsenic, chromium, iron, and manganese (HAR, 2000).<br />
Hydrogeology<br />
The eolian and upper marine sands are a prolific source <strong>of</strong> groundwater on the north spit. The area<br />
north <strong>of</strong> the existing basin have been designated a sensitive aquifer (Sweet-Edwards/EMCON,<br />
1990). Precipitation, averaging over 65 inches per year, recharges the aquifer. Natural discharge<br />
from the aquifer is by underflow to <strong>Coos</strong> <strong>Bay</strong> and the Pacific Ocean and by evapotranspiration.<br />
Groundwater levels vary in direct response to incident precipitation variations and are locally<br />
influenced by tidal effects. During the winter months, groundwater levels can be at or above the<br />
ground surface.<br />
The lagoon is underlain by 80 to 150 feet <strong>of</strong> Quaternary dune and marine sands that overlie older<br />
bedrock deposits (Robison, 1973). The bedrock (Tertiary marine siltstones, mudstones, and<br />
sandstones) has relatively low permeability and forms the base <strong>of</strong> the overlying freshwater aquifer.<br />
The bedrock crops out east <strong>of</strong> the <strong>North</strong> <strong>Spit</strong> and slopes westward toward the ocean. The base <strong>of</strong><br />
the aquifer is about 160 feet below sea level at the project site (CH2MHill, 1984).<br />
The Quaternary dune and marine sands forming the aquifer are relatively clean and uniform,<br />
except for minor layers <strong>of</strong> silt, clay, and organic matter. Horizontal permeability is generally<br />
greater than vertical permeability. Aquifer transmissivity ranges from less than 1 X 10 -2 to 4 X 10 -2<br />
square feet per second (ft 2/sec) (Jones, 1992) and generally increase to the west as the aquifer<br />
thickens because <strong>of</strong> its sloping base. Near the lagoon, transmissivity is estimated at 4 X 10 -2 ft/sec<br />
(Jones 1992). Aquifer recharge occurs by direct infiltration <strong>of</strong> precipitation.<br />
The groundwater gradient has always been from the north wetland into the lagoon, even when the<br />
industrial discharge into the lagoons was active (CH2MHill, 1996b). Subsequently the intertidal<br />
area receives discharges from the lagoon, and to a much lesser extent (under 5%) the southern<br />
wetland receives discharges from the lagoon (Sweet-Edwards/Emcon, 1990). The aquifer is<br />
considered to be unconfined, and depth to water ranges from 5 to 50 feet MSL (HAR, 2000).<br />
1.2.3 Historical Background<br />
The industrial history <strong>of</strong> the site began in 1961 when the pulp mill was constructed by Menasha<br />
Wooden Ware Corporation (Menasha) as a neutral-sulfite, semi chemical process (NSSC) pulp mill<br />
(Tuppan 1995). As part <strong>of</strong> the pulp mill construction activities, a 270 acre wastewater oxidation<br />
6
lagoon, located 2 miles west <strong>of</strong> the pulp mill, was also constructed in 1960 by Menasha. Secondary<br />
treatment was accomplished by pumping from settling basins (located at the pulp mill) to the<br />
lagoon for aeration, evaporation, and infiltration (Tuppan 1995). Disposal <strong>of</strong> the treated effluent<br />
occurred via evaporation and infiltration until 1972, when a 4,800 foot long ocean outfall was<br />
constructed. The outfall was constructed to address a reduction in the infiltration capacity <strong>of</strong> the<br />
lagoon due to solids accumulation.<br />
In 1990 the 30 acre aeration stabilization basin (ASB) was constructed in the northeast corner <strong>of</strong> the<br />
270 acre lagoon to provide aeration prior to ocean discharge. In 1995 the pulp mill was shut down<br />
and converted to a recycling facility. This resulted in a reduction in effluent flows from 3.5 MGD to<br />
2.5 MGD and a cessation <strong>of</strong> any contaminants <strong>of</strong> concern associated with the former pulp mill<br />
process.<br />
In 2003 the company ceased operation <strong>of</strong> the container board facility and permanently closed the<br />
mill. Currently the only wastewater treated is landfill leachate which is pumped to settling basins<br />
and then to the stabilization basin before being discharged through the outfall. Some storm water<br />
enters the system, and Weyerhaeuser purchases water from nearby reservoirs at a rate <strong>of</strong> 300,000 to<br />
500,000 gpd to maintain flow though the system to keep the diffusers from plugging and being<br />
inundated with sand (2004, NPDES Permit Evaluation Report). A summary <strong>of</strong> the history <strong>of</strong> the<br />
site is presented in Table 1.1.<br />
Table 1.1<br />
Site History<br />
1960 270 acre wastewater treatment lagoon constructed<br />
1961 Menasha operates NSSC pulp mill<br />
1972 4,800 ft ocean outfall constructed, cease disposal via infiltration<br />
1981 Weyerhaeuser purchases facility from Menasha<br />
1990 Aerated Stabilization Basin (ASB) constructed in northeast corner <strong>of</strong> 270 acre lagoon<br />
1995 Mill converted to 100 % recycle containerboard facility<br />
1996 Discharge to lagoon ceased, wastewater effluent from ASB to ocean outfall<br />
2003 Containerboard Facility shut down<br />
Current Only wastewater discharge, leachate from cell # 3 (construction debris landfill)<br />
Contaminants <strong>of</strong> Concern<br />
Contaminants <strong>of</strong> potential ecological concern (COPECs) were associated with the wastewater<br />
discharged to the lagoon from the former mill and containerboard facility. Based on available<br />
reports, and a scoping meeting CH2MHill held with Weyerhaeuser on February 13, 1995<br />
(CH2MHill, 1996b), the following contaminants were identified as Contaminants <strong>of</strong> Potential<br />
Concern (COPECs):<br />
• Arsenic<br />
• Cadmium<br />
• Chromium<br />
• Copper<br />
• Lead<br />
• Iron<br />
7
• Magnesium<br />
• Cyanide<br />
• Sulfides<br />
The metals found in the lagoon were not part <strong>of</strong> the pulping process, but were associated with raw<br />
materials including recycled paperboard, virgin wood chips, and even industrial raw water supply,<br />
(Sweet-Edwards/Emcon, 1990) 1.<br />
Cyanide and sulfides are associated with raw materials and the<br />
decomposition <strong>of</strong> sludge’s in the lagoon (CH2MHill, 1996b), and were primarily associated with the<br />
former pulp mill process.<br />
Weyerhaeuser has conducted sampling analysis for sludge from its mill discharges. These samples<br />
were analyzed for pesticides, herbicides, and semi-volatile compounds, all <strong>of</strong> which were below<br />
detection limits (CH2Mhill, 1996b). During file review, SHN was unable to confirm and or locate<br />
the sample results <strong>of</strong> the additional sludge sampling conducted by Weyerhaeuser.<br />
1.3 Existing Characteristics<br />
1.3.1 Sludge<br />
SHN reviewed the following documents for information on sludge sampling <strong>of</strong> the 270 acre<br />
wastewater treatment lagoon and the stabilization basin (also called the ASB):<br />
• “<strong>Wastewater</strong> Lagoon Ecological Risk Assessment” (1996, CH2M) An evaluation <strong>of</strong> the<br />
impact <strong>of</strong> leaving solids in place following cessation <strong>of</strong> discharge to the lagoon and<br />
• “Weyerhaeuser <strong>Wastewater</strong> <strong>Treatment</strong> Systems Soils Sampling Plan”, conducted in 2005 as<br />
part <strong>of</strong> the containerboard facility final closure.<br />
1.3.2 <strong>Wastewater</strong> Lagoon<br />
In 1996, disposal to the wastewater lagoons ceased, as effluent from the mill was pumped directly<br />
to the ASB, then to the ocean outfall. “The lagoons operated for a period <strong>of</strong> approximately 30 years,<br />
and biological solids produced during treatment, settled in the lagoons to a depth <strong>of</strong> less than a foot<br />
on average” (1996, CH2M). Direct estimates <strong>of</strong> toxicity to aquatic invertebrates conducted as part<br />
<strong>of</strong> the Risk Assessment showed no toxicity in the sediments <strong>of</strong> the wastewater lagoon and adjacent<br />
wetlands areas to the north and south. Sediment sampling determined that concentrations <strong>of</strong> the<br />
trace metals listed as contaminants <strong>of</strong> concern were below “conservative criteria protective <strong>of</strong><br />
natural resources, 2 ” and no unacceptable risks were identified. 3<br />
1 The 2000 HAR indicates that raw industrial supply water contained elevated levels <strong>of</strong> arsenic, chromium,<br />
iron and magnesium (2000 HAR).<br />
2 The conservative values were based on site-specific Critical Toxicity Values (CTVs) developed to be<br />
protective <strong>of</strong> plants, soil invertebrates and wildlife.<br />
3 Summary <strong>of</strong> Potential Risk Weyerhaeuser <strong>North</strong> Bend Mill <strong>Wastewater</strong> Lagoon” (1996, CH2M)<br />
8
1.3.3 Stabilization Basin<br />
The volume <strong>of</strong> the solids in the existing ASB pond is unknown. The stabilization basin was<br />
constructed in 1990 and received wastewater from the pulp mill until Weyerhaeuser completed a<br />
conversion <strong>of</strong> the facility to a containerboard facility with 100% recycle in 1995. The containerboard<br />
facility was closed in 2003 and discharge to the ponds was reduced to storm-water and leachate<br />
from a land-fill at the mill-site.<br />
The stabilization basin, the ASB, was included in lagoon sludge sampling conducted by<br />
Weyerhaeuser in 2005. The results for the stabilization basin are summarized in Table 1.2.<br />
Concentrations were below federal industrial and residential standards for all metals listed as<br />
Contaminant <strong>of</strong> Potential Concern (COPEC). Concentrations <strong>of</strong> PCBs and volatile organic<br />
compounds were below induplotstrial standards and generally below residential standards,<br />
however levels <strong>of</strong> Dioxin, expressed as Toxic Equivalency Units (TEQ) were above EPA standards.<br />
Table 1.2<br />
Sludge Sampling <strong>of</strong> Stabilization Basin<br />
Weyerhaeuser 2005 CFR2 Part 503 PRG3 Standards<br />
Stabilization Basin1 Pollutant Concentrations Industrial Residential<br />
Constituent4 mg/kg mg/kg mg/kg mg/kg<br />
Arsenic
sludge sampled were below the concentration limits in Part 503 Table 3 for land application for all<br />
constituents sampled.<br />
1.3.4 Environmental Issues<br />
The wetlands surrounding the existing stabilization basin were previously part <strong>of</strong> the 270-acre<br />
treatment lagoon. In 1993 Weyerhaeuser modified the treatment lagoon to minimize the<br />
environmental impact associated with the closure and enhance the beneficial use <strong>of</strong> the open water<br />
body for wildlife. The former lagoon area was allowed to cleanse itself through natural flushing<br />
processes and the accumulated sludge was retained in place after testing indicated that leachate<br />
quality were projected to fall within acceptable <strong>Oregon</strong> Groundwater Criteria (OAR 340.40). 5<br />
Groundwater Contamination Concerns<br />
The former wastewater lagoon and stabilization basin is underlain by approximately 50 ft <strong>of</strong> dunal<br />
sand which in turn is underlain by marine derived sand. The total sand thickness ranges from 100-<br />
150 feet. Groundwater occurs in unconfined conditions in the sand with a water table ranging in<br />
elevation from 2-10 ft above MSL( 5.5 -13.5 feet above MLLW).<br />
Groundwater monitoring wells in place in the area <strong>of</strong> the former wastewater treatment lagoon and<br />
existing ASB are shown in Figure 1.4. Hydrographs from these monitoring wells from September<br />
2000 through November 2005 included in Appendix B, indicate that the hydrological gradient is<br />
generally south and east towards the <strong>Bay</strong>.<br />
Groundwater monitoring information from the “2005 Environmental Monitoring Report” (February<br />
2006, Weyerhaeuser) is included in Table 1.3. Data from monitoring well MW 18 upgradient from<br />
the stabilization basin and former wastewater lagoon is used to define background levels. The<br />
background data shows high levels <strong>of</strong> iron, manganese, and color and seasonal fluctuations <strong>of</strong><br />
monitored parameters. The data reported for 2005 indicates chloride, sulphate, and sodium levels<br />
in MW 17 and MW-19 above background levels. The report stated that monitoring has shown a<br />
steady improvement in levels <strong>of</strong> these constituents in MW-19S and 19D since the ASB ceased<br />
receiving wastewater in 2005.<br />
5 December 1993, CH2M, “Closure Plan for <strong>Wastewater</strong> Impoundments at Weyerhaeuser Paper Company<br />
<strong>North</strong> Bend, <strong>Oregon</strong>.”<br />
10
\\<strong>Coos</strong>bay\projects\2009\609031-CBGeoGenSvc\115-N-<strong>Spit</strong>-WW-Trtmtnt-Site\Figs , SAVED: 5/11/2010 10:56 AM SFRAZZINI , PLOTTED: 5/11/2010 11:00 AM , SHAWN FRAZZINI<br />
Consulting Engineers<br />
& Geologists, Inc.<br />
City <strong>of</strong> <strong>Coos</strong> <strong>Bay</strong><br />
<strong>Wastewater</strong> <strong>Treatment</strong> <strong>Plant</strong><br />
<strong>Coos</strong> <strong>Bay</strong>, <strong>Oregon</strong><br />
May 2010 609031-115-FIG-1-4-Groundwater<br />
Groundwater Wells<br />
Figure 1.4
Table 1.3<br />
Groundwater Quality Concentrations<br />
Background<br />
Additional<br />
Sampling<br />
Shallow Deep Shallow Deep OAR<br />
Wells Wells Wells Wells Table<br />
Constituent Units mg/L mg/L mg/L mg/L mg/L<br />
pH 6.2 7.3 7.52 6.77<br />
Specific Conductance uS/cm 136.0 307.0<br />
Temperature °C 14.2 13.7 12.2 12.2<br />
Color APHA Units 27.0 5.0 15<br />
Chloride mg/L 11.0 19.0 18.3 26.5 250<br />
Sulfate mg/L
\\<strong>Coos</strong>bay\projects\2009\609031-CBGeoGenSvc\115-N-<strong>Spit</strong>-WW-Trtmtnt-Site\Figs , SAVED: 5/12/2010 10:39 AM SFRAZZINI , PLOTTED: 5/12/2010 10:45 AM , SHAWN FRAZZINI<br />
National Wetlands Inventory<br />
City <strong>of</strong> <strong>Coos</strong> <strong>Bay</strong><br />
<strong>Wastewater</strong> <strong>Treatment</strong> <strong>Plant</strong><br />
<strong>Coos</strong> <strong>Bay</strong>, <strong>Oregon</strong><br />
1.5<br />
Figure<br />
May 2010 609031-115-FIG-1-5-Wetlands<br />
Consulting Engineers<br />
& Geologists, Inc.
Ponds provide areas <strong>of</strong> open water adjacent to the more heavily vegetated freshwater shrublands<br />
and thickets, and support a community <strong>of</strong> aquatic invertebrates, fish, and amphibians. Many <strong>of</strong> the<br />
species inhabiting the ponds are important food sources for other animals. Although the inland<br />
open water sites <strong>of</strong> the <strong>North</strong> <strong>Spit</strong> are not considered high quality nesting habitat for most species<br />
<strong>of</strong> waterfowl, they are used for foraging by a variety <strong>of</strong> migrating waterfowl during the spring, fall,<br />
and winter (Thornburgh 1991).<br />
A combination <strong>of</strong> structurally complex habitat features and an abundant variety <strong>of</strong> available food<br />
sources support a variety <strong>of</strong> bird species. Waterfowl, shorebirds, passerines and raptors nest or<br />
forage in the freshwater wetlands, and migratory birds rest and feed there while traveling.<br />
Following closure, the wastewater lagoon was the subject <strong>of</strong> an extensive monitoring and sampling<br />
plan. Field sampling <strong>of</strong> the lagoon /wetlands included birds, vegetation, sediments, surface water<br />
and pore water (June 1996, CH2M). A summary <strong>of</strong> field survey results for June 1996 is included as<br />
Table 1.4. A more recent survey and wetlands delineation was completed in December 1997 by<br />
Stuntzner Engineering and Forestry.<br />
Table 1.4<br />
Summary <strong>of</strong> Wetlands/Lagoon Field Surveys1 Common Name<br />
Amphibians and Reptiles<br />
Scientific Name Habitat<br />
Pacific Treefrog<br />
Birds<br />
Hyla regilla Emergent/scrub-shrub<br />
Red-winged Blackbird Agelaius phoeniceus Scrub-shrub<br />
Mourning Dove Zenaidura macroura Scrub-shrub<br />
Bonapartes Gull Larus Philadelphia Open Water<br />
Great Blue Heron Ardea Herodias Mudflat/emergent<br />
Swallow spp Various Open water (foraging)<br />
Canada Goose eggs – predated Branta Canadensis Upland<br />
Marsh Wren Cistothorus palustris Flyover<br />
Turkey Vulture Cathartes aura Flyover<br />
Cinnamon Teal Anas cyanoptera Open water<br />
Killdeer Charadrius vociferous Scrub-shrub<br />
American Goldfinch<br />
Mammals<br />
Spinus tristis Scrub-shrub<br />
Deer spp Various Scrub-shrub<br />
1. Conducted in June 1996 at Weyerhaeuser’s <strong>Wastewater</strong> Lagoon.<br />
Water chemical analysis for surface and pore waters in the lagoon/wetlands area indicate levels <strong>of</strong><br />
chemicals <strong>of</strong> potential ecological concern above groundwater reference standards and CTVs for<br />
some metals. 6 However the Assessment (1996) concluded that “the surface waters do not produce<br />
chronic effects and any aquatic organisms inhabiting the lagoon were not affected.”<br />
6 Conservative CTVs or Effect Range- Low concentrations (ERLs) developed in the <strong>Wastewater</strong> Lagoon Risk<br />
Assessment(1995, CH2M Hill).<br />
14
Sediment samples collected in the intertidal and north intertidal (reference) sites confirmed that<br />
sediment concentrations <strong>of</strong> all COPECs discussed in the previous section were less than the Effect<br />
Range- Low concentrations (ERLs) or conservative CTVs referenced previously, and the chemistry<br />
on both areas was similar indicating the lack <strong>of</strong> influence on the intertidal area from the former<br />
lagoon (1997, CH2M).<br />
1.3.5 Wetland Considerations<br />
Based on conversations with Division <strong>of</strong> State Lands (DSL) and DEQ, use <strong>of</strong> the 31 acre ASB<br />
industrial treatment lagoon for municipal wastewater treatment should be considered acceptable.<br />
The ASB currently provides wastewater treatment under NPDES permit No. 96255. The facility is<br />
in active operation. Conversion to a regional treatment facility for the City <strong>of</strong> <strong>Coos</strong> <strong>Bay</strong> would be<br />
consistent with the current use. Low lying areas outside <strong>of</strong> the ASB, however, have been delineated<br />
as wetland habitat and any disturbances in these areas would require fill removal permits.<br />
Considering the value <strong>of</strong> coastal wetlands in the vicinity, fill or removal occurring in the wetland<br />
areas would likely require mitigation if avoidance and minimization cannot first be accomplished.<br />
Several options considered in this feasibility report have potential impacts to wetlands. In these<br />
alternatives, estimates <strong>of</strong> mitigation costs have been considered based on discussions with<br />
consultants who have worked on similar projects in the area.<br />
The initial concept for a <strong>North</strong> <strong>Spit</strong> treatment facility for <strong>Coos</strong> <strong>Bay</strong> considered the use <strong>of</strong> constructed<br />
wetlands for enhanced treatment. The thought was that constructed wetlands could be located in<br />
open water areas, potentially providing additional or enchanced habitat. Considering the potential<br />
for DSC to take over jurisdiction current wetland areas and the potential to impact these areas<br />
using constructed wetland technologies, this concept may not be practical. The DSL may not<br />
consider the constructed wetland as equivalent habitat and instead, could consider it an impact to<br />
wetland habitats. Since enhanced treatment is not essential prior to discharge to the ocean,<br />
consideration <strong>of</strong> a constructed wetlands for treatment is not considered practical at this time.<br />
Futher discussions with DSL should explore this issue.<br />
15
2.0 Design Criteria<br />
2.1 Regulatory Constraints<br />
2.1.1 NPDES Permit<br />
The current limits for discharge into the bay are dictated by the City’s current NPDES permit<br />
(#100771) and are shown below in Table 2.1.1a. The current permit has an expiration date <strong>of</strong><br />
12/31/2007 but is still in effect today. It is likely that if the decision is made to continue to<br />
discharge into the bay that the parameters listed below will be modified to become more stringent.<br />
Table 2.1 (Current Design Discharge Parameters)<br />
Average Effluent Montly Weekly Daily<br />
Monthly, Weekly average, average, maximum,<br />
Parameter<br />
May 1 - October 31:<br />
mg/L mg/L ppd ppd lbs<br />
BOD - 5 20 30 340 510 670<br />
TSS<br />
November 1 - April 30:<br />
20 30 340 510 670<br />
BOD - 5 30 45 510 760 1000<br />
TSS<br />
Other parameters:<br />
30 45 510 760 1000<br />
Fecal Coliform Bacteria<br />
Shall not exceed a monthly mean <strong>of</strong> 14 organisms<br />
per 100 mL. Not more than 10 percent <strong>of</strong> the<br />
samples shall exceed 43 organisms per 100 mL.<br />
pH (year round)<br />
6.0 - 9.0<br />
BOD and TSS Removal Efficiency<br />
Shall not be less than 85%<br />
Total Residual Chlorine<br />
0.02 mg/L monthly<br />
0.05 mg/L daily<br />
Ammonia-N (May 1 - October 31)<br />
20 mg/l monthly<br />
30 mg/l daily<br />
Excess Thermal Load (May 1 - October 31)<br />
37 Million kcals/day<br />
16
Based on recent discussions with DEQ for a similar ocean outfall, we anticipate approximate<br />
effluent limitations as shown in Table 2.2<br />
Table 2.2 (Expected Design Discharge Parameters)<br />
Parameter<br />
Average Effluent Montly<br />
Monthly,<br />
mg/L<br />
17<br />
Weekly<br />
mg/L<br />
average,<br />
ppd<br />
Weekly<br />
average,<br />
ppd<br />
Daily<br />
maximum,<br />
ppd<br />
May 1 - October 31:<br />
BOD - 5 30 45 510 765 1005<br />
TSS<br />
November 1 - April 30:<br />
50 75 850 1275 1675<br />
BOD - 5 30 45 510 765 1005<br />
TSS<br />
Other parameters:<br />
50 75 850 1275 1675<br />
Entercocci Bacteria<br />
Shall not exceed a monthly geometric mean <strong>of</strong> 35<br />
organisms per 100 mL. No single sample shall<br />
exceed 104 organisms per 100 mL.<br />
Shall not exceed a monthly mean <strong>of</strong> 14 organisms<br />
Fecal Coliform Bacteria<br />
per 100 mL. Not more than 10 percent <strong>of</strong> the<br />
samples shall exceed 43 organisms per 100 mL.<br />
pH (year round)<br />
6.0 - 9.0<br />
BOD and TSS Removal Efficiency<br />
Shall not be less than 85% monthly average for BOD<br />
and 65% monthly average for TSS.<br />
Shall not exceed a montly average concentration <strong>of</strong><br />
Chlorine Produced Oxidants<br />
0.21 mg/l and a daily maximum concentration <strong>of</strong> 0.31<br />
mg/l.<br />
2.2 Flows and Loadings<br />
The flow and load projections are based on current flows and loads and anticipated community<br />
growth. The WWTP No. 2 service area, comprised <strong>of</strong> a portion <strong>of</strong> <strong>Coos</strong> <strong>Bay</strong> and the community <strong>of</strong><br />
Charleston, is projected to have a population <strong>of</strong> 12,440 by 2027. Based on the Facilities Plan<br />
completed in 2007 by The Dyer Partnership, future sanitary flows are projected by applying the<br />
anticipated population growth rate to the current sanitary flows. Anticipated flows and loadings<br />
are shown in Table 2.3 below:
Table 2.3<br />
<strong>Wastewater</strong> Characteristics Factor 2003 2027<br />
Flows, mgd:<br />
Average Dry Weather Flow (ADWF)<br />
Average Wet Weather Flow (AWWF)<br />
Average Annual Flow (AAF)<br />
Maximum Month Dry Weather Flow (MMDWF)<br />
Maximum Month Wet Weather Flow (MMWWF)<br />
Maximum Week Wet Weather Flow (MWWWF)<br />
Peak Day Flow (PDF)<br />
Peak Wet Weather Flow (PWWF)<br />
Loads:<br />
BOD, ppd<br />
Average<br />
Max month<br />
Peak Day<br />
TSS, ppd<br />
Average<br />
Max month<br />
Peak Day<br />
18<br />
0.9<br />
1.6<br />
1.2<br />
1.2<br />
2.1<br />
2.3<br />
4.5<br />
7.0<br />
1,800<br />
2,200<br />
3,800<br />
2,000<br />
2,500<br />
4,300<br />
1.0<br />
1.9<br />
1.4<br />
1.4<br />
2.4<br />
2.7<br />
5.5<br />
8.6<br />
2,200<br />
2,700<br />
4,700<br />
2,500<br />
4,000<br />
6,800
3.0 Preliminary <strong>Treatment</strong> Alternatives<br />
3.1 Headworks<br />
3.1.1 Description<br />
The headworks assembly will be a concrete structure with two depressed flow channels. The<br />
primary channel will include a mechanically cleaned fine screen, and the bypass channel will be<br />
elevated and fitted with a manual bar screen. Downstream <strong>of</strong> the screen channels will be a grit<br />
chamber.<br />
3.1.2 Site Evaluation<br />
The headworks can be located either on the north spit, or can be before the pump station at the<br />
existing treatment site.<br />
3.1.2.1 <strong>North</strong> <strong>Spit</strong> Headworks Option<br />
Option 1, on the north spit, enables operation and maintenance <strong>of</strong> the treatment system to be in one<br />
location, saving time and energy. The facility would be elevated above the subsequent biological<br />
treatment stage to allow for gravity flow throughout the remainder <strong>of</strong> the treatment process.<br />
3.1.2.2 Existing Site Headworks Option<br />
Option 2, at the existing treatment plant site, would require an additional pump station or locating<br />
the headworks below grade. An additional pump station would be very expensive (~$2M) while<br />
locating the headworks below grade causes concerns with potential flooding and possible confined<br />
work spaces. The benefit to locating the pump station at the existing treatment site is the ability to<br />
use a slightly more efficient pump since the solids will have been screened out. There’s also an<br />
option <strong>of</strong> providing some primary treatment on the existing site (see section 3.2) which would<br />
require the headworks be located on the existing site.<br />
3.1.3 Preferred Location<br />
Based on the additional costs & concerns associated with locating the headworks on or near the<br />
existing site, the north spit option is preferred.<br />
3.1.4 Cost<br />
The cost associated with the headworks is independent <strong>of</strong> its location and is summarized in Table<br />
3.1.4 below:<br />
19
Table 3.1.4, Headworks Cost Estimate<br />
Headworks<br />
Item No. Description Units Quantity Unit Cost Total Cost<br />
1 Bonds, Insurance, Mobilization & Permits (15%) ls 1 $144,600.00 $144,600.00<br />
2 Manual Bar Screen ea 1 $10,000.00 $10,000.00<br />
3 Mechanical Auger Screen ea 2 $300,000.00 $600,000.00<br />
4 Concrete Headworks Structure cy 80 $800.00 $64,000.00<br />
5 Steel Pile Foundations ls 4 $35,000.00 $140,000.00<br />
6 Screenings Handling & Disposal Equipment ls 1 $15,000.00 $15,000.00<br />
7 Force Main Pipe, Fittings, Supports, Etc. ls 1 $15,000.00 $15,000.00<br />
8 Metal Railings & Decking ls 1 $20,000.00 $20,000.00<br />
9 Electrical, Lighting & Controls ls 1 $100,000.00 $100,000.00<br />
3.2 Primary <strong>Treatment</strong><br />
20<br />
Construction Total $1,108,600.00<br />
Contingency (15%) $166,290.00<br />
Engineering (18%) $199,548.00<br />
Administrative costs (3%) $33,258.00<br />
Total Project Costs $1,507,696.00<br />
As precluded to above, there is an option to include a level <strong>of</strong> primary treatment on the existing<br />
treatment plant site prior to conveyance to the north spit. Because the existing plant would remain<br />
in service during construction <strong>of</strong> new facilities, the area south <strong>of</strong> Fulton Avenue would be used for<br />
any new treatment facilities. The area available is bounded by the <strong>Bay</strong> to the west, Fulton Avenue<br />
to the north and delineated wetlands to the south and east. The available property to locate any<br />
new facilities is approximately 100’ wide by 300’ long.<br />
There is also potential for locating primary treatment on the north spit, outside <strong>of</strong> the wetland<br />
boundary. Since the potential primary treatment site on the north spit is larger than the land<br />
available at the existing site, there is no reason other than pump efficiency to include pretreatment<br />
or primary treatment at the existing site since any pump efficiencies will be negated by having to<br />
pump twice.<br />
3.2.1 Performance<br />
For the purposes <strong>of</strong> this study, it is assumed that each <strong>of</strong> the above referenced treatment<br />
alternatives is capable <strong>of</strong> providing a 25% removal <strong>of</strong> BOD and a 40% removal <strong>of</strong> TSS. These<br />
reductions would reduce the required footprint for secondary treatment on the north spit.<br />
3.2.2 Evaluation<br />
Although primary treatment reduces the loading in the treatment stream, the benefits <strong>of</strong> doing so<br />
on the existing site are minimal when compared with additional costs. The same treatment can be<br />
done on the north spit without the required additional pump station costs.<br />
4.0 Pumping Requirements
4.1 Force Main<br />
Two options are being considered to convey the wastewater to the north spit site and are discussed<br />
below. The first being a single force main drilled beneath the bay to convey all <strong>of</strong> the flows. The<br />
second option also would require a new force main drilled under the bay but includes the use <strong>of</strong> an<br />
existing 10” HDPE pipe which was installed in 2005.<br />
On both options, certain design considerations must be met. In accordance with the DEQ<br />
publication “<strong>Oregon</strong> Standards for Design and Construction <strong>of</strong> <strong>Wastewater</strong> Pump Stations”, the<br />
pump and forcemain system shall have a maximum fluid velocity <strong>of</strong> not more than 8 feet per<br />
second. The pumping system shall also maintain a minimum velocity in the force main <strong>of</strong> 2.0 f.p.s.<br />
after an initial flushing at a minimum <strong>of</strong> 3.5 f.p.s. during each pumping cycle.<br />
4.1.1 Single Force Main Option<br />
This option entails pumping the entire volume through a single forcemain to the north spit. The<br />
pipe would go from the existing plant site, across the bay to an area just south <strong>of</strong> the Anadromous<br />
Facility and from there along the Trans Pacific Parkway to the treatment site. See Figure 4.1.1<br />
below. The section from the existing treatment site to the other side <strong>of</strong> the bay (~5000 l.f.) would be<br />
installed using Horizontal Directional Drilling methodology, and the remainder (~6900 l.f.) would<br />
be laid using the traditional open trench method.<br />
In order to transmit 8.6 MGD at a velocity <strong>of</strong> no more than 8 feet per second, a minimum <strong>of</strong> a 17.5”<br />
inside diameter (I.D.) pipe must be used. For this study, an 18” Fusible Sch. 80 PVC or a 22” DR 11<br />
HDPE (I.D. = 17.84”) are being considered. Using larger pipes exacerbates the issues noted below.<br />
The PVC pipe has a pressure rating <strong>of</strong> 220 psi and the HDPE has a pressure rating <strong>of</strong> 160 psi. The<br />
elevation difference between the proposed wetwell low water elevation and the outlet <strong>of</strong> the pipe at<br />
the top <strong>of</strong> the proposed headworks is approximately 40’. The headloss associated with pumping<br />
8.6 MGD at 8 feet per second through either <strong>of</strong> these pipes is approximately 131’. Including static<br />
head and dynamic losses, the total pumping head <strong>of</strong> 170’, which equates to 73 psi, is well below the<br />
pressure rating <strong>of</strong> both pipe types. Total head when pumping the required minimum 2.0 feet per<br />
second (2.3 MGD) drops to 51’ (22 psi). This large variation in pumping head will necessitate<br />
multiple pumps equipped with a detailed SCADA system to operate the pumps at the various<br />
flows.<br />
While this option is the least expensive to construct, it has multiple disadvantages during the dry<br />
weather months. During dry weather, the average low flow is approximately 0.75 MGD. To pump<br />
that small <strong>of</strong> a flow in a relatively large forcemain with a minimum velocity <strong>of</strong> 2.0 feet per second,<br />
the pumps will only operate for a few minutes at a time. Furthermore, based on the average low<br />
flow, the wastewater will be in the forcemain for over 5 hours. The detention time in the forcemain<br />
will most likely go up to over 8 hours during daily periods <strong>of</strong> low flow, i.e. overnight. Based on the<br />
DEQ pump station design guidelines mentioned above, any forcemain with anaerobic detention<br />
times in excess <strong>of</strong> 35 minutes needs to have hydrogen sulfide (H2S) controls. H2S can be controlled<br />
with a chlorine drip into the wetwell, although this will require an on-site chlorine generator or<br />
chlorine delivery to the pump station.<br />
21
4.1.2 Double Force Main Option<br />
Anticipating future need, in 2005 the City installed a 10” DR11 HDPE (8.72” I.D.) pipe under the<br />
bay from the end <strong>of</strong> Newmark Avenue to the same outlet described above near the fish hatchery.<br />
Using this pipe to pump dry weather flows (up to 1.3 MGD), in addition to an 18” for high flows,<br />
allows for more efficient pumps to be used and reduces the detention time from over 4 hours to just<br />
over 2 hours.<br />
Based on head losses through the smaller pipe, this option would be most efficient with new 12”<br />
I.D. pipe on either side <strong>of</strong> the existing pipe. On the city side <strong>of</strong> the bay, traditional open trench pipe<br />
laying construction would be used to lay 3,700 l.f. <strong>of</strong> new forcemain along Cape Arago Highway<br />
north to Newmark Avenue. This section <strong>of</strong> pipe installation would be more expensive due to<br />
existing utilities than the section on the other side <strong>of</strong> the bay where the 12” pipe could be installed<br />
in a joint trench with the proposed 18” pipe.<br />
Disadvantages to the double force main option include higher capital costs due to additional<br />
piping, and additional low flow pumps. As mentioned above, additional pumps will be more<br />
efficient, therefore a life cycle cost comparison must be done to determine the preferred method.<br />
Tables 4.1.1 and 4.1.2 below summarize the estimated costs <strong>of</strong> these two conveyance options.<br />
Table 4.1, Forcemain Cost Estimate (Single Force Main)<br />
Forcemain (Single Force Main)<br />
Item No. Description Units Quantity Unit Cost Total Cost<br />
1 Bonds, Insurance, Mobilization & Permits (15%) ls all $463,500.00 $463,500.00<br />
2 18-Inch HDPE Direct Bury Forcemain lf 8000 $135.00 $1,080,000.00<br />
3 18-Inch HDPE HDD Forcemain lf 5000 $400.00 $2,000,000.00<br />
4 AC Pavement Patch in <strong>North</strong> <strong>Spit</strong> Pkwy. ls all $10,000.00 $10,000.00<br />
Construction Total $3,553,500.00<br />
Contingency (15%) $533,025.00<br />
Engineering (18%) $639,630.00<br />
Administrative costs (3%) $106,605.00<br />
Total Project Costs $4,832,760.00<br />
23
Table 4.2, Forcemain Cost Estimate (Double Force Main)<br />
FORCEMAIN (DOUBLE FORCE MAIN OPTION)<br />
Item No. Description Units Quantity Unit Cost Total Cost<br />
1 Bonds, Insurance, Mobilization & Permits (15%) ls all $697,432.50 $697,432.50<br />
2 18-Inch HDPE Direct Bury Forcemain lf 8000 $180.00 $1,440,000.00<br />
3 18-Inch HDPE HDD Forcemain lf 5000 $400.00 $2,000,000.00<br />
4 12-Inch HDPE Direct Bury Forcemain (Cape Arago Hwy) lf 3695 $150.00 $554,250.00<br />
5 12-Inch HDPE Direct Bury Forcemain (<strong>North</strong> <strong>Spit</strong>) lf 7170 $90.00 $645,300.00<br />
6 AC Pavement Patch in <strong>North</strong> <strong>Spit</strong> Pkwy. ls all $10,000.00 $10,000.00<br />
24<br />
Construction Total $5,346,982.50<br />
Contingency (15%) $802,047.38<br />
Engineering (18%) $962,456.85<br />
Administrative costs (3%) $160,409.48<br />
Total Project Costs $7,271,896.20<br />
4.2 Pump Station<br />
Transfer <strong>of</strong> raw sewage from the current treatment site in Empire to the north spit requires a pump<br />
station. The pump station will be required to pump the Peak Wet Weather Flow (PWWF) with the<br />
largest pump out <strong>of</strong> service. Because different pumping arrangements will be required for the<br />
different force main configurations, there are two corresponding options for the pump station.<br />
4.2.1 Single Force Main Pump Station<br />
As discussed in Section 4.1.1, the pump station for a single 18” force main will have to be able to<br />
pump between 8.6 MGD against 170’ <strong>of</strong> head and 2.3 MGD (2.0 fps) against 51’ <strong>of</strong> head. A cursory<br />
review <strong>of</strong> pump curves yields a system including three (2+1 redundancy) 250 horsepower pumps<br />
to pump between 4.3 MGD and 8.6 MGD and a single 85 horsepower pump to pump from 2.3<br />
MGD to 4.3 MGD. All motors will be equipped with variable speed drives (VFDs) to maximize<br />
efficiency.<br />
4.2.2 Double Force Main Pump Station<br />
The pump station for the double force main option will have two different pump systems, one to<br />
pump the low summertime flows ( 7.16 MGD) both sets <strong>of</strong> pumps will combine to pump the 8.6 MGD peak flow.<br />
The first system, for low summertime flows, will consist <strong>of</strong> a single 20 horsepower pump to handle<br />
most dry weather flows (
Vmaximum = (Tminutes x Qmin)<br />
Vmaximum = Maximum volume in gallons<br />
Tminutes = Maximum detention time in minutes (35 minutes)<br />
Qmin = Dry Weather Flow (0.75 MGD = 520 gpm)<br />
Therefore: Vmaximum = (35 minutes x 520 gpm) = 18200 gallons (2432 ft 3).<br />
The minimum size <strong>of</strong> the wetwell is determined to keep the pumps from cycling more than 10<br />
times per hour. The DEQ formula for this determination is:<br />
Vminimum = (Tminutes x Qmax) / 4<br />
Vminimum = Minimum volume in gallons<br />
Tminutes = Target time between pump starts in minutes (6 minutes)<br />
Qmax = Pump design capacity (8.6 MGD = 5970 gpm)<br />
Therefore: Vminimum = (6 minutes x 5970 gpm)/4 = 8955 gallons (1197 ft 3).<br />
Based on the pumps identified above, and according to the Flygt Design Recommendation For Pump<br />
Stations with Midrange Centrifugal <strong>Wastewater</strong> Pumps, the wetwell would be required to be at least 12’<br />
x 10’ to fit the four pumps required in the single force main option and 12’ x 15’ to fit the eight<br />
pumps in the double force main option. This bottom area, combined with the maximum and<br />
minimum volumes calculated above, result in a storage depth <strong>of</strong> 10 to 20 feet. For the purpose <strong>of</strong><br />
this evaluation, a storage depth <strong>of</strong> 15’ will be used. The storage depth is the area between the pump<br />
start level (HWL) and the pump stop level (LWL). The minimum depth below the LWL for proper<br />
pump operation is 3’. The HWL must be a minimum <strong>of</strong> 1’ below the invert <strong>of</strong> the inflow pipe. For<br />
this project, the invert <strong>of</strong> the sewer pipe is 6’ below the ground surface. The combination <strong>of</strong> all<br />
these factors results in a total wetwell depth <strong>of</strong> 25’<br />
Tables 4.2.1 and 4.2.2 below summarize the costs associated with the pump stations for the two<br />
different conveyance options:<br />
25
Table 4.2.1, Pump Station Cost Estimate (Single Force Main)<br />
PUMP STATION (SINGLE FORCE MAIN OPTION)<br />
Item No. Description Units Quantity Unit Cost Total Cost<br />
1 Bonds, Insurance, Mobilization & Permits (15%) ls all $189,798.00 $189,798.00<br />
2 Construction Facilities and Temporary Systems ls all $15,000.00 $15,000.00<br />
3 Wetwell, Excavation and Installation ls all $207,920.00 $207,920.00<br />
4 Pumps, VFDs, Accessories, and Installation ls all $405,600.00 $405,600.00<br />
5 Electrical, Wiring, Panels, Level Controls, SCADA ls all $90,100.00 $90,100.00<br />
6 Site Piping, Valves, Fittings, Valve Vault, Installation ls all $180,000.00 $180,000.00<br />
7 Flowmeter and Vault ls all $33,200.00 $33,200.00<br />
8 Chlorine drip (Clorine generator) ls all $70,000.00 $70,000.00<br />
9 24-Inch Influent Pipe lf 50 $240.00 $12,000.00<br />
10 Influent Pipe Connection ls all $25,000.00 $25,000.00<br />
11 AC Pavement and Base ls all $6,500.00 $6,500.00<br />
12 Demolition and Abandonment <strong>of</strong> Existing <strong>Treatment</strong> Site ls all $220,000.00 $220,000.00<br />
Table 4.2.2, Pump Station Cost Estimate (Double Force Main)<br />
26<br />
Construction Total $1,455,118.00<br />
Contingency (15%) $218,267.70<br />
Engineering (18%) $261,921.24<br />
Administrative costs (3%) $43,653.54<br />
Total Project Costs $1,978,960.48<br />
PUMP STATION (DOUBLE FORCE MAIN OPTION)<br />
Item No. Description Units Quantity Unit Cost Total Cost<br />
1 Bonds, Insurance, Mobilization & Permits (15%) ls all $202,401.00 $202,401.00<br />
2 Construction Facilities and Temporary Systems ls all $15,000.00 $15,000.00<br />
3 Wetwell, Excavation and Installation ls all $264,490.00 $264,490.00<br />
4 Pumps, VFDs, Accessories, and Installation ls all $416,650.00 $416,650.00<br />
5 Electrical, Wiring, Panels, Level Controls, SCADA ls all $106,500.00 $106,500.00<br />
6 Site Piping, Valves, Fittings, Valve Vault, Installation ls all $180,000.00 $180,000.00<br />
7 Flowmeter and Vault ls all $33,200.00 $33,200.00<br />
8 Chlorine drip (Clorine generator) ls all $70,000.00 $70,000.00<br />
9 24-Inch Influent Pipe lf 50 $240.00 $12,000.00<br />
10 Influent Pipe Connection ls all $25,000.00 $25,000.00<br />
11 AC Pavement and Base ls all $6,500.00 $6,500.00<br />
12 Demolition and Abandonment <strong>of</strong> Existing <strong>Treatment</strong> Site ls all $220,000.00 $220,000.00<br />
Construction Total $1,551,741.00<br />
Contingency (15%) $232,761.15<br />
Engineering (18%) $279,313.38<br />
Administrative costs (3%) $46,552.23<br />
Total Project Costs $2,110,367.76<br />
For the purposes <strong>of</strong> this study, the single force main option will be utilized. Should the north spit<br />
be a viable alternative for the City, additional investigation should be done to determine the lifecycle<br />
costs <strong>of</strong> each <strong>of</strong> these conveyance options.
5.0 <strong>Treatment</strong> Alternatives<br />
Secondary treatment alternatives considered for a <strong>North</strong> <strong>Spit</strong> municipal wastewater treatment<br />
facility have been based on using stabilization lagoon technologies. Stabilization lagoon<br />
technologies will conform to DEQ’s design guidelines for facultative lagoon systems. Facultative<br />
lagoons are the most common type <strong>of</strong> lagoon treatment system employed for municipal treatment<br />
facilities and can be provided with and without surface aeration.<br />
The requirements for a lagoon system were evaluated based on the loading criteria presented in<br />
Section 2 both with and without primary treatment. The evaluation was based on the assumption<br />
that the lagoon system will provide secondary treatment to either raw municipal wastewater<br />
(screened) or effluent from primary treatment provided at the existing <strong>Plant</strong> 2 site; and that the<br />
secondary effluent will meet anticipated NPDES requirements for Total Suspended Solids (TSS)<br />
and Biological Oxygen Demand (BOD) for an ocean discharge.<br />
Use <strong>of</strong> an enhancement marsh to provide tertiary treatment and nutrient removal is also evaluated<br />
in this section. The need for enhanced wastewater treatment using wetlands was not considered<br />
necessary based on an analysis <strong>of</strong> expected secondary effluent quality from the facultative lagoon<br />
system. Impacts to natural wetland systems currently existing on the site make this option less<br />
desirable.<br />
5.1 Facultative Lagoon System<br />
Facultative lagoons are typically 5-8 ft deep and employ a combination <strong>of</strong> aerobic, facultative, and<br />
anaerobic treatment. The upper layer <strong>of</strong> this type <strong>of</strong> lagoon is aerobic with photosynthesis, reaeration<br />
(and in some cases surface aeration) providing oxygen for aerobic stabilization. Middle<br />
layers are facultative, employing a combination <strong>of</strong> aerobic and anaerobic biological activity to treat<br />
suspended organic material. The lower layer <strong>of</strong> a facultative pond includes an anaerobic zone<br />
where residual solids are digested and reduced to form a stabilized sludge.<br />
Areal loading rates <strong>of</strong> 20-40 lbs/acre-day are used for facultative lagoon systems where average<br />
winter temperatures are 0-15 Degrees C ( 32-60 Degrees F). 7 For stabilization ponds without<br />
primary treatment it is also desirable to have the primary cells loaded at less than 90 lbs/acre-day. 8<br />
When lagoon aeration is provided, areal loading rates are not considered limiting, instead, kinetics<br />
and detention time governs the design criteria.<br />
5.1.1 Alternate 1 - Facultative System<br />
Alternate 1 assumes all wastewater collected at the <strong>Plant</strong> 2 WWTP will be conveyed to the <strong>North</strong><br />
<strong>Spit</strong> for treatment and disposal in a land based lagoon system. <strong>Treatment</strong> facilities to be provided<br />
on the <strong>North</strong> <strong>Spit</strong> include a new headworks, new parallel primary treatment lagoons, and<br />
secondary treatment in the existing ASB lagoon. Area requirements for a facultative lagoon system<br />
that has not received primary treatment were estimated based on projected maximum month<br />
biological oxygen demand (BOD ) loading <strong>of</strong> 2,485 lbs/day and an overall design loading rate <strong>of</strong> 35<br />
7 EPA Design Manual: Municipal <strong>Wastewater</strong> Stabilization Ponds<br />
8 WEF M0P 8<br />
27
lbs/day-acre. The total surface area required for the lagoon system shown is 71 acres including 31<br />
acres from the existing ASB.<br />
A preliminary layout for alternative 1 is shown in Figure 5.1. The primary lagoon has been split<br />
into two parallel trains. This configuration minimizes overall loading on the primary cells while<br />
maintaining an optimum hydraulic flow pattern that promotes plug flow and minimizes short-<br />
circuiting. Due to the area required for treatment without the advent <strong>of</strong> aeration, the new primary<br />
lagoons are shown impacting wetland areas and mitigation costs will need to be considered in the<br />
cost <strong>of</strong> this alternative.<br />
Expected Performance (BOD Removal)<br />
Expected BOD removal in the lagoon system was modeled using two methodologies as described<br />
in the EPA Design Manual: the Wherner-Wilhelm Equation and the Plug Flow Model. The<br />
assumptions used in the analysis include:<br />
• The detention time will be limited by the Maximum Month Flow (MMF) <strong>of</strong> 2.65 MGD,<br />
• The depth <strong>of</strong> the Primary cells (with the active volume reduced to 5.5 ft to account for<br />
sludge accumulation) will be 7 feet deep<br />
• The secondary cells will be 8 ft deep,<br />
• The treatment system will provide 85% BOD removal,<br />
• The lagoon is modeled as a Plug flow reactor with a dispersion constant equation <strong>of</strong> one,<br />
• The lagoon is modeled using the Wherner–Wilhelm equation with a first order reaction rate<br />
for the facultative lagoon system (k20) at 0. 15 -day1,<br />
• The plug flow reaction rate constant will vary with flow1,<br />
• The minimum lagoon temperature will be 10.5 degrees C.<br />
Table 5.1<br />
Alternative 1<br />
Primary <strong>Treatment</strong> at WWTP NO<br />
Type <strong>of</strong> <strong>Treatment</strong> Facultative Lagoon<br />
Area Depth<br />
28<br />
Volum<br />
e<br />
Detention<br />
Time<br />
Remova<br />
l<br />
Acre<br />
s ft. MG days Percent<br />
Primary Lagoons 40 7 1 66.25 25 64%<br />
Secondary Lagoons 31 8 79.5 30 76%<br />
Overall Performance 92%<br />
Potential Impacts to natural wetlands 30<br />
1. Actual process water depth is calculated at 5.5 feet, accounting for sludge accumulation.<br />
The layout shown in Figure 5.1 is the preferred configuration for providing the required BOD<br />
removal. The two celled primary lagoon promotes plug flow and the area <strong>of</strong> 43 acre-ft includes
\\<strong>Coos</strong>bay\projects\2009\609031-CBGeoGenSvc\115-N-<strong>Spit</strong>-WW-Trtmtnt-Site\Figs , SAVED: 5/18/2010 11:28 AM WWHITE , PLOTTED: 5/19/2010 11:52 AM , WALTER WHITE<br />
Consulting Engineers<br />
& Geologists, Inc.<br />
City <strong>of</strong> <strong>Coos</strong> <strong>Bay</strong><br />
<strong>Wastewater</strong> <strong>Treatment</strong> <strong>Plant</strong><br />
<strong>Coos</strong> <strong>Bay</strong>, <strong>Oregon</strong><br />
May 2010 609031-115-FIG-5-x_Alternatives<br />
Facultative Lagoon System<br />
Alternate #1<br />
Figure 5.1
additional capacity for future industrial discharges on the north spit which has not been taken into<br />
account in the loading projections for <strong>Plant</strong> 2. Alternative 1 requires no additional energy to<br />
accomplish the desired level <strong>of</strong> treatment.<br />
Advantages<br />
• Natural process<br />
• Low complexity and operational cost<br />
• No additional power cost<br />
• Parallel primary cells provide reliability and operational flexibility<br />
Disadvantages<br />
• Large footprint<br />
• Wetlands impact and potential mitigation requirements for approximately 30 acres<br />
5.1.2 Alternative 2 - Facultative System with Primary <strong>Treatment</strong><br />
Alternative 2 assumes that preliminary and primary treatment will occur at the existing <strong>Plant</strong> 2 site<br />
with secondary treatment occurring at the <strong>North</strong> <strong>Spit</strong> site. The analysis <strong>of</strong> performance is based on<br />
the assumption that primary treatment at <strong>Plant</strong> 2 would provide 25 percent removal <strong>of</strong> BOD and 40<br />
percent removal <strong>of</strong> total suspended solids (TSS).<br />
Based on a BOD loading <strong>of</strong> 1,990 ppd (80% <strong>of</strong> the maximum month loading <strong>of</strong> 2,485 ppd) and an<br />
areal loading rate <strong>of</strong> 35 lbs/acre-day, the area required for the facultative lagoon systems would be<br />
reduced to 53 acres. The Wherner -Wilhelm equation predicts that an additional detention time <strong>of</strong><br />
45 days will be required in the secondary system to achieve an overall removal rate <strong>of</strong> 85% or<br />
better. Expected performance for the system proposed in Alternative 2 is summarized in Table 5.2.<br />
Primary <strong>Treatment</strong> at WWTP<br />
Table 5.2<br />
Alternative 2<br />
YES<br />
Type <strong>of</strong> <strong>Treatment</strong> Facultative Lagoon<br />
Area Depth Volume Detention Time Removal<br />
Acres ft. MG days Percent<br />
Primary Lagoons 22 71 37 14 51%<br />
Secondary Lagoons 31 8 79.5 30 52%<br />
Overall Performance 89%<br />
Potential Impacts to natural wetlands 12<br />
1. Actual process water depth is calculated at 5.5 feet, accounting for sludge accumulation<br />
30
\\<strong>Coos</strong>bay\projects\2009\609031-CBGeoGenSvc\115-N-<strong>Spit</strong>-WW-Trtmtnt-Site\Figs , SAVED: 5/18/2010 11:28 AM WWHITE , PLOTTED: 5/19/2010 11:53 AM , WALTER WHITE<br />
Consulting Engineers<br />
& Geologists, Inc.<br />
City <strong>of</strong> <strong>Coos</strong> <strong>Bay</strong><br />
<strong>Wastewater</strong> <strong>Treatment</strong> <strong>Plant</strong><br />
<strong>Coos</strong> <strong>Bay</strong>, <strong>Oregon</strong><br />
May 2010 609031-115-FIG-5-x_Alternatives<br />
N<br />
Facultative Lagoon System<br />
Primary <strong>Treatment</strong> <strong>Plant</strong> 2<br />
Alternate #2<br />
Figure<br />
5.2
Advantages<br />
• Natural process<br />
• Low complexity and operational cost<br />
• No additional power cost<br />
• Smaller footprint than Alternative 1<br />
• Parallel primary cells provide reliability and operational flexibility<br />
Disadvantages<br />
• Requires primary treatment and re-pumping at WWTP 2 at significant increased cost<br />
• Wetlands impact and potential mitigation requirements for approximately 12 acres<br />
5.1.3 Alternative 3 - Facultative System with Supplemental Aeration<br />
In lagoon systems with supplemental aeration, the size <strong>of</strong> the facility is not based on areal loading<br />
rates, but rather, on the detention time. In addition, the supplemental aeration system needs be<br />
sized to provide sufficient air for oxidation <strong>of</strong> BOD and mixing.<br />
Based on the reaction rate assumed for facultative pond systems, the Wherner-Wilhelm equation<br />
predicts that an 85% reduction in BOD will require a detention time <strong>of</strong> 55 days. With supplemental<br />
aeration this detention time can be provided in a smaller footprint by increasing the depth <strong>of</strong> the<br />
lagoon system. Ten feet is considered maximum for a facultative system 1 and was used to estimate<br />
the minimum area requirements for a facultative lagoon system with supplemental aeration.<br />
If the depth <strong>of</strong> both primary and secondary ponds were increased to 10 ft., the required detention<br />
time could be provided with a primary lagoon having a water surface area <strong>of</strong> approximately 15<br />
acres. If only the primary cells are provided with aeration and the average depth increased to 10 ft.,<br />
the required area <strong>of</strong> the primary lagoons will be reduced to a total <strong>of</strong> 32 acres. That scenario is<br />
presented in Table 5.3.<br />
Table 5.3<br />
Alternative 3<br />
Primary <strong>Treatment</strong> at WWTP NO<br />
Type <strong>of</strong> <strong>Treatment</strong> Facultative Lagoon with Supplemental Aeration<br />
Area Depth Volume Detention Time Removal<br />
Acres ft. MG days Percent<br />
Primary Lagoons 32 101 66.25 25 68%<br />
Secondary Lagoons 31 8 79.5 30 52%<br />
Overall Performance 85%<br />
Potential Impacts to Wetlands 22<br />
1. Actual process water depth is calculated at 8.5 feet, accounting for sludge accumulation<br />
32
\\<strong>Coos</strong>bay\projects\2009\609031-CBGeoGenSvc\115-N-<strong>Spit</strong>-WW-Trtmtnt-Site\Figs , SAVED: 5/18/2010 11:28 AM WWHITE , PLOTTED: 5/19/2010 11:55 AM , WALTER WHITE<br />
Consulting Engineers<br />
& Geologists, Inc.<br />
City <strong>of</strong> <strong>Coos</strong> <strong>Bay</strong><br />
<strong>Wastewater</strong> <strong>Treatment</strong> <strong>Plant</strong><br />
<strong>Coos</strong> <strong>Bay</strong>, <strong>Oregon</strong><br />
May 2010 609031-115-FIG-5-x_Alternatives<br />
N<br />
Facultative Lagoon System<br />
(with Supplemental Aeration)<br />
Alternate #3<br />
Figure<br />
5.3
Aeration Requirements<br />
Aeration requirements for both facultative systems with supplement aeration are generally based<br />
on oxidation <strong>of</strong> influent BOD. Based on a projected maximum month BOD load, aeration<br />
requirements for oxidation are estimated to be 105 to 130 HP depending on the efficiency <strong>of</strong> the<br />
aerator.<br />
Advantages<br />
• Smaller footprint than Alternative 1<br />
• Parallel primary cells provide reliability and operational flexibility<br />
Disadvantages<br />
• Aerators add operational complexity and maintenance requirements<br />
• Additional power costs (130 HP)<br />
5.1.4 Alternative 4 - Aerated Partial Mix / Facultative System , Existing Basin<br />
In a partially mixed aerated pond, aerators are used to transfer oxygen to the liquid to maintain<br />
aerobic conditions in the ponds. Oxygen requirements are based on the BOD to be oxidized and<br />
are reduced from one cell to the next as the wastewater flows through the system. Reaction rates<br />
for aerobic pond systems are greater than that for facultative ponds and therefore, the required<br />
detention times are greatly reduced.<br />
The reaction rates assumed for aerated partially mixed systems assume complete oxygen<br />
dispersion. In practice, zones <strong>of</strong> complete oxygen dispersion vary depending on the type <strong>of</strong><br />
aerator. It is generally assumed that, at a minimum 5 to 10 HP / MG is required for a partially<br />
mixed lagoon system.<br />
Performance<br />
It is estimated that the existing lagoon can provide approximately 30 days <strong>of</strong> detention time at the<br />
projected maximum month flows in 2030. Because it is not feasible to aerate the entire lagoon at a<br />
level that will maintain partial mixing, the lagoon will need to be divided into multiple cells to<br />
improve mixing characteristics.<br />
One possible configuration, shown in Figure 5.4, provides three cells, each with 10 days <strong>of</strong><br />
detention time. Aeration is provided in Cell 1 only (total 132 HP is assumed) which should provide<br />
partial mixing but still allow for settling <strong>of</strong> solids. Based on a more conservative reaction rate in cell<br />
1 (considering the reduced rate <strong>of</strong> mixing) and reaction rates in Cell 2 and Cell 3 (based on<br />
facultative systems), the existing ASB configuration should provide the required 85% removal <strong>of</strong><br />
BOD.<br />
34
\\<strong>Coos</strong>bay\projects\2009\609031-CBGeoGenSvc\115-N-<strong>Spit</strong>-WW-Trtmtnt-Site\Figs , SAVED: 5/18/2010 11:28 AM WWHITE , PLOTTED: 5/19/2010 11:57 AM , WALTER WHITE<br />
Consulting Engineers<br />
& Geologists, Inc.<br />
City <strong>of</strong> <strong>Coos</strong> <strong>Bay</strong><br />
<strong>Wastewater</strong> <strong>Treatment</strong> <strong>Plant</strong><br />
<strong>Coos</strong> <strong>Bay</strong>, <strong>Oregon</strong><br />
May 2010 609031-115-FIG-5-x_Alternatives<br />
N<br />
Aerated Lagoon System<br />
(Partially Mixed)<br />
Alternate #4<br />
Figure<br />
5.4
• Cell 1: kpm= 0.25-day kpm(w) = 0.14-day<br />
• Cells 2, and 3, : kf = 0.066 -day<br />
Table 5.4<br />
Alternative 4<br />
Primary <strong>Treatment</strong> at WWTP NO<br />
Type <strong>of</strong> <strong>Treatment</strong> Aerated Lagoon/Partial Mix (132 Hp)<br />
Area Depth Volume Detention Time Removal<br />
Acres ft. MG days Percent<br />
Secondary Lagoons 31 8 79.5 30 85%<br />
Overall Performance 85%<br />
Potential Impacts to Wetlands 0<br />
Advantages<br />
• No wetlands impact<br />
• Small footprint<br />
Disadvantages<br />
• First cell <strong>of</strong> ASB acts as primary,<br />
• Lacks redundancy <strong>of</strong> parallel trains,<br />
• Aerators add additional operational complexity and maintenance requirements,<br />
• Annual power costs for 130 HP.<br />
5.1.5 Alternative 5 - Aerated Partial Mix / Facultative System , Primary Cells<br />
The design criteria for partially mixed lagoon systems, discussed in the previous section, were<br />
applied to a system with two parallel primary cells, (Figure 5.5). The addition <strong>of</strong> the primary cells<br />
allows for greater operational flexibility in terms <strong>of</strong> sludge collection and removal, and the<br />
increased detention time increases performance reliability as summarized in Table 5.5. Aeration<br />
requirements are estimated to be 90 HP reflecting lower mixing energy requirements when<br />
compared to Alternative 1.<br />
36
\\<strong>Coos</strong>bay\projects\2009\609031-CBGeoGenSvc\115-N-<strong>Spit</strong>-WW-Trtmtnt-Site\Figs , SAVED: 5/19/2010 11:45 AM WWHITE , PLOTTED: 5/19/2010 11:47 AM , WALTER WHITE<br />
Consulting Engineers<br />
& Geologists, Inc.<br />
City <strong>of</strong> <strong>Coos</strong> <strong>Bay</strong><br />
<strong>Wastewater</strong> <strong>Treatment</strong> <strong>Plant</strong><br />
<strong>Coos</strong> <strong>Bay</strong>, <strong>Oregon</strong><br />
May 2010 609031-115-FIG-Alt5-Fig5_5<br />
N<br />
Aerated Lagoon System<br />
Primary <strong>Treatment</strong> <strong>Plant</strong> 2<br />
Alternate #5<br />
Figure<br />
5.5
Table 5.5<br />
Alternative 5<br />
Primary <strong>Treatment</strong> at WWTP NO<br />
Type <strong>of</strong> <strong>Treatment</strong> Facultative Lagoon With Supplemental Aeration<br />
Area Depth Volume Detention Time Removal<br />
Acres ft. MG days Percent<br />
Primary Lagoons 9.7 10 1 19.9 7.5 65%<br />
Secondary Lagoons 31 8 79.5 30 66%<br />
Overall Performance 88%<br />
Potential Impacts to wetlands 0<br />
1. Water depth 5.5 to account for sludge accumulation<br />
Advantages<br />
• No wetlands impact<br />
• Small footprint<br />
• Primary cells provide reliability and operational flexibility<br />
Disadvantages<br />
• Aerators add additional operational complexity and maintenance requirements<br />
• Power cost (90 HP)<br />
5.1.6 Preferred Alternative<br />
Selection <strong>of</strong> the preferred secondary treatment alternative was based on consideration <strong>of</strong> potential<br />
impacts to wetlands, constructability, capital cost, and annual operations and maintenance costs.<br />
The facultative lagoon system Alternative 1, and the partially mixed aerated lagoon systems,<br />
Alternatives 4 and 5 are feasible alternatives; however, Alternate 1 may have unacceptable costs<br />
due to potential impacts to wetlands.<br />
Costs for the three alternatives are presented in Tables 5.6, 5.7, and 5.8. The facultative lagoon<br />
system covers a larger area and costs more to construct but if annual power cost is included in the<br />
cost comparison the facultative lagoon system, excluding the estimated cost <strong>of</strong> wetlands mitigation<br />
is comparable to the two aerated alternatives.<br />
38
Table 5.6, <strong>Treatment</strong> Alternative 1 Cost Estimate<br />
<strong>Treatment</strong> (Secondary Alternative #1)<br />
Item No. Description Units Quantity Unit Cost Total Cost<br />
1 Bonds, Insurance, Mobilization & Permits (15%) ls all $420,348.00 $420,348.00<br />
2 Primary Berms cy 107,230<br />
$6.00 $643,380.00<br />
3 Primary Lagoon Liner sf 1,742,400<br />
$0.60 $1,045,440.00<br />
4 Secondary Lagoon Liner sf 1,530,000<br />
$0.60 $918,000.00<br />
5 Yard Piping ls all $50,000.00 $50,000.00<br />
6 Fencing lf 3,900 $20.00 $78,000.00<br />
7 Secondary Baffle ls all $67,500.00 $67,500.00<br />
Construction Total $3,222,668.00<br />
Contingency (15%) $483,400.20<br />
Engineering (18%) $580,080.24<br />
Administrative costs (3%) $96,680.04<br />
Wetlands Delineation $60,000.00<br />
Secondary Sludge Survey $60,000.00<br />
Remove Sludge $3,000,000.00<br />
Total Project Costs $7,502,828.48<br />
Table 5.7, <strong>Treatment</strong> Alternative 4 Cost Estimate<br />
<strong>Treatment</strong> (Secondary Alternative #1)<br />
Item No. Description Units Quantity Unit Cost Total Cost<br />
1 Bonds, Insurance, Mobilization & Permits (15%) ls all $420,348.00 $420,348.00<br />
2 Primary Berms cy 107,230<br />
$6.00 $643,380.00<br />
3 Primary Lagoon Liner sf 1,742,400<br />
$0.60 $1,045,440.00<br />
4 Secondary Lagoon Liner sf 1,530,000<br />
$0.60 $918,000.00<br />
5 Yard Piping ls all $50,000.00 $50,000.00<br />
6 Fencing lf 3,900 $20.00 $78,000.00<br />
7 Secondary Baffle ls all $67,500.00 $67,500.00<br />
Construction Total $3,222,668.00<br />
Contingency (15%) $483,400.20<br />
Engineering (18%) $580,080.24<br />
Administrative costs (3%) $96,680.04<br />
Wetlands Delineation $60,000.00<br />
Secondary Sludge Survey $60,000.00<br />
Remove Sludge $3,000,000.00<br />
Total Project Costs $7,502,828.48<br />
39
Table 5.8, <strong>Treatment</strong> Alternative 5 Cost Estimate<br />
<strong>Treatment</strong> (Secondary Alternative #5)<br />
Item No. Description Units Quantity Unit Cost Total Cost<br />
1 Bonds, Insurance, Mobilization & Permits (15%) ls all $375,423.30 $375,423.30<br />
2 Primary Berms cy 68,933<br />
3 Primary Lagoon Liner sf 392,040<br />
4 Secondary Lagoon Liner sf 1,530,000<br />
40<br />
$6.00 $413,598.00<br />
$0.60 $235,224.00<br />
$0.60 $918,000.00<br />
5 Aerators ls all $180,000.00 $180,000.00<br />
6 Install ls all $90,000.00 $90,000.00<br />
7 Electrical ls all $90,000.00 $90,000.00<br />
8 Baffles ls all $150,000.00 $150,000.00<br />
9 Fencing lf 6,000<br />
10 Secondary Effluent lf 1,700<br />
$20.00 $120,000.00<br />
$180.00 $306,000.00<br />
Construction Total $2,878,245.30<br />
Contingency (15%) $431,736.80<br />
Engineering (18%) $518,084.15<br />
Administrative costs (3%) $86,347.36<br />
Wetlands Delineation $60,000.00<br />
Secondary Sludge Survey $60,000.00<br />
Remove Sludge $3,000,000.00<br />
Total Project Costs $7,034,413.61<br />
All alternatives include an estimate <strong>of</strong> cost for removal <strong>of</strong> sludge in the existing stabilization. In a<br />
sludge survey conducted by in 1993 as part <strong>of</strong> the “Closure Plan for the <strong>Wastewater</strong> <strong>Treatment</strong><br />
Impoundments,” the average sludge depth in the pond was 3.8 ft., which translates into an<br />
estimated volume <strong>of</strong> 40 million gallons (MG) or, assuming 6 percent concentration in the basin,<br />
approximately 10,000 dry tons <strong>of</strong> biosolids.<br />
Since 1993 Weyerhaeuser’s wastewater discharge to the stabilization basin decreased and in 2003<br />
ceased all together. The volume <strong>of</strong> biosolids in the basin has probably been reduced since the last<br />
inventory because anaerobic digestion and solids wash-out would tend to reduce the volume <strong>of</strong><br />
bio-solids. It is recommended that a solids survey be conducted to verify the actual biosolids<br />
inventory. Without this information, a $3 million placeholder has been included in the cost<br />
estimates to account for the potential <strong>of</strong> harvesting Biosolids. A sludge survey would allow a more<br />
accurate assessment <strong>of</strong> costs for this item.<br />
Wetlands Impact<br />
Alternative 1 has the potential to impact areas that may be considered jurisdictional wetlands by<br />
the Division <strong>of</strong> State Lands (DSL). It would be difficult to obtain the permits required for<br />
construction <strong>of</strong> the primary lagoons or enhancement wetlands without significant mitigation.<br />
Alternatives 4 and 5 both provide required secondary treatment without significantly impacting<br />
wetlands and are considered preferable to Alternative 1 for this reason. Discussions with DSL are<br />
needed to confirm the preferred alternative.
Selection <strong>of</strong> Preferred Option<br />
Based on considerations <strong>of</strong> operational flexibility and reliability, Alternative 5 is considered the<br />
preferred alternative even though the project cost was estimated to be higher than Alternative 4.<br />
Alternative 5 has the following advantages:<br />
• Parallel primary lagoons (one side can be taken <strong>of</strong>f line for sludge removal and<br />
maintenance)<br />
• Power requirements are less for Alternative 5<br />
• Higher degree <strong>of</strong> reliability<br />
• Excess capacity to handle additional loadings for future <strong>North</strong> <strong>Spit</strong> industries<br />
The basis <strong>of</strong> selecting the preferred alternative is summarized in the evaluation matrix presented in<br />
Table 5.9. Rankings accorded on a scale <strong>of</strong> 1-5 with 5 being more positive.<br />
Table 5.9<br />
Evaluation Matrix for Selection <strong>of</strong> Preferred Alternative<br />
Power Impact to<br />
Alts. Cost Usage Wetlands1 Operation Operation<br />
Complexity Flexibility2 Rank<br />
1 Facultative System<br />
Facultative System<br />
2 5 1 5 1 14<br />
2 Primary WWTP #2<br />
Facultative System<br />
1 5 3 3 - 12<br />
3 Supplemental Air<br />
Partial Mix /Facultative<br />
3 1 2 4 1 11<br />
4 In Existing Basin<br />
Partial Mix /Facultative<br />
5 1 5 4 - 15<br />
5 With Primary Cells 4 2 5 4 1 16<br />
1. Verify with DSL.<br />
2. Operational flexibility provided by parallel primary trains<br />
5.1.7 Biosolids Management<br />
The primary cells in the combined aerated / facultative process selected as the preferred alternative<br />
will be partially mixed. Air is provided at a low intensity that allows for settling <strong>of</strong> solids throughout<br />
the basin. It is recommended that an area <strong>of</strong> increased depth be provided in the influent<br />
portion <strong>of</strong> the ponds to allow solids to accumulate. A few acre portion <strong>of</strong> each pond would be<br />
increased in depth to 12 ft.<br />
Biosolids Volume<br />
Solids accumulation over time was estimated based on yield factor for sludge yield per pound <strong>of</strong><br />
BOD applied. Due to endogenous respiration the solids generated per pound <strong>of</strong> BOD are<br />
significantly less than typical activated sludge process. Yield estimates <strong>of</strong> 0.5 pound <strong>of</strong> biosolids<br />
41
produced per pound <strong>of</strong> BOD applied are considered appropriate. 9 Projected BOD loading at <strong>Plant</strong><br />
#2 in 2030 is 2,245 l/day10. Based on a yield factor <strong>of</strong> 0.5 solids will accumulate at a rate <strong>of</strong> 204 tons<br />
per year.<br />
Based on BOD removal rates, a percent <strong>of</strong> the solids or 132 tons will be removedin the primary<br />
cells. If the settled solids are assumed to have a concentraton <strong>of</strong> 6% there will be an accumulation <strong>of</strong><br />
1.5 acre ft in the primary cells per year or based on the 9 acre area approximately 0.18 ft per year.<br />
The volume <strong>of</strong> biosolids generated facultative processes in the secondary lagoon and the suspended<br />
solids that are carried over from the primary accumulate will accumulate in the secondary ponds at<br />
a rate <strong>of</strong> 71.4 tons per year. If the settled solids are assumed to have a concentraton <strong>of</strong> 6% there will<br />
be an accumulation <strong>of</strong> 0.90 acre ft in the secondary cells per year or, based on 30 acres, 0.03 ft per<br />
year.<br />
Management Plan<br />
Biosolids removal from the primary cells should be taken into account in evaluating the combined<br />
Aerated /Facultative Lagoon System. Biosolids should be removed every 10-15 years. Cost<br />
estimates for dredging and hauling the biosolids were based on an estimated 300.00 per dry ton for<br />
dredging and hauling, an annual cost <strong>of</strong> approximately 40,000 per year. The annual costs are based<br />
on using the City’s permitted land application sites.<br />
5.1.8 Expected Performance (Nitrogen Removal)<br />
Nitrogen removal in facultative lagoon systems is positively correlated with temperature, pH, and<br />
detention time. Nitrogen removal is believed to occur according to the following processes:<br />
• Gaseous ammonia stripping to atmosphere<br />
• Ammonia assimilation in algal biomass<br />
• Nitrate assimilation in algae<br />
• Biological nitrification-denitrification<br />
There are several empirically derived models that predict total nitrogen removal in lagoon systems<br />
Volatilization <strong>of</strong> ammonia is considered the major pathway for nitrogen removal and is the basis<br />
for development <strong>of</strong> these models. Volatilization is highly dependent upon pH and alkalinity. In<br />
general, higher pH and alkalinity levels promote more volatilization <strong>of</strong> ammonia.<br />
Based on a detention time <strong>of</strong> 37 days at the maximum month wet weather flow (MMWWF) <strong>of</strong> 2.65<br />
MGD and an assumed alkalinity <strong>of</strong> 100 mg/l (pH 7.67), ammonia removal in the aerated lagoon<br />
system was calculated to be 36 percent. Based on the projected (2030) maximum month ammonia<br />
nitrogen (NH3-N) loading <strong>of</strong> 408 ppd (2009, EEE), the NH-3 influent concentration during<br />
MMWWF would be approximately 19 mg/l and with an anticipated effluent concentration <strong>of</strong> 12<br />
mg/l.<br />
9 2005, “National Manual <strong>of</strong> Good Practice for Biosolids”, The National Biosolids Partnership<br />
10 “Technical Memo EE2”<br />
42
Nitrogen removal is affected by detention time. At the projected Average Dry Weather Flow<br />
(ADWF) <strong>of</strong> 1 MGD and a detention time <strong>of</strong> 91 days; predicted nitrogen removal increases to 50<br />
percent. At ADWF the maximum month NH3-N loading would result in influent NH-3<br />
concentrations <strong>of</strong> 49 mg/l and effluent concentration <strong>of</strong> 25 mg/l.<br />
5.2 Enhanced <strong>Treatment</strong> Wetlands<br />
Preliminary assessment <strong>of</strong> treatment options included enhanced treatment wetlands. Wetlands are<br />
effective in treating biological oxygen demand, suspended solids nitrogen and phosphorous, as<br />
well as removing metals, organics, and pathogens. In addition wetlands provide filtering and<br />
adsorption mechanism for the removal <strong>of</strong> constituents such as pharmaceuticals that are present in<br />
wastewater in low concentrations making removal by other means difficult.<br />
Constructed free-water surface wetlands are planted with alternating cells <strong>of</strong> emergent herbaceous<br />
wetlands plants such as bulrush and free-water surface zones with submerged aquatic vegetation<br />
rooted to the bottom, such as Potamogeton or pondweed. The open water surface areas are<br />
designed to promote nitrification <strong>of</strong> ammonia to nitrate which is denitrified in the more densely<br />
emergent vegetated cells.<br />
In discussions with the Division <strong>of</strong> State Lands (DSL) it was stated that constructed wetlands for<br />
wastewater treatment would not be considered equivalent to natural wetlands. Therefore the<br />
enhanced treatment wetlands originally considered would be difficult to construct and are not<br />
recommended as part <strong>of</strong> the facility.<br />
43
6.0 Disinfection Alternatives<br />
DEQ requires that effluent be disinfected, after treatment, equivalent to thorough mixing with<br />
sufficient chlorine to provide a residual <strong>of</strong> at least 1 part per million after 60 minutes <strong>of</strong> contact<br />
time. The existing stabilization basin and outfall does not include a disinfection system.<br />
6.1 Method Alternatives<br />
Two primary alternatives have been considered to meet the DEQ requirements.<br />
6.1.1 Ultraviolet<br />
In a typical lagoon treatment system, the ultraviolet transmissivity <strong>of</strong> the effluent is poor enough to<br />
render ultraviolet disinfection impractical. DEQ has recently reviewed a system which is capable <strong>of</strong><br />
treating low transmissivity effluent, however at this time the system does not have the capacity to<br />
treat the magnitude <strong>of</strong> flows expected at WWTP #2. However, should the north spit be a viable<br />
option <strong>of</strong> treatment, further investigation should be done to review this methodology and<br />
determine if the technology will allow for a larger scale use.<br />
6.1.2 Sodium Hypochlorite<br />
In order to avoid the hazards associated with use and storage <strong>of</strong> gaseous chlorine, a sodium<br />
hypochlorite injection system is recommended between the northwest corner <strong>of</strong> the secondary<br />
lagoon and the outfall pump station. Based on the Washington State Department <strong>of</strong> Ecology<br />
Criteria for Sewage Works Design, the dosage range <strong>of</strong> primary effluent is from 5 to 10 mg/L <strong>of</strong><br />
chlorine for appropriate disinfection. A chlorine contact chamber will be sized to allow a contact<br />
time sufficient to meet the effluent requirements discussed in Table 2.2.<br />
To meet these requirements a chlorine contact chamber 10’ wide by 10’ tall by 500’ long must be<br />
constructed. A serpentine configuration results in a chamber 10’ high by 50’ wide by 100’ long. The<br />
estimated costs associated with disinfection are summarized below in table 6.1.2.<br />
Table 6.1.2, Disinfection Cost Estimate<br />
DISINFECTION<br />
1 Potable water to site (2" HDPE) lf 1500 $15.00 $22,500.00<br />
2 Chlorine Monitor ls 1 $4,000.00 $4,000.00<br />
3 Chlorine contact chamber cy 450 $800.00 $360,000.00<br />
4 Injector pump & mixer ls 1 $100,000.00 $100,000.00<br />
5 Housing sf 425 $250.00 $106,250.00<br />
6 Disinfection pump ls 1 $50,000.00 $50,000.00<br />
7 Mag meter ls 1 $35,000.00 $35,000.00<br />
8 Electrical ls 1 $5,000.00 $5,000.00<br />
Construction Total $682,750.00<br />
Contingency (15%) $102,412.50<br />
Engineering (18%) $122,895.00<br />
Administrative costs (3%) $20,482.50<br />
Total Project Costs $928,540.00<br />
44
7.0 Evaluation <strong>of</strong> Existing Outfall<br />
One <strong>of</strong> the advantages <strong>of</strong> the proposed <strong>North</strong> <strong>Spit</strong> treatment facility is the potential to utilize the<br />
existing ocean outfall for effluent disposal. The existing outfall system consists <strong>of</strong> an effluent pump<br />
station and a 30 inch diameter concrete coated, epoxy lined, steel pipe extending approximately<br />
4,500 ft <strong>of</strong>f-shore to a depth <strong>of</strong> approximately 60 ft MLLW. At the terminus <strong>of</strong> the outfall pipe, a<br />
bifurcated diffuser was installed creating a “Y” configuration. Each branch <strong>of</strong> the diffuser contains<br />
16 three inch discharge ports which are equipped with a flapper style check valve. It is proposed<br />
that this outfall system be used for the discharge <strong>of</strong> treated wastewater from the <strong>North</strong> <strong>Spit</strong><br />
treatment system with only minor modification. Based on a preliminary review <strong>of</strong> the existing<br />
outfall capacity, a new effluent pump station will be required.<br />
7.1.1 Description<br />
Constructed in 1972, the existing outfall and effluent pump station were originally designed to<br />
allow discharge <strong>of</strong> treated wastewater by gravity or pumping. Under gravity flow, wastewater is<br />
allowed to flow through the effluent pump station wetwell and overflow into the 30-inch outfall<br />
pipe. With this mode <strong>of</strong> operation, the outfall has an estimated capacity <strong>of</strong> 3 MGD. For flow<br />
greater than 3 MGD it is necessary to pump effluent through the outfall pipe and an effluent pump<br />
station was installed for this purpose. This pump station was originally equipped with a large<br />
vertical turbine pump that discharges through a 12-inch header pipe back into the 30-inch outfall<br />
line downstream <strong>of</strong> the pump station. During pumping, the gravity line is isolated from the pump<br />
discharge by closing an overflow gate. Pumping equipment has since been removed from the<br />
existing facility, although replacement equipment should be easily retr<strong>of</strong>it into the existing wetwell<br />
structure with any future upgrade.<br />
When Weyerhaeuser constructed the ASB, an 18-inch discharge line was installed from the<br />
northwest corner <strong>of</strong> the ASB basin to a manhole upstream <strong>of</strong> the effluent pump station wet-well.<br />
The manhole was equipped with a parshal flume for flow monitoring prior to discharge. The<br />
existing flow metering equipment appears to be functioning, although new level measuring<br />
equipment should be provided.<br />
Currently the outfall remains operational and flows delivered to the ASB from Weyerhaeuser’s<br />
leachate collection system are discharged by gravity to the Pacific Ocean. Existing flows discharged<br />
from the stabilization basin average 0.5 MGD. During the dry season the discharge is<br />
supplemented by pumping ground water (purchased from the <strong>Coos</strong> <strong>Bay</strong> <strong>North</strong> Bend Water Board)<br />
through the system. Ground water is discharged through the system to maintain minimum flow<br />
through the diffusers in an effort to keep the ports operational and sand from inundating the<br />
diffuser ports.<br />
7.1.1 Outfall Capacity Analysis<br />
Preliminary head-loss calculations indicate that the capacity <strong>of</strong> the 18-inch line from the ASB to the<br />
effluent pump station is limiting. If the pipeline from the ASB were upsized to 24 –inches, the<br />
capacity <strong>of</strong> the inlet pipe from the ASB to the effluent pump station would be increased to greater<br />
than 7 MGD. The available head at the effluent pump station would not be sufficient to promote<br />
45
gravity flow beyond an estimated 3 MGD. Further upsizing <strong>of</strong> the outfall line does not appear<br />
practical; therefore, effluent pumping would need to be provided for peak events.<br />
The addition <strong>of</strong> effluent pumping equipment allows discharge from the outfall under all operating<br />
conditions including during ocean storm surge events. Preliminary sizing <strong>of</strong> the required pumping<br />
equipment indicates 10 HP pumps should provide the necessary capacity. Two pumps should be<br />
provided for redundancy. Pumps should operate with VFDs to expand the systems operating<br />
range and to help realize power savings at lower flow conditions (flows above 3 MGD).<br />
7.1.2 Diffusers<br />
At a depth <strong>of</strong> 61.4 feet below mean lower low water (MLLW), the outfall pipe is connected to a<br />
bifurcated “Y” shaped diffuser. From the junction <strong>of</strong> the outfall “Y”, each diffuser arm consists <strong>of</strong> a<br />
252 foot long, 20 –inch diameter pipe equipped with 16 diffuser nozzles, each with 3-inch diameter<br />
ports. Each port is fitted with a flapper style check valve.<br />
The condition <strong>of</strong> the diffusers is periodically assessed by divers. SHN obtained videos from<br />
Weyerhaeuser for review <strong>of</strong> a survey completed in 2005. This survey showed diffusers heavily<br />
encrusted with barnacles and starfish. The ports on the exposed diffuser nozzles were open and<br />
were passing flow. However there was a large section <strong>of</strong> pipe and diffusers, approximately 1/3 <strong>of</strong><br />
the total diffuser length that was covered with sand. Flow or areas <strong>of</strong> bottom disturbance were not<br />
visible from the ports buried in sand.<br />
Replacement <strong>of</strong> the flapper style check valves with nozzle style diffusers (RedValve TM) is<br />
recommended. Nozzles will improve the discharge characteristics, both from an ecological and a<br />
maintenance perspective. Properly sized, nozzles tend to increase the discharge velocity, creating a<br />
jet which improves the initial mixing <strong>of</strong> the discharge with the surrounding water. Within this<br />
immediate zone <strong>of</strong> contact, (referred to as the zone <strong>of</strong> immediate dilution or ZID) dilution and rapid<br />
mixing occurs before the discharge fans out and forms a plume. Constituents causing acute toxicity<br />
concerns (such as ammonia) are permitted within the ZID, as long as the threshold criteria are not<br />
exceeded at the fringe <strong>of</strong> the ZID. Using nozzles to create a discharge jet increases the acceptability<br />
<strong>of</strong> the ZID and the initial dilution <strong>of</strong> toxins. In addition to reducing toxicity concerns, nozzles help<br />
to keep sand away from the diffuser port since the high discharge velocity scours and carries sand<br />
away from the port opening. A model <strong>of</strong> the diffuser should be conducted to verify the benefits <strong>of</strong><br />
a nozzle upgrade and to confirm that toxicity at the fringe <strong>of</strong> the ZID is not a concern.<br />
7.1.3 Effluent Pump Station Upgrade<br />
For the basis <strong>of</strong> this feasibility analysis, it was assumed that the effluent pump station would be<br />
constructed using the existing outfall, wet-well, and flow metering equipment. Two vertical<br />
turbine pumps would be installed in the wetwell similar to the original configuration. Pumping<br />
equipment would be supplied 480 Volt power using the existing power feed supply. New pump<br />
controls, VFDs, and level metering equipment would be installed in the existing control building.<br />
As previously discussed, the section <strong>of</strong> 18-inch line from the ASB to the effluent pump station will<br />
need to be replaced with a 24-inch diameter or larger pipe. Outfall port check valves would also be<br />
replaced with the diffuser nozzles described above.<br />
46
Table 7.1, Outfall Improvements Cost Estimate<br />
Outfall<br />
Item No. Description Units Quantity Unit Cost Total Cost<br />
1 Bonds, Insurance, Mobilization & Permits (15%) ls all $74,850.00 $74,850.00<br />
2 Effluent Pump Station ls all $90,000.00 $90,000.00<br />
3 Replace Diffusers ls all $75,000.00 $75,000.00<br />
4 AC Pavement Patch in <strong>North</strong> <strong>Spit</strong> Pkwy. ls all $10,000.00 $10,000.00<br />
5 Secondary Effluent Pipe lf 1800 $180.00 $324,000.00<br />
47<br />
Construction Total $573,850.00<br />
Contingency (15%) $86,077.50<br />
Engineering (18%) $103,293.00<br />
Administrative costs (3%) $17,215.50<br />
Total Project Costs $780,436.00
8.0 Project Summary<br />
Based on the data gathered and presented in this report, the following is a summary <strong>of</strong> what, in our<br />
opinion, is the most feasible system should the City decide to further pursue the north spit as a<br />
treatment option in lieu <strong>of</strong> upgrading <strong>Wastewater</strong> <strong>Treatment</strong> <strong>Plant</strong> #2.<br />
As calculated below, in Table 8.2.1, the approximate costs for transmission and treatment on the<br />
north spit are $18.7 million, and do not include any potential acquisition costs that may or may not<br />
be necessary.<br />
Preliminary estimates for reconstruction <strong>of</strong> the existing treatment plant are approximately $16.2<br />
million, including land acquisition costs. Potential political hurdles with construction on the<br />
available land include neighborhood concerns regarding odor, noise, and visual nuisances.<br />
Although the calculations were not finalized for this report, it is reasonable to assume that there<br />
would be some O&M cost savings with the north spit option. More information is needed to<br />
determine the exact value and the present worth <strong>of</strong> those savings.<br />
The <strong>North</strong> <strong>Spit</strong> option includes costs for several uncertain issues. The most notable cost item<br />
addresses the responsibility for sludge removal in the ASB. The cost estimate includes a $3 million<br />
placeholder to cover dredge and disposal costs. Additional items need to be resolved including a<br />
determination <strong>of</strong> wetland impacts and whether DEQ will require installation <strong>of</strong> an impermeable<br />
liner for the ASB.<br />
8.1 Layout Summary<br />
The preferred layout consists <strong>of</strong> a new pump station on or near the existing treatment plant site<br />
which would then pump the sewage through an 18” pipe under <strong>Coos</strong> <strong>Bay</strong> and to the north spit<br />
treatment site. <strong>Treatment</strong> on the north spit site would consist <strong>of</strong> an elevated headworks and a<br />
partially mixed lagoon system with two parallel primary treatment cells. Effluent would flow via<br />
gravity into a new chlorine contact chamber and then, with the help <strong>of</strong> a small pump station, be<br />
mixed with the Pacific Ocean at the end <strong>of</strong> the existing outfall. This treatment system has the<br />
flowing advantages when compared to a mechanical plant employing an activated sludge process<br />
and a discharge to <strong>Coos</strong> <strong>Bay</strong>.<br />
• Natural “green system”,<br />
• Low operational complexity, and reduced operation costs,<br />
• Long detention times allowing ammonia and total nitrogen removal,<br />
• Significant reduction <strong>of</strong> biosolids produced (approximately 50 percent <strong>of</strong> what is currently<br />
produced),<br />
• Potential for future expansion through additional aeration,<br />
• Ocean disposal permit conditions, and<br />
48
8.2 Costs<br />
The estimated costs associated with the treatment system described in this report are summarized<br />
in Table 8.2 below:<br />
Table 8.2, Cost Estimate Summary & Total<br />
NORTH SPIT TREATMENT OPTION<br />
1 Pump Station (Single Force Main) Section 4.2.1 $1,455,000.00<br />
2 Forcemain (Single Force Main) Section 4.1.1 $3,554,000.00<br />
3 Headworks Section 3.1 $1,109,000.00<br />
4 <strong>Treatment</strong> (Preferred Secondary Alternative #5) Section 5.1.5 $2,878,000.00<br />
5 Disinfection Section 6.1.2 $683,000.00<br />
6 Backup Power (Pump Station) $129,000.00<br />
7 Backup Power (<strong>Treatment</strong>) $42,000.00<br />
8 Office and Laboratory $440,000.00<br />
9 Outfall Section 7.1.3 $574,000.00<br />
Total Estimated Construction Costs $10,863,000.00<br />
Recommended Contingency (20%) $1,629,000.00<br />
Engineering Budget (15%) $1,955,000.00<br />
Administrative Costs (3%) $326,000.00<br />
Wetlands Deliniation $60,000.00<br />
Secondary Lagoon Sludge Survey $60,000.00<br />
Remove Sludge $3,000,000.00<br />
Specialty Engineering , i.e. Geotech & Environmental (2%) $217,000.00<br />
Total Recommended Project Budget $18,111,000.00<br />
49
9.0 References<br />
Bureau <strong>of</strong> Land Management (2006). “Final <strong>North</strong> <strong>Spit</strong> Plan – An Update to the <strong>Coos</strong> <strong>Bay</strong><br />
Shorelands Plan <strong>of</strong> 1995.” NR: Bureau <strong>of</strong> Land Management.<br />
CH2M Hill (1997). “Weyerhaeuser Demonstration Wetland Monitoring – June 1996 Sampling.”<br />
NR: CH2M Hill.<br />
CH2M Hill (1992). Draft “Ecological Risk Assessment for <strong>Wastewater</strong> Lagoon.” NR: CH2M Hill.<br />
Jones, M.A. (1992). “Groundwater Availability from a Dune-sand Aquifer near <strong>Coos</strong> <strong>Bay</strong> and<br />
<strong>North</strong> Bend, <strong>Oregon</strong>. NR: Jones, M.A.<br />
Robison, J.H. (1973). “Hydrology <strong>of</strong> the Dunes Area <strong>North</strong> <strong>of</strong> <strong>Coos</strong> <strong>Bay</strong>, <strong>Oregon</strong>.” NR: Robison,<br />
J.H.<br />
Sweet-Edwards/EMCON (1990). “Phase III <strong>Wastewater</strong> Lagoon Ground Water Investigation and<br />
Concentration Limit Variance Request.” NR: Sweet-Edwards/EMCON.<br />
U.S. Army Corps <strong>of</strong> Engineers (1981). “<strong>North</strong> <strong>Bay</strong> Marine Industrial Park, <strong>North</strong> <strong>Spit</strong>, <strong>Coos</strong><br />
County, <strong>Oregon</strong>.” NR: U.S. Army Corps <strong>of</strong> Engineers<br />
Weyerhaeuser (1993). “Closure Plan for <strong>Wastewater</strong> <strong>Treatment</strong> impoundments at Weyerhaeuser<br />
Paper Company.” NR: Weyerhaeuser.<br />
Weyerhaeuser (2004). National Pollutant Discharge Elimination System Permit Evaluation and Fact<br />
Sheet. NR: Weyerhaeuser.<br />
Metcalf & Eddy, G. Tchobanoglous, F. L. Burton and H. D. Stensel, <strong>Wastewater</strong> Engineering,<br />
<strong>Treatment</strong> and Reuse, Fourth Edn, McGraw Hill Education, 2003<br />
50
Appendix A<br />
Additional Mapping
COASTAL FLOOD ZONE
LIDAR DATA
ASSESSORS MAP
Appendix B<br />
Solids Data
SLUDGE SAMPLING
SLUDGE INVENTORY
Appendix C<br />
Groundwater Data
SLUDGE INVENTORY
Appendix C<br />
Groundwater Data