
Create successful ePaper yourself
Turn your PDF publications into a flip-book with our unique Google optimized e-Paper software.
4<br />
QCrOps / BArry sALTer<br />
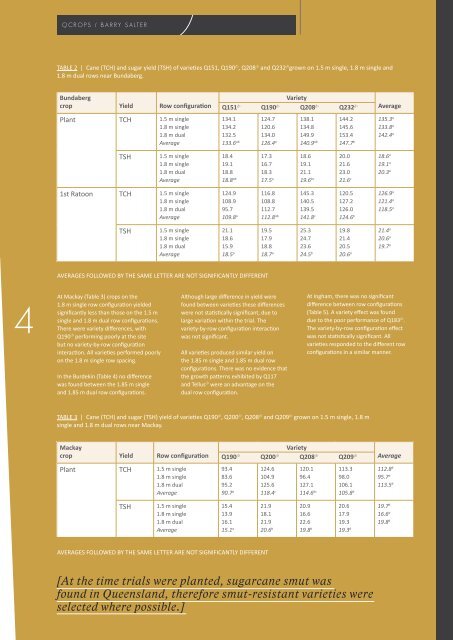
TABlE 2 | Cane (TCH) and sugar yield (TSH) of varieties Q151, Q190 A , Q208 A and Q232 A grown on 1.5 m single, 1.8 m single and<br />
1.8 m dual rows near Bundaberg.<br />
Bundaberg<br />
crop<br />
Yield<br />
AVERAGES fOllOWED BY THE SAME lETTER ARE NOT SIGNIfICANTlY DIffERENT<br />
At Mackay (Table 3) crops on the<br />
1.8 m single row configuration yielded<br />
significantly less than those on the 1.5 m<br />
single and 1.8 m dual row configurations.<br />
There were variety differences, with<br />
Q190 A performing poorly at the site<br />
but no variety-by-row configuration<br />
interaction. All varieties performed poorly<br />
on the 1.8 m single row spacing.<br />
In the Burdekin (Table 4) no difference<br />
was found between the 1.85 m single<br />
and 1.85 m dual row configurations.<br />
Row configuration<br />
Plant TCH 1.5 m single<br />
1.8 m single<br />
1.8 m dual<br />
Average<br />
TSH<br />
1.5 m single<br />
1.8 m single<br />
1.8 m dual<br />
Average<br />
1st Ratoon TCH 1.5 m single<br />
1.8 m single<br />
1.8 m dual<br />
Average<br />
Q151 A<br />
Although large difference in yield were<br />
found between varieties these differences<br />
were not statistically significant, due to<br />
large variation within the trial. The<br />
variety-by-row configuration interaction<br />
was not significant.<br />
All varieties produced similar yield on<br />
the 1.85 m single and 1.85 m dual row<br />
configurations. There was no evidence that<br />
the growth patterns exhibited by Q117<br />
and Tellus A were an advantage on the<br />
dual row configuration.<br />
At Ingham, there was no significant<br />
difference between row configurations<br />
(Table 5). A variety effect was found<br />
due to the poor performance of Q183 A .<br />
The variety-by-row configuration effect<br />
was not statistically significant. All<br />
varieties responded to the different row<br />
configurations in a similar manner.<br />
TABlE 3 | Cane (TCH) and sugar (TSH) yield of varieties Q190 A , Q200 A , Q208 A and Q209 A grown on 1.5 m single, 1.8 m<br />
single and 1.8 m dual rows near Mackay.<br />
Mackay<br />
crop<br />
TSH<br />
Yield<br />
1.5 m single<br />
1.8 m single<br />
1.8 m dual<br />
Average<br />
Row configuration<br />
Plant TCH 1.5 m single<br />
1.8 m single<br />
1.8 m dual<br />
Average<br />
TSH<br />
1.5 m single<br />
1.8 m single<br />
1.8 m dual<br />
Average<br />
134.1<br />
134.2<br />
132.5<br />
133.6 ab<br />
18.4<br />
19.1<br />
18.8<br />
18.8 ab<br />
124.9<br />
108.9<br />
95.7<br />
109.8 a<br />
AVERAGES fOllOWED BY THE SAME lETTER ARE NOT SIGNIfICANTlY DIffERENT<br />
Q190 A<br />
124.7<br />
120.6<br />
134.0<br />
126.4 a<br />
Q208A Variety<br />
138.1<br />
134.8<br />
149.9<br />
140.9 ab<br />
Q232 A<br />
144.2<br />
145.6<br />
153.4<br />
147.7 b<br />
[At the time trials were planted, sugarcane smut was<br />
found in Queensland, therefore smut-resistant varieties were<br />
selected where possible.]<br />
21.1<br />
18.6<br />
15.9<br />
18.5 a<br />
Q190 A<br />
93.4<br />
83.6<br />
95.2<br />
90.7 a<br />
15.4<br />
13.9<br />
16.1<br />
15.1 a<br />
17.3<br />
16.7<br />
18.3<br />
17.5 a<br />
116.8<br />
108.8<br />
112.7<br />
112.8 ab<br />
19.5<br />
17.9<br />
18.8<br />
18.7 a<br />
Q200 A<br />
124.6<br />
104.9<br />
1<strong>25</strong>.6<br />
118.4 c<br />
21.9<br />
18.1<br />
21.9<br />
20.6 b<br />
18.6<br />
19.1<br />
21.1<br />
19.6 bc<br />
145.3<br />
140.5<br />
139.5<br />
141.8 c<br />
<strong>25</strong>.3<br />
24.7<br />
23.6<br />
24.5 b<br />
Q208A Variety<br />
120.1<br />
96.4<br />
127.1<br />
114.6 bc<br />
20.9<br />
16.6<br />
22.6<br />
19.8 b<br />
20.0<br />
21.6<br />
23.0<br />
21.6 c<br />
120.5<br />
127.2<br />
126.0<br />
124.6 b<br />
19.8<br />
21.4<br />
20.5<br />
20.6 a<br />
Q209 A<br />
113.3<br />
98.0<br />
106.1<br />
105.8 b<br />
20.6<br />
17.9<br />
19.3<br />
19.3 b<br />
Average<br />
135.3 a<br />
133.8 a<br />
142.4 a<br />
18.6 a<br />
19.1 a<br />
20.3 a<br />
126.9 a<br />
121.4 a<br />
118.5 a<br />
21.4 a<br />
20.6 a<br />
19.7 a<br />
Average<br />
112.8 b<br />
95.7 a<br />
113.5 b<br />
19.7 b<br />
16.6 a<br />
19.8 b