- Page 1 and 2: SPSS Categories® 11.0 Jacqueline J
- Page 3 and 4: Installation Compatibility Serial N
- Page 5 and 6: Tell Us Your Thoughts Your comments
- Page 7 and 8: Contents 1 Introduction to SPSS Opt
- Page 9 and 10: 6 Homogeneity Analysis (HOMALS) 59
- Page 11 and 12: Example 2: Perceptions of Coffee Br
- Page 13: 1 Introduction to SPSS Optimal Scal
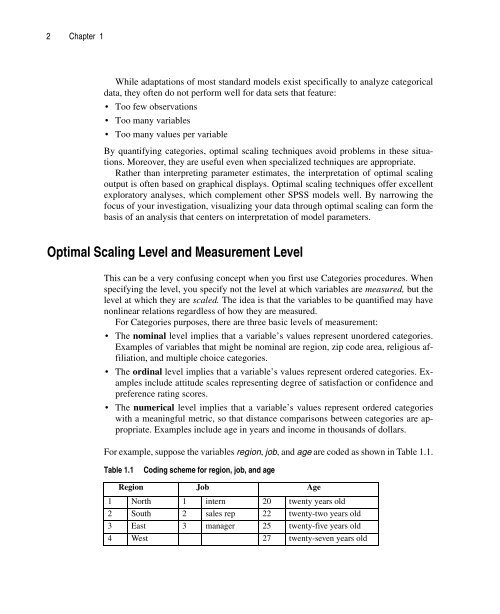
- Page 17 and 18: Category Codes Introduction to SPSS
- Page 19 and 20: Introduction to SPSS Optimal Scalin
- Page 21 and 22: Categorical Principal Components An
- Page 23 and 24: Introduction to SPSS Optimal Scalin
- Page 25 and 26: Introduction to SPSS Optimal Scalin
- Page 27 and 28: Scatterplot Matrices Introduction t
- Page 29 and 30: 1 2 Categorical Regression (CATREG)
- Page 31 and 32: Define Scale in Categorical Regress
- Page 33 and 34: Figure 2.3 Categorical Regression D
- Page 35 and 36: Categorical Regression Options Cate
- Page 37 and 38: Categorical Regression (CATREG) 25
- Page 39 and 40: 3 Categorical Principal Components
- Page 41 and 42: Figure 3.2 Categorical Principal Co
- Page 43 and 44: To Define the Scale and Weight in C
- Page 45 and 46: Categorical Principal Components Mi
- Page 47 and 48: Categorical Principal Components An
- Page 49 and 50: Categorical Principal Components An
- Page 51 and 52: Categorical Principal Components Op
- Page 53 and 54: 4 Nonlinear Canonical Correlation A
- Page 55 and 56: Figure 4.1 Optimal Scaling dialog b
- Page 57 and 58: Nonlinear Canonical Correlation Ana
- Page 59 and 60: Figure 4.5 OVERALS Options dialog b
- Page 61 and 62: 5 Correspondence Analysis One of th
- Page 63 and 64: Select a row variable. Select a col
- Page 65 and 66:
Correspondence Analysis 53 straints
- Page 67 and 68:
Standardization Method. Choose one
- Page 69 and 70:
Correspondence Analysis Plots The P
- Page 71 and 72:
6 Homogeneity Analysis (HOMALS) Hom
- Page 73 and 74:
Figure 6.2 Homogeneity Analysis (HO
- Page 75 and 76:
Homogeneity Analysis Options Homoge
- Page 77 and 78:
7 Multidimensional Scaling (PROXSCA
- Page 79 and 80:
Proximities in Matrices across Colu
- Page 81 and 82:
Proximities in One Column Multidime
- Page 83 and 84:
Measures Dialog Box Figure 7.6 Mult
- Page 85 and 86:
Multidimensional Scaling (PROXSCAL)
- Page 87 and 88:
Multidimensional Scaling Options Mu
- Page 89 and 90:
Multidimensional Scaling (PROXSCAL)
- Page 91 and 92:
Figure 7.12 Multidimensional Scalin
- Page 93 and 94:
8 Categorical Regression Examples T
- Page 95 and 96:
Figure 8.2 Regression coefficients
- Page 97 and 98:
Categorical Regression Examples 85
- Page 99 and 100:
Model Fit and Coefficients Categori
- Page 101 and 102:
Categorical Regression Examples 89
- Page 103 and 104:
Categorical Regression Examples 91
- Page 105 and 106:
Figure 8.14 Residuals for categoric
- Page 107 and 108:
To compute the new variables as sug
- Page 109 and 110:
Figure 8.16 Regression coefficients
- Page 111 and 112:
Figure 8.20 Transformation plot for
- Page 113 and 114:
Figure 8.24 Transformation plot for
- Page 115 and 116:
Categorical Regression Examples 103
- Page 117:
Figure 8.30 Transformation plot for
- Page 120 and 121:
108 Chapter 9 Example 1: Interrelat
- Page 122 and 123:
110 Chapter 9 Number of Dimensions
- Page 124 and 125:
112 Chapter 9 Object Scores Figure
- Page 126 and 127:
114 Chapter 9 Component Loadings pe
- Page 128 and 129:
116 Chapter 9 Figure 9.9 Model summ
- Page 130 and 131:
118 Chapter 9 Figure 9.12 Three-dim
- Page 132 and 133:
120 Chapter 9 To produce categorica
- Page 134 and 135:
122 Chapter 9 Quantifications for S
- Page 136 and 137:
124 Chapter 9 Object Scores which m
- Page 138 and 139:
126 Chapter 9 Table 9.4 Object scor
- Page 140 and 141:
128 Chapter 9 Differential Developm
- Page 142 and 143:
130 Chapter 9 With respect to sexua
- Page 144 and 145:
132 Chapter 10 Examining the Data T
- Page 146 and 147:
134 Chapter 10 Figure 10.1 Object s
- Page 148 and 149:
136 Chapter 10 Figure 10.4 Componen
- Page 150 and 151:
138 Chapter 10 Component Loadings T
- Page 152 and 153:
140 Chapter 10 In contrast, the tra
- Page 154 and 155:
142 Chapter 10 constraint is applie
- Page 156 and 157:
144 Chapter 10 Figure 10.14 Centroi
- Page 158 and 159:
146 Chapter 10 The multiple-fit and
- Page 160 and 161:
148 Chapter 10 Figure 10.20 display
- Page 163 and 164:
11 Correspondence Analysis Examples
- Page 165 and 166:
Correspondence Analysis Examples 15
- Page 167 and 168:
Correspondence Analysis Examples 15
- Page 169 and 170:
Inertia Figure 11.6 Column profiles
- Page 171 and 172:
Dimensionality The Euclidean distan
- Page 173 and 174:
Model... Dimensions in solution: 2
- Page 175 and 176:
Plots... Scatterplots Biplot (dese
- Page 177 and 178:
Figure 11.15 Contributions of dimen
- Page 179 and 180:
Correspondence Analysis Examples 16
- Page 181 and 182:
Correspondence Analysis Examples 16
- Page 183 and 184:
Example 2: Perceptions of Coffee Br
- Page 185 and 186:
Contributions Figure 11.21 Inertia
- Page 187 and 188:
Plots Correspondence Analysis Examp
- Page 189 and 190:
Symmetrical Normalization Correspon
- Page 191 and 192:
Correspondence Analysis Examples 17
- Page 193 and 194:
Figure 11.28 Correspondence table f
- Page 195 and 196:
12 Homogeneity Analysis Examples Th
- Page 197 and 198:
Multiple Dimensions Now, to obtain
- Page 199 and 200:
Homogeneity Analysis Examples 187 T
- Page 201 and 202:
Figure 12.4 Plot of discrimination
- Page 203 and 204:
Figure 12.6 Selected category quant
- Page 205 and 206:
Figure 12.9 Object scores labeled w
- Page 207 and 208:
Figure 12.11 Eigenvalues Dimension
- Page 209 and 210:
13 Multidimensional Scaling Example
- Page 211 and 212:
Figure 13.1 Scree Plot Normalized R
- Page 213 and 214:
Plots... Stress (deselect) Common
- Page 215 and 216:
Final Coordinates of the Common Spa
- Page 217 and 218:
Figure 13.8 Transformed degree and
- Page 219 and 220:
Figure 13.9 Transformed proximities
- Page 221:
Syntax Reference
- Page 224 and 225:
212 Syntax Reference Syntax Rules
- Page 227 and 228:
ANACOR Overview Options ANACOR TABL
- Page 229 and 230:
Casewise Data Table Data ANACOR 217
- Page 231 and 232:
ANACOR 219 column and its correspon
- Page 233 and 234:
MATRIX Subcommand ANACOR 221 • Th
- Page 235:
ANACOR 223 • The table cell value
- Page 238 and 239:
226 Syntax Reference Overview Optio
- Page 240 and 241:
228 Syntax Reference Example CATPCA
- Page 242 and 243:
230 Syntax Reference Level Keyword
- Page 244 and 245:
232 Syntax Reference DISTR Keyword
- Page 246 and 247:
234 Syntax Reference DIMENSION Subc
- Page 248 and 249:
236 Syntax Reference VAF Variance a
- Page 250 and 251:
238 Syntax Reference CATEGORY(varli
- Page 252 and 253:
240 Syntax Reference SAVE Subcomman
- Page 254 and 255:
242 Syntax Reference OUTFILE Subcom
- Page 256 and 257:
244 Syntax Reference Options Basic
- Page 258 and 259:
246 Syntax Reference • VARIABLES
- Page 260 and 261:
248 Syntax Reference SPORD and SPNO
- Page 262 and 263:
250 Syntax Reference SUPPLEMENTARY
- Page 264 and 265:
252 Syntax Reference PLOT Subcomman
- Page 266 and 267:
254 Syntax Reference OUTFILE Subcom
- Page 268 and 269:
256 Syntax Reference Options Basic
- Page 270 and 271:
258 Syntax Reference Table Data Exa
- Page 272 and 273:
260 Syntax Reference EQUAL Subcomma
- Page 274 and 275:
262 Syntax Reference PRINT Subcomma
- Page 276 and 277:
264 Syntax Reference OUTFILE Subcom
- Page 278 and 279:
266 Syntax Reference • The table
- Page 280 and 281:
268 Syntax Reference Writing matric
- Page 282 and 283:
270 Syntax Reference • The maximu
- Page 284 and 285:
272 Syntax Reference The following
- Page 286 and 287:
274 Syntax Reference • A variable
- Page 288 and 289:
276 Syntax Reference Basic Specific
- Page 290 and 291:
278 Syntax Reference SETS Subcomman
- Page 292 and 293:
280 Syntax Reference CONVERGENCE Su
- Page 294 and 295:
282 Syntax Reference SAVE Subcomman
- Page 297 and 298:
PRINCALS Overview Options PRINCALS
- Page 299 and 300:
Example PRINCALS 287 can use COMPUT
- Page 301 and 302:
PRINCALS 289 NUME Numerical. This i
- Page 303 and 304:
DEFAULT QUANT and OBJECT. ALL All a
- Page 305 and 306:
MATRIX Subcommand PRINCALS 293 PRIN
- Page 307 and 308:
PROXSCAL PROXSCAL varlist [/TABLE =
- Page 309 and 310:
PROXSCAL 297 Output. You can produc
- Page 311 and 312:
PROXSCAL 299 sourceid Source identi
- Page 313 and 314:
PROXSCAL 301 • PROXSCAL reads two
- Page 315 and 316:
CONDITION Subcommand PROXSCAL 303 C
- Page 317 and 318:
MODEL Subcommand PROXSCAL 305 MODEL
- Page 319 and 320:
Example PROXSCAL 307 PROXSCAL aunt
- Page 321 and 322:
PROXSCAL 309 STRESS Stress measures
- Page 323 and 324:
PROXSCAL 311 CORRELATIONS Correlati
- Page 325 and 326:
Bibliography Barlow, R. E., D. J. B
- Page 327 and 328:
Bibliography 315 Lebart L., A. Mori
- Page 329 and 330:
Subject Index active row in Corresp
- Page 331 and 332:
importance in Categorical Regressio
- Page 333:
ow scores in Correspondence Analysi
- Page 336 and 337:
324 Syntax Index CENTROID (keyword)
- Page 338 and 339:
326 Syntax Index PROXSCAL command,
- Page 340 and 341:
328 Syntax Index CATREG command, 25
- Page 342:
330 Syntax Index TRDATA (keyword) C